| Param | Original file | Final file |
|---|---|---|
| Filename | modeM0/AS1A13_037T01_9000006440_49812cztM0_level2.fits | modeM0/AS1A13_037T01_9000006440_49812cztM0_level2_quad_clean.evt |
| Size (bytes) | 1,072,408,320 | 62,314,560 |
| Size | 1022.7 MB | 59.4 MB |
| Events in quadrant A | 6,372,978 | 543,246 |
| Events in quadrant B | 4,244,036 | 665,910 |
| Events in quadrant C | 13,844,956 | 112,218 |
| Events in quadrant D | 14,741,623 | 119,440 |
| Mode M9 | |||
|---|---|---|---|
| Quadrant | BADHDUFLAG | Total packets | Discarded packets |
| A | 0 | 11 | 0 |
| B | 0 | 11 | 0 |
| C | 0 | 11 | 0 |
| D | 0 | 11 | 0 |
| Mode SS | |||
|---|---|---|---|
| Quadrant | BADHDUFLAG | Total packets | Discarded packets |
| A | 0 | 130 | 0 |
| B | 0 | 130 | 0 |
| C | 0 | 130 | 0 |
| D | 0 | 130 | 0 |
| Mode M0 | |||
|---|---|---|---|
| Quadrant | BADHDUFLAG | Total packets | Discarded packets |
| A | 0 | 23220 | 1 |
| B | 0 | 17023 | 1 |
| C | 0 | 45544 | 1 |
| D | 0 | 48082 | 1 |
| Quadrant | Total seconds | Saturated seconds | Saturation percentage |
|---|---|---|---|
| A | 6387 | 1033 | 16.173477% |
| B | 6387 | 406 | 6.356662% |
| C | 6387 | 5414 | 84.765931% |
| D | 6387 | 5328 | 83.419446% |
Noise dominated data is calculated using 1-second bins in cleaned event files. If a bin has >2000 counts, and if more than 50% of those come from <1% of pixels, then it is considered to be noise-dominated and hence unusable.
| Quadrant | # 1 sec bins | Bins with >0 counts | Bins with >2000 counts | High rate bins dominated by noise | Noise dominated (total time) | Noise dominated (detector-on time) | Marked lightcurve |
|---|---|---|---|---|---|---|---|
| A | 7452 | 6387 | 842 | 842 | 11.30% | 13.18% | 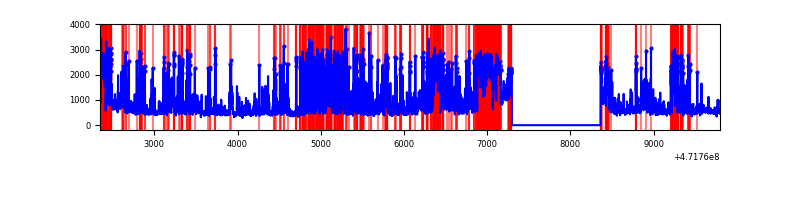 |
| B | 7452 | 6387 | 218 | 218 | 2.93% | 3.41% | 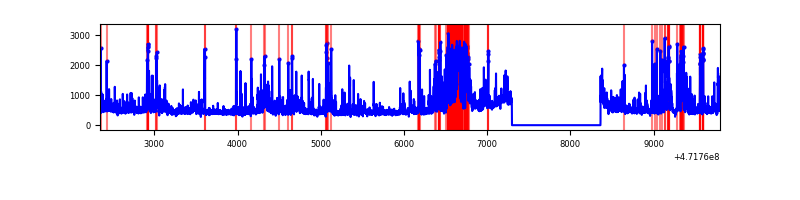 |
| C | 7451 | 6386 | 4480 | 4480 | 60.13% | 70.15% | 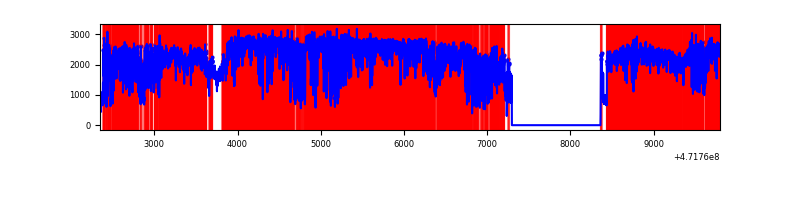 |
| D | 7451 | 6386 | 5306 | 5306 | 71.21% | 83.09% | 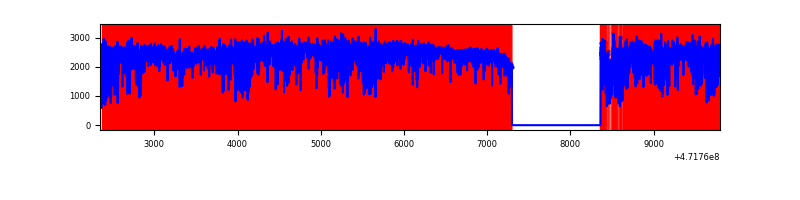 |
Top three noisy pixels from each quadrant. If the there are fewer than three noisy pixels in the level2.evt file, extra rows are filled as -1
| Pixel properties | Quadrant properties | ||||||
|---|---|---|---|---|---|---|---|
| Quadrant | DetID | PixID | Counts | Sigma | Mean | Median | Sigma |
| A | 0 | 98 | 706577 | 4222.46 | 669 | 655 | 167.2 |
| A | 15 | 63 | 434752 | 2596.54 | 669 | 655 | 167.2 |
| A | 5 | 16 | 336565 | 2009.24 | 669 | 655 | 167.2 |
| B | 10 | 28 | 356849 | 2375.5 | 706 | 683 | 149.9 |
| B | 10 | 44 | 307170 | 2044.16 | 706 | 683 | 149.9 |
| B | 5 | 185 | 276536 | 1839.84 | 706 | 683 | 149.9 |
| C | 15 | 147 | 3982629 | 41892.97 | 316 | 313 | 95.1 |
| C | 15 | 197 | 3692823 | 38844.28 | 316 | 313 | 95.1 |
| C | 1 | 44 | 2212946 | 23276.34 | 316 | 313 | 95.1 |
| D | 7 | 61 | 5022045 | 40788.14 | 395 | 379 | 123.1 |
| D | 15 | 185 | 1406848 | 11423.95 | 395 | 379 | 123.1 |
| D | 7 | 126 | 1157537 | 9398.94 | 395 | 379 | 123.1 |
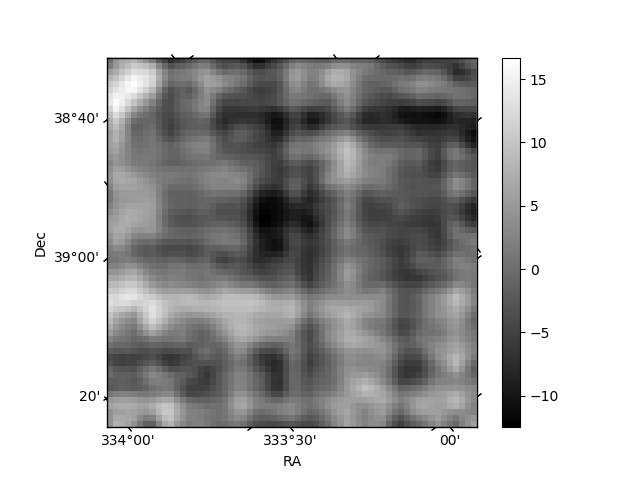
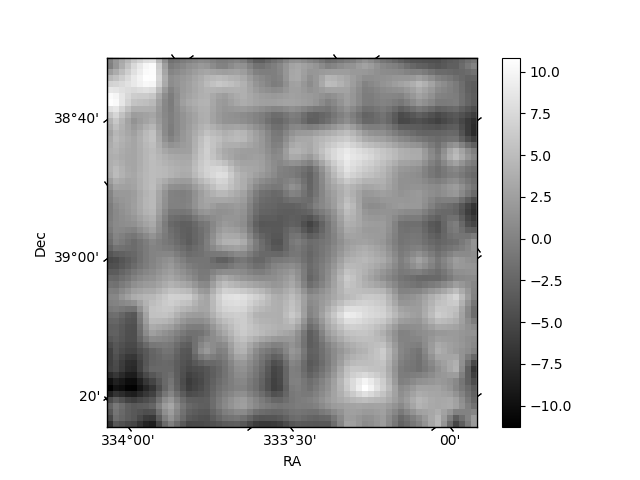
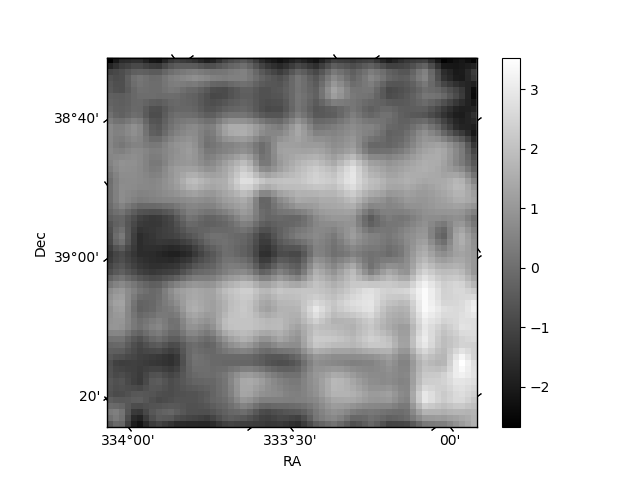
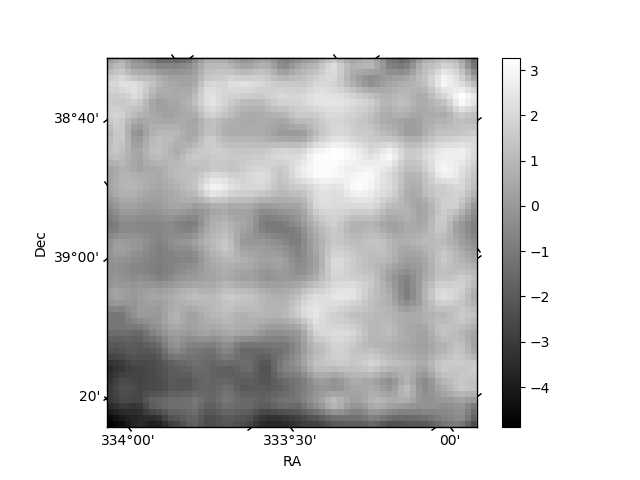
Histogram calculated using DETX and DETY for each event in the final _common_clean file
| Quadrant A | 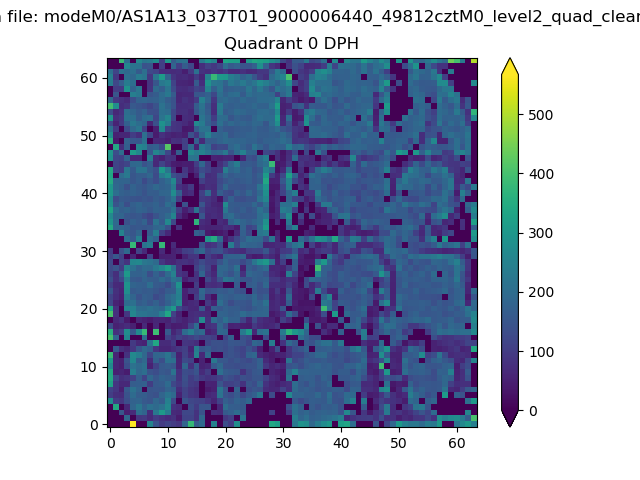 |
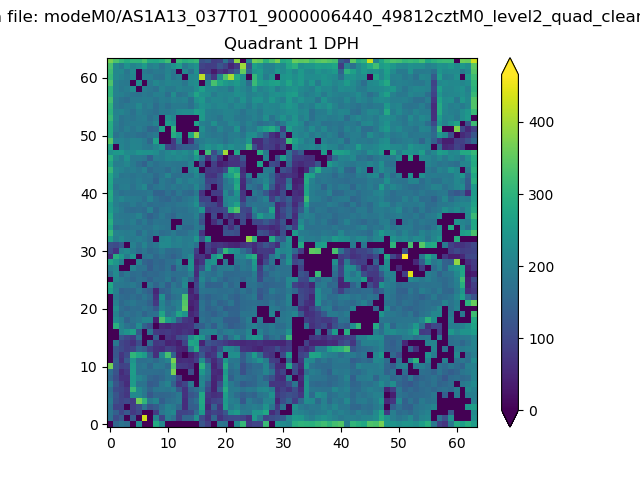 |
Quadrant B |
|---|---|---|---|
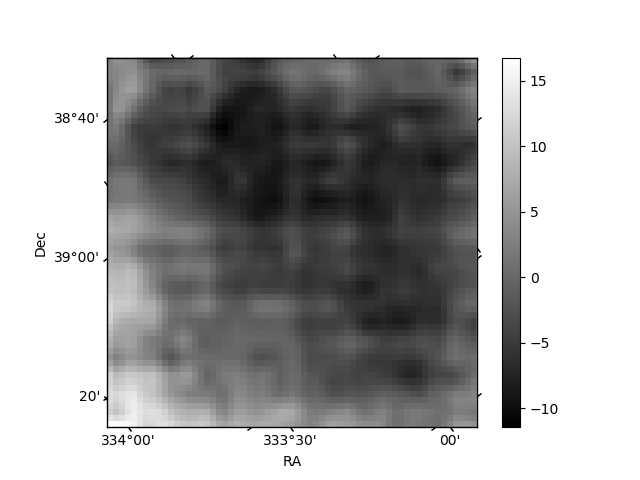
| Quadrant D | 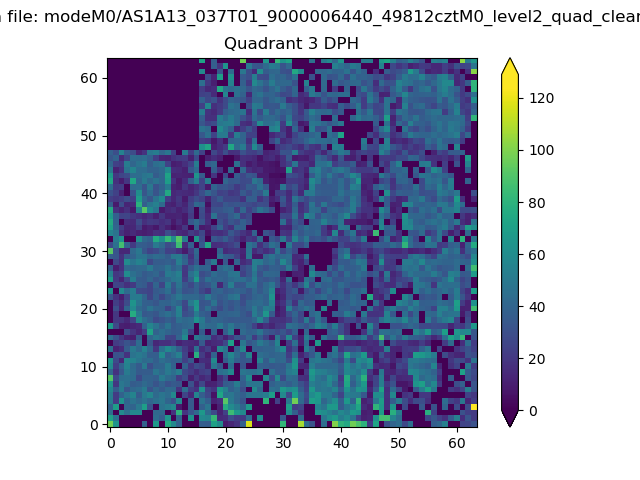 |
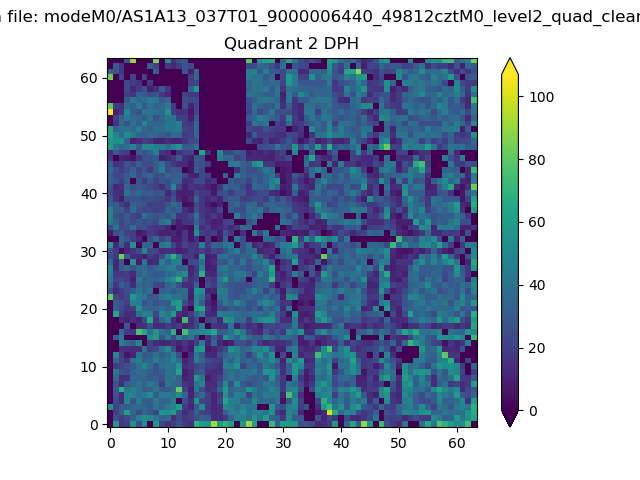 |
Quadrant C |
| Plot type | Count rate plots | Images |
|---|---|---|
| Comparison with Poisson distribution Blue bars denote a histogram of data divided into 1 sec bins. Red curve is a Poisson curve with rate = median count rate of data. |
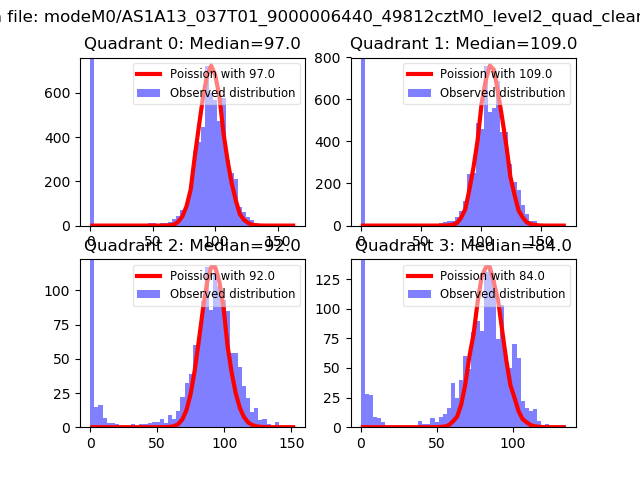 |
 |
| Quadrant-wise count rates Data is divided into 100 sec bins |
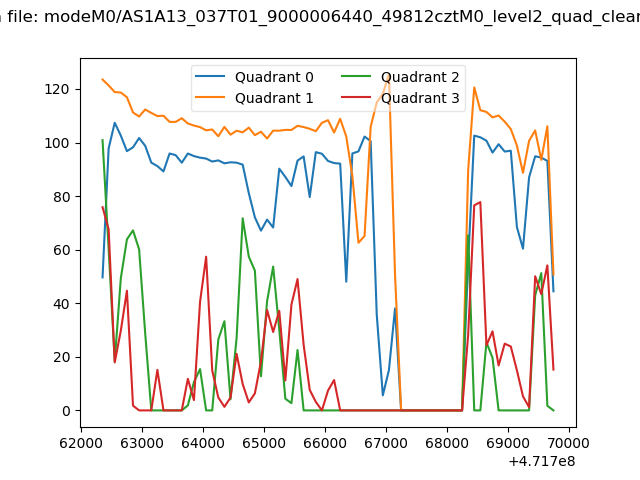 |
|
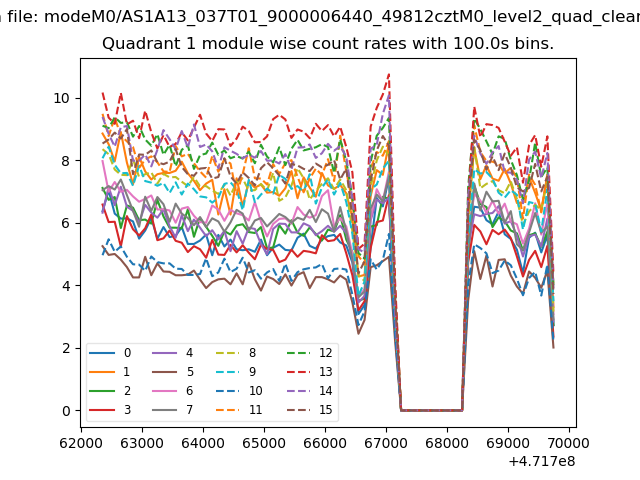
| Module-wise count rates for Quadrant A Data is divided into 100 sec bins |
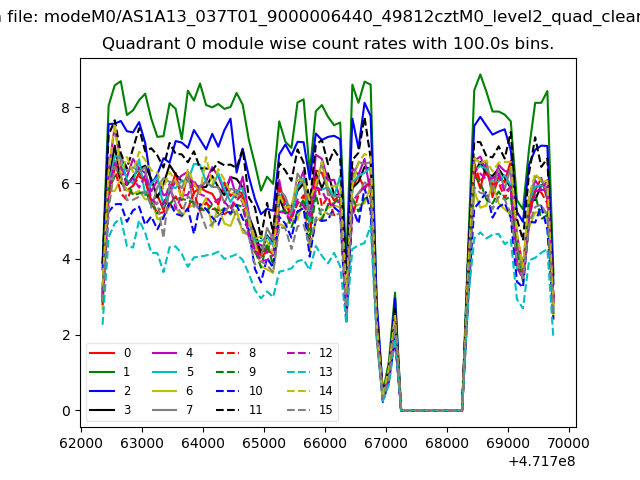 |
 |
| Module-wise count rates for Quadrant B Data is divided into 100 sec bins |
 |
 |
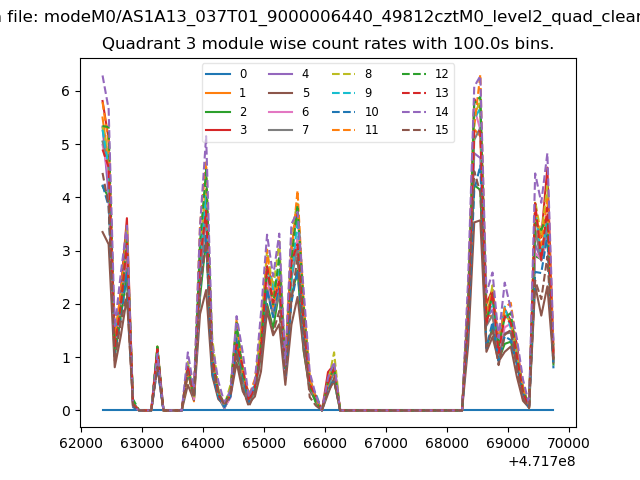
| Module-wise count rates for Quadrant C Data is divided into 100 sec bins |
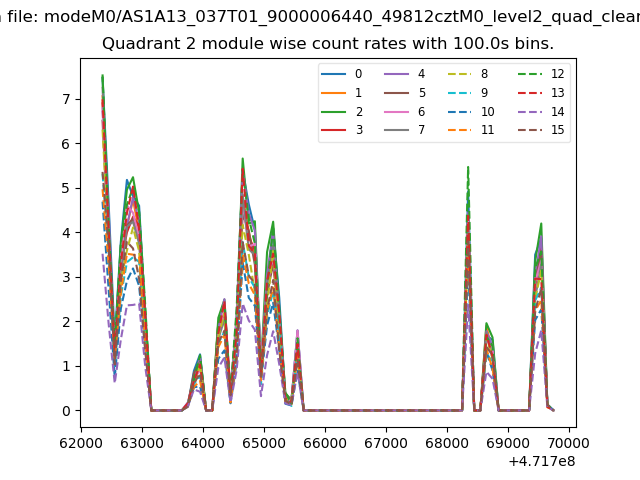 |
 |
| Module-wise count rates for Quadrant D Data is divided into 100 sec bins |
 |
 |
| Parameter | Plot |
|---|---|
| CZT HV Monitor | 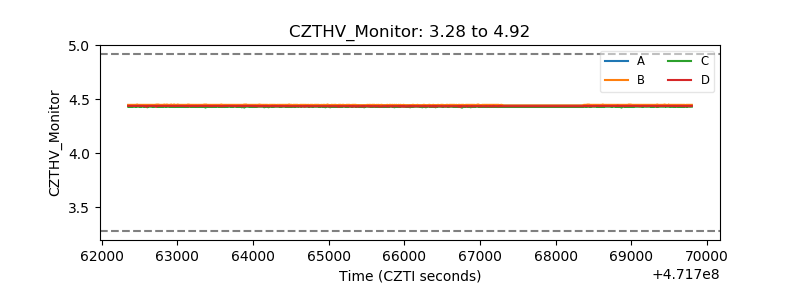 |
| D_VDD | 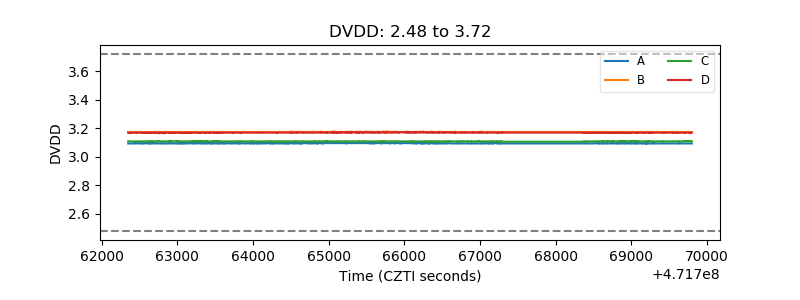 |
| Temperature 1 |  |
| Veto HV Monitor | 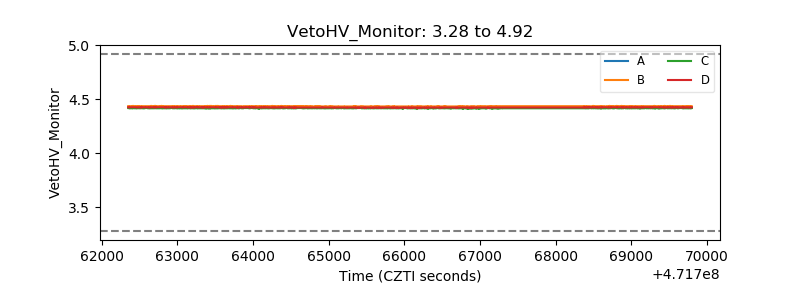 |
| Veto LLD | 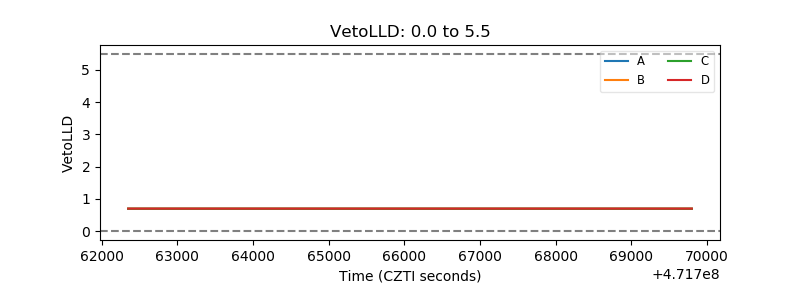 |
| Alpha Counter | 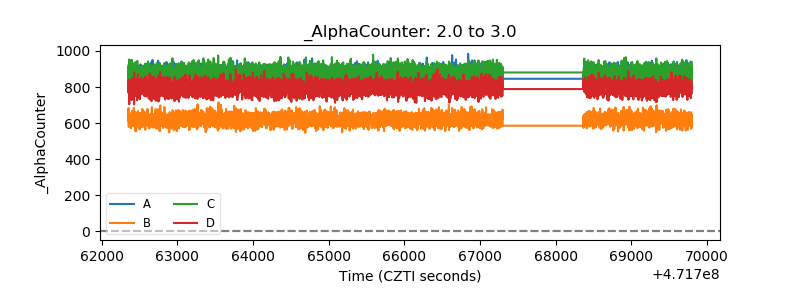 |
| _CPM_Rate | 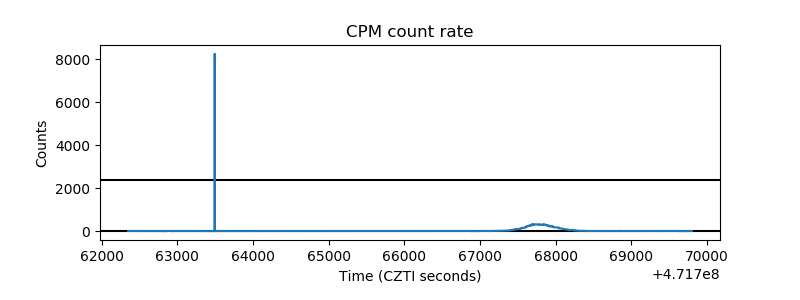 |
| CZT Counter | 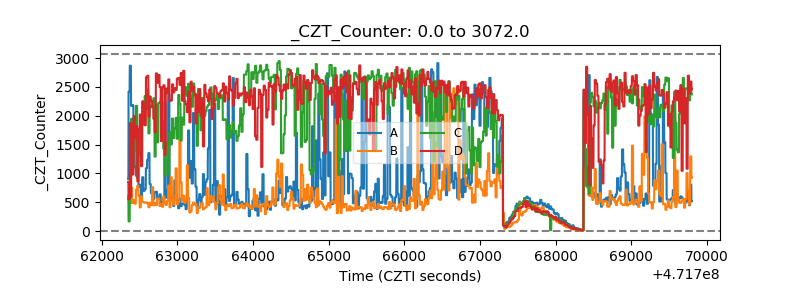 |
| +2.5 Volts monitor | 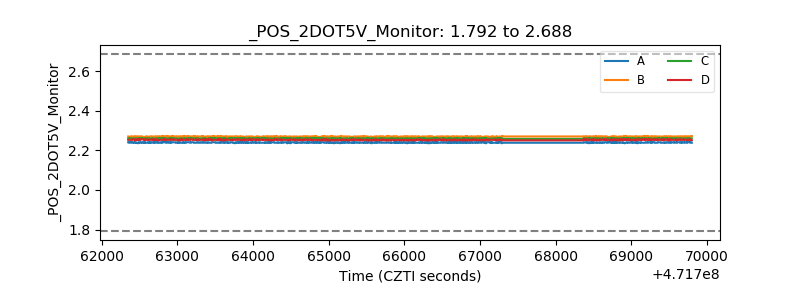 |
| +5 Volts monitor | 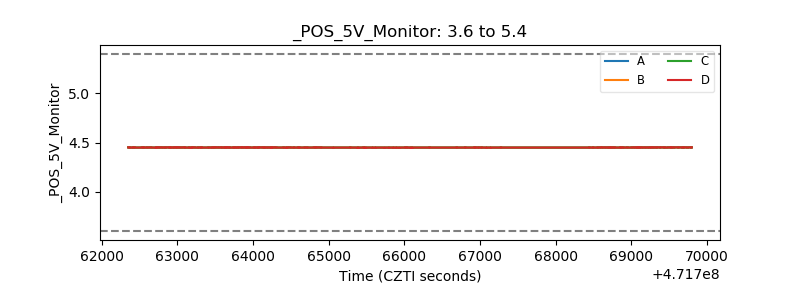 |
| _ROLL_ROT | 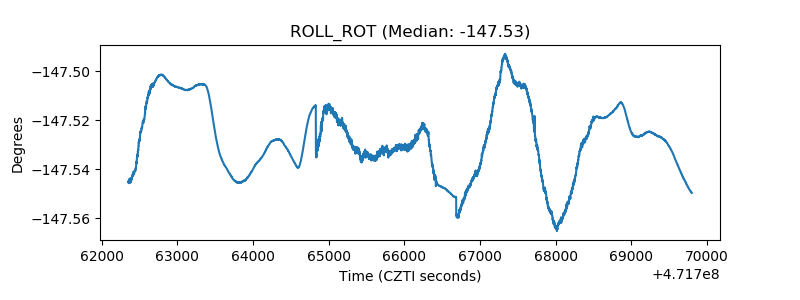 |
| _Roll_DEC | 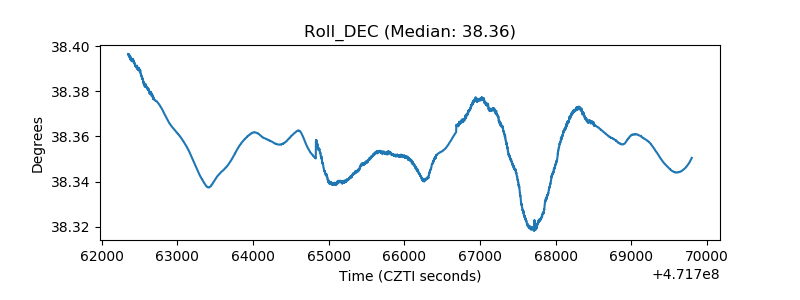 |
| _Roll_RA | 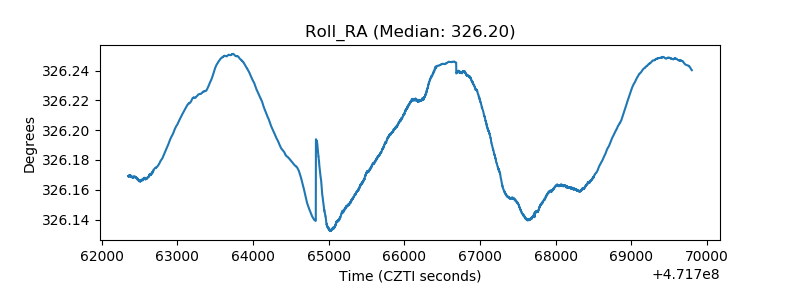 |
| Veto Counter | 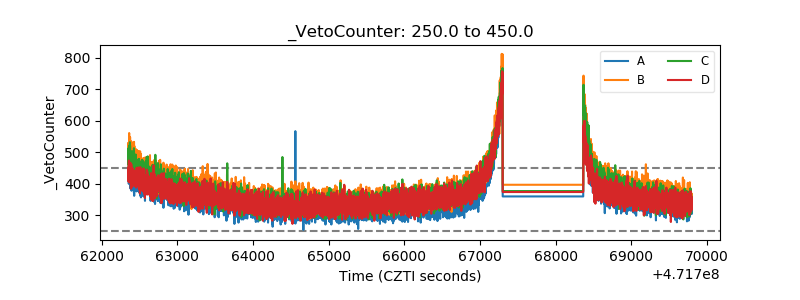 |