| Param | Original file | Final file |
|---|---|---|
| Filename | modeM0/AS1A13_037T01_9000006440_49813cztM0_level2.fits | modeM0/AS1A13_037T01_9000006440_49813cztM0_level2_quad_clean.evt |
| Size (bytes) | 1,068,641,280 | 62,040,960 |
| Size | 1019.1 MB | 59.2 MB |
| Events in quadrant A | 6,424,781 | 566,994 |
| Events in quadrant B | 4,281,885 | 685,874 |
| Events in quadrant C | 13,654,344 | 15,451 |
| Events in quadrant D | 14,671,155 | 136,794 |
| Mode M9 | |||
|---|---|---|---|
| Quadrant | BADHDUFLAG | Total packets | Discarded packets |
| A | 0 | 8 | 0 |
| B | 0 | 8 | 0 |
| C | 0 | 8 | 0 |
| D | 0 | 8 | 0 |
| Mode SS | |||
|---|---|---|---|
| Quadrant | BADHDUFLAG | Total packets | Discarded packets |
| A | 0 | 140 | 0 |
| B | 0 | 140 | 0 |
| C | 0 | 140 | 0 |
| D | 0 | 140 | 0 |
| Mode M0 | |||
|---|---|---|---|
| Quadrant | BADHDUFLAG | Total packets | Discarded packets |
| A | 0 | 23611 | 2 |
| B | 0 | 17428 | 2 |
| C | 0 | 45235 | 2 |
| D | 0 | 48179 | 2 |
| Quadrant | Total seconds | Saturated seconds | Saturation percentage |
|---|---|---|---|
| A | 6780 | 967 | 14.262537% |
| B | 6780 | 413 | 6.091445% |
| C | 6780 | 6657 | 98.185841% |
| D | 6780 | 5470 | 80.678466% |
Noise dominated data is calculated using 1-second bins in cleaned event files. If a bin has >2000 counts, and if more than 50% of those come from <1% of pixels, then it is considered to be noise-dominated and hence unusable.
| Quadrant | # 1 sec bins | Bins with >0 counts | Bins with >2000 counts | High rate bins dominated by noise | Noise dominated (total time) | Noise dominated (detector-on time) | Marked lightcurve |
|---|---|---|---|---|---|---|---|
| A | 7615 | 6780 | 776 | 776 | 10.19% | 11.45% | 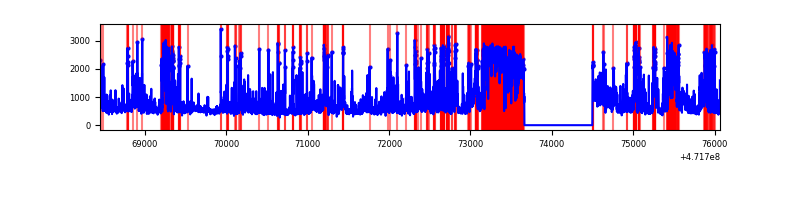 |
| B | 7615 | 6780 | 216 | 216 | 2.84% | 3.19% | 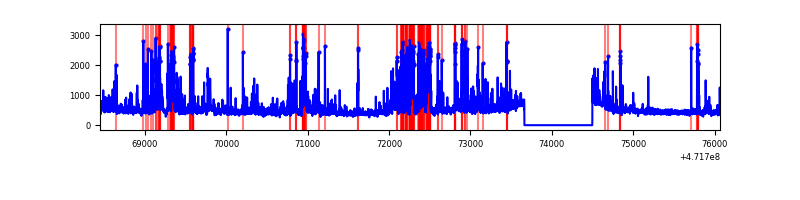 |
| C | 7614 | 6779 | 4216 | 4216 | 55.37% | 62.19% | 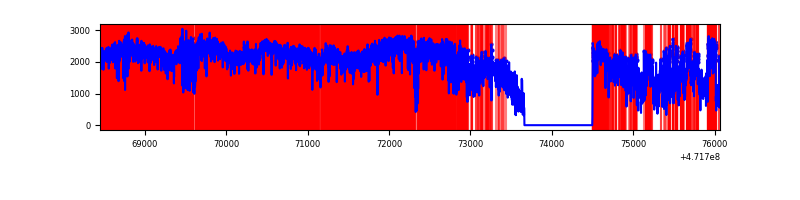 |
| D | 7615 | 6780 | 4767 | 4767 | 62.60% | 70.31% | 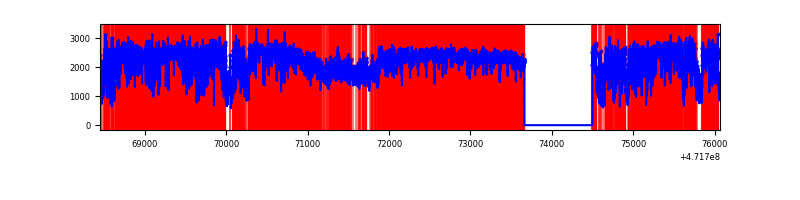 |
Top three noisy pixels from each quadrant. If the there are fewer than three noisy pixels in the level2.evt file, extra rows are filled as -1
| Pixel properties | Quadrant properties | ||||||
|---|---|---|---|---|---|---|---|
| Quadrant | DetID | PixID | Counts | Sigma | Mean | Median | Sigma |
| A | 0 | 98 | 1032521 | 5866.22 | 703 | 688 | 175.9 |
| A | 15 | 63 | 635062 | 3606.57 | 703 | 688 | 175.9 |
| A | 8 | 38 | 290959 | 1650.26 | 703 | 688 | 175.9 |
| B | 10 | 44 | 460883 | 2959.7 | 735 | 713 | 155.5 |
| B | 10 | 28 | 209345 | 1341.87 | 735 | 713 | 155.5 |
| B | 4 | 206 | 164684 | 1054.62 | 735 | 713 | 155.5 |
| C | 15 | 197 | 4570702 | 95593.5 | 141 | 139 | 47.8 |
| C | 1 | 23 | 2387879 | 49939.67 | 141 | 139 | 47.8 |
| C | 15 | 148 | 1812008 | 37895.31 | 141 | 139 | 47.8 |
| D | 7 | 61 | 3658969 | 30980.97 | 374 | 357 | 118.1 |
| D | 15 | 185 | 2594391 | 21966.17 | 374 | 357 | 118.1 |
| D | 15 | 142 | 2346588 | 19867.78 | 374 | 357 | 118.1 |
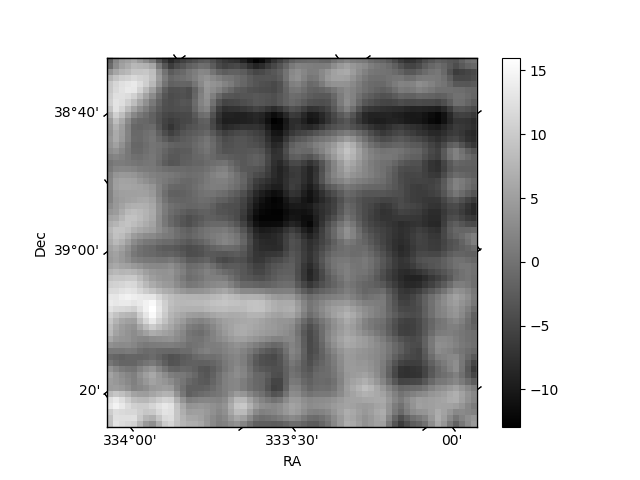
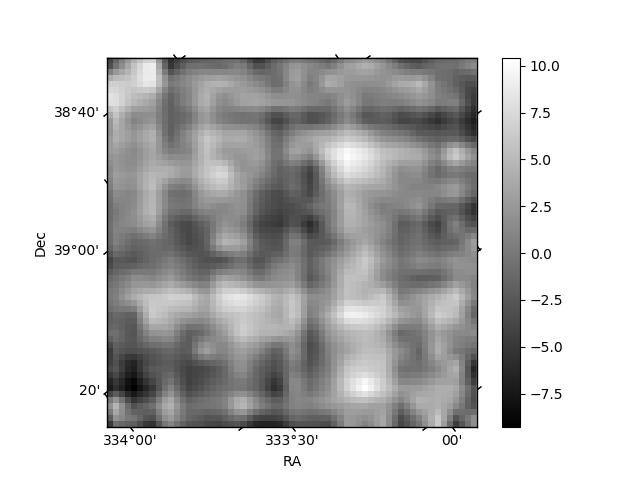
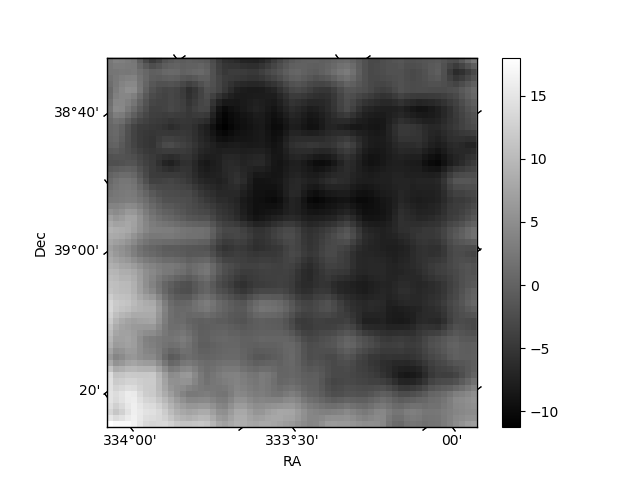
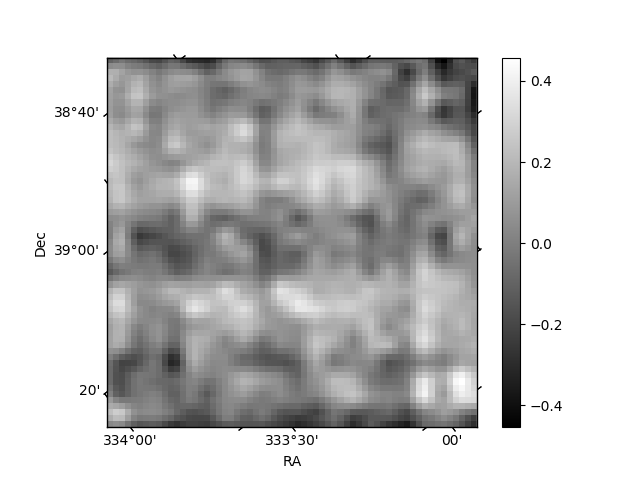
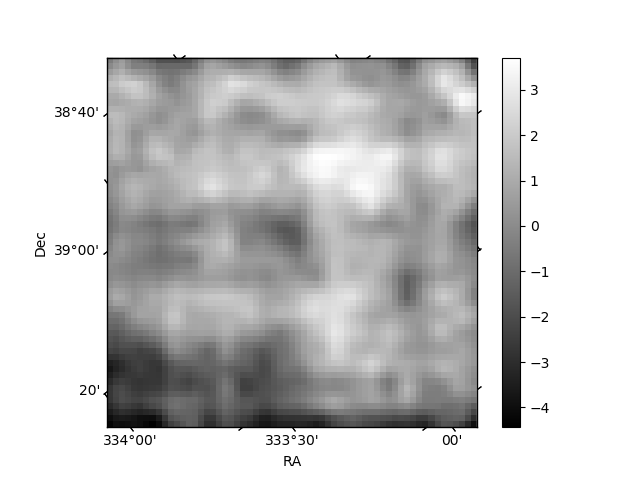
Histogram calculated using DETX and DETY for each event in the final _common_clean file
| Quadrant A | 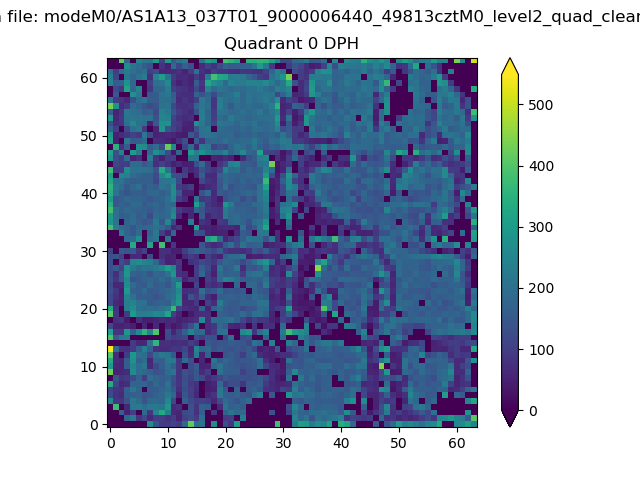 |
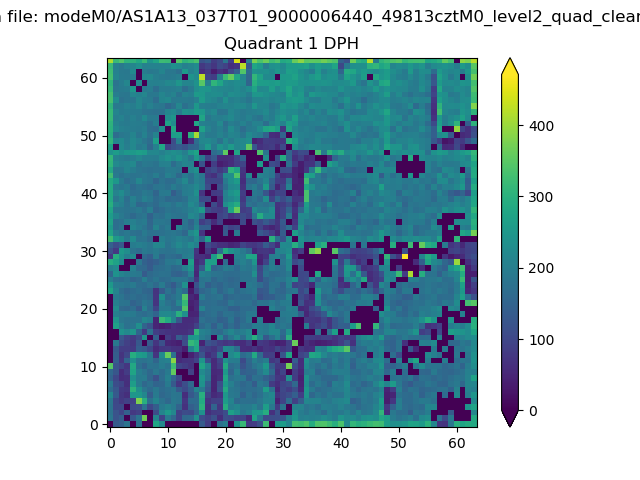 |
Quadrant B |
|---|---|---|---|
| Quadrant D | 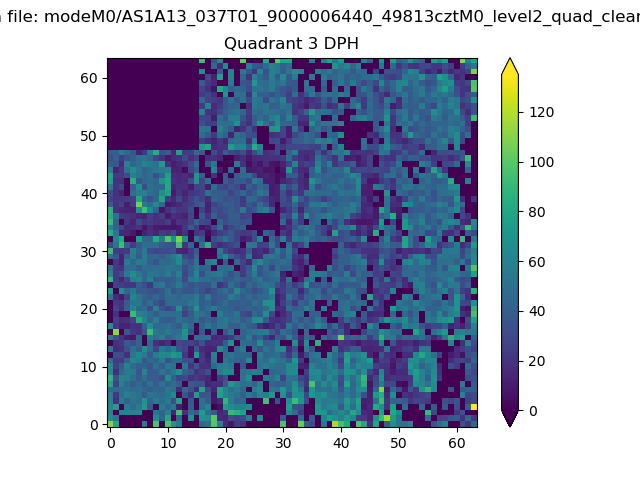 |
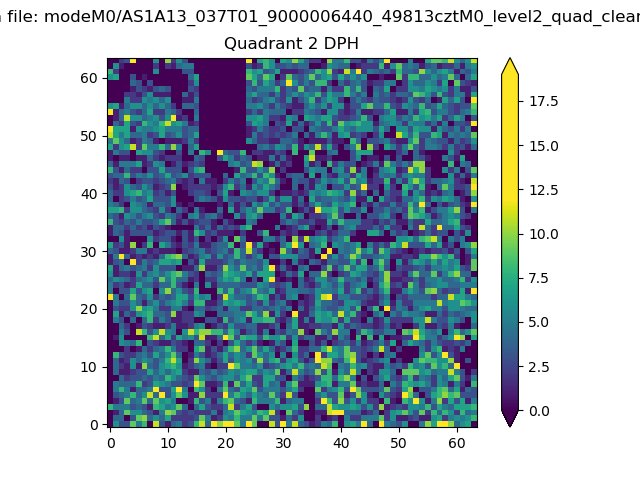 |
Quadrant C |
| Plot type | Count rate plots | Images |
|---|---|---|
| Comparison with Poisson distribution Blue bars denote a histogram of data divided into 1 sec bins. Red curve is a Poisson curve with rate = median count rate of data. |
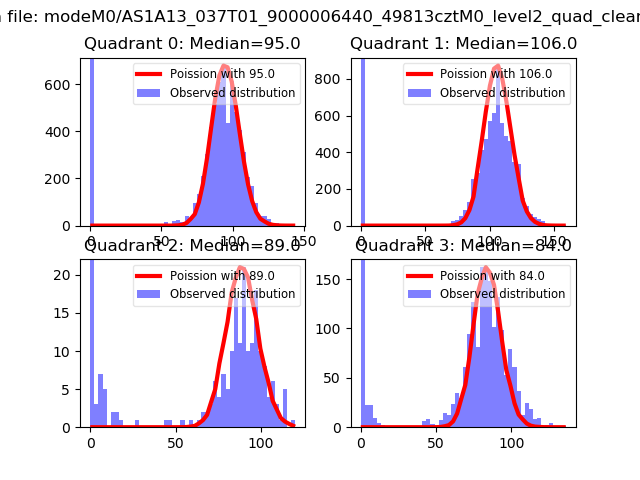 |
 |
| Quadrant-wise count rates Data is divided into 100 sec bins |
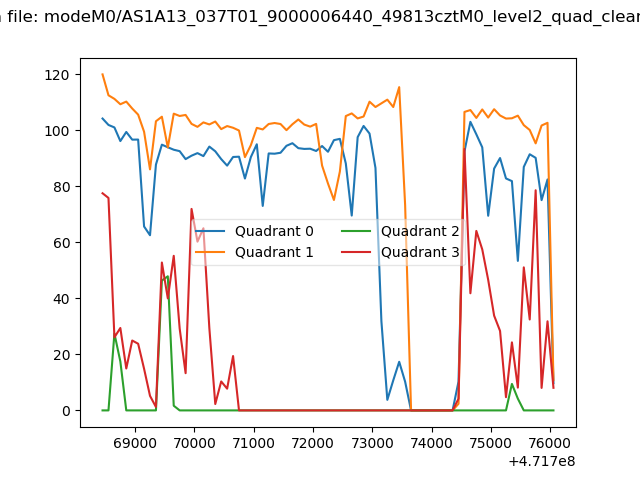 |
|
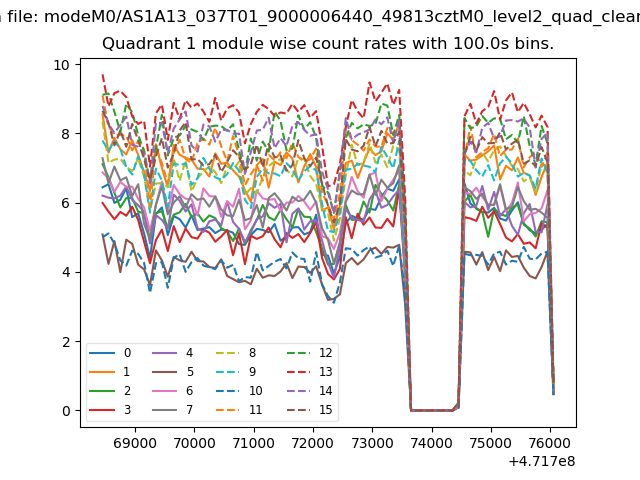
| Module-wise count rates for Quadrant A Data is divided into 100 sec bins |
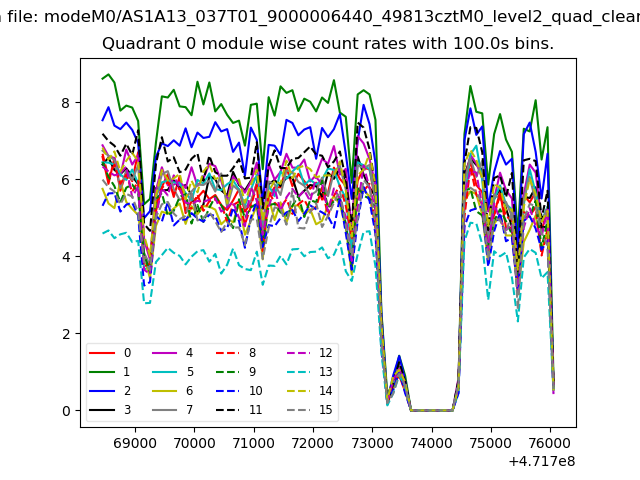 |
 |
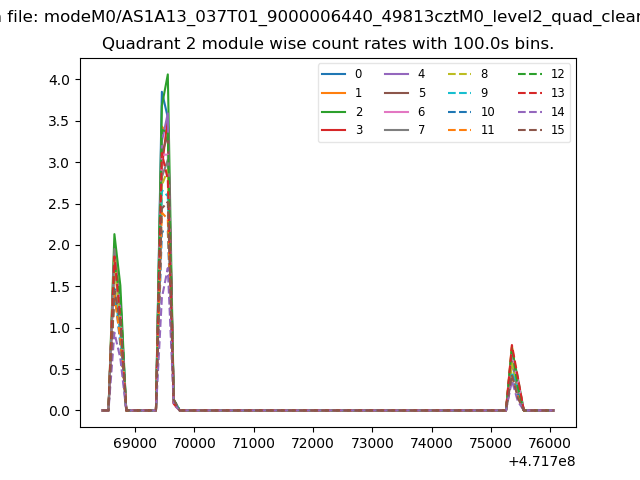
| Module-wise count rates for Quadrant B Data is divided into 100 sec bins |
 |
 |
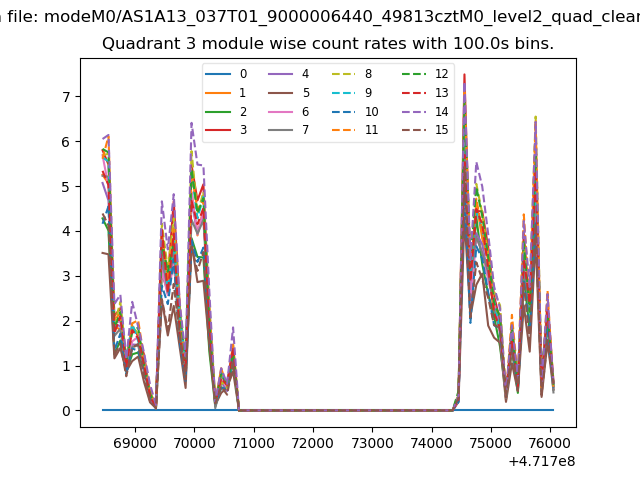
| Module-wise count rates for Quadrant C Data is divided into 100 sec bins |
 |
 |
| Module-wise count rates for Quadrant D Data is divided into 100 sec bins |
 |
 |
| Parameter | Plot |
|---|---|
| CZT HV Monitor | 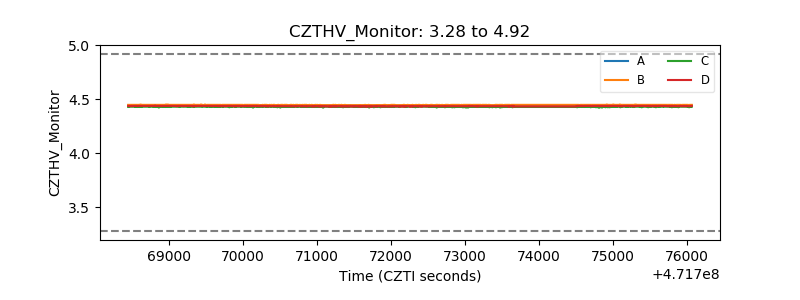 |
| D_VDD | 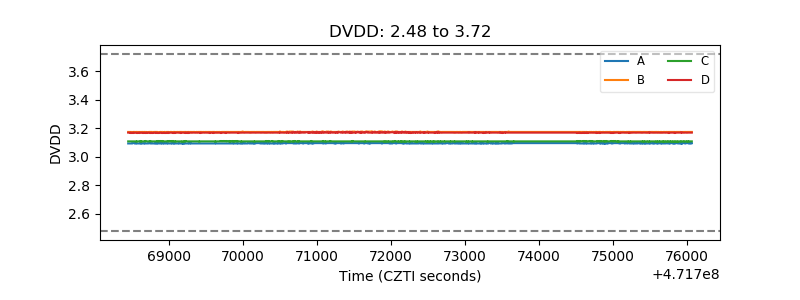 |
| Temperature 1 | 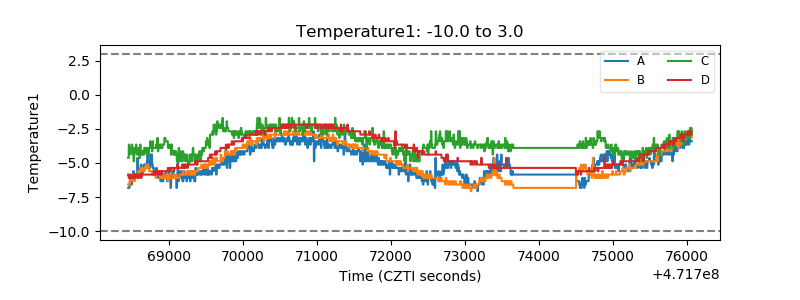 |
| Veto HV Monitor | 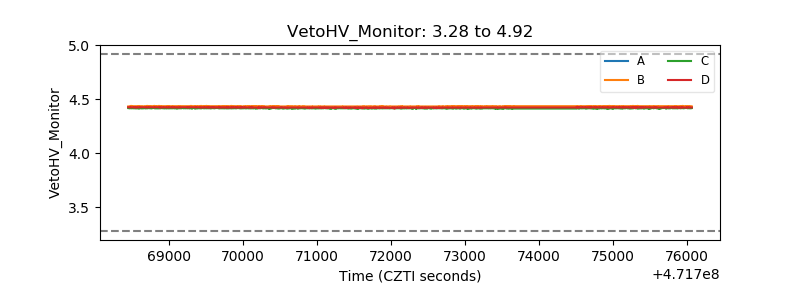 |
| Veto LLD | 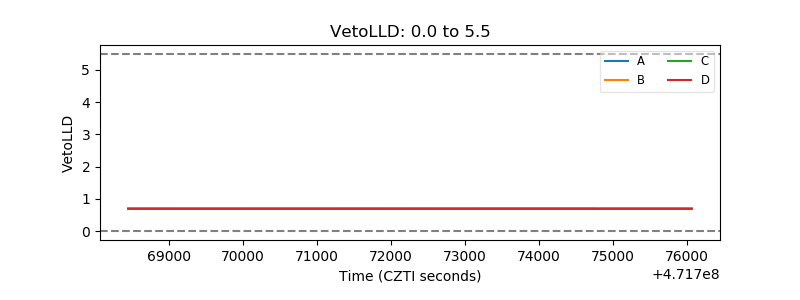 |
| Alpha Counter | 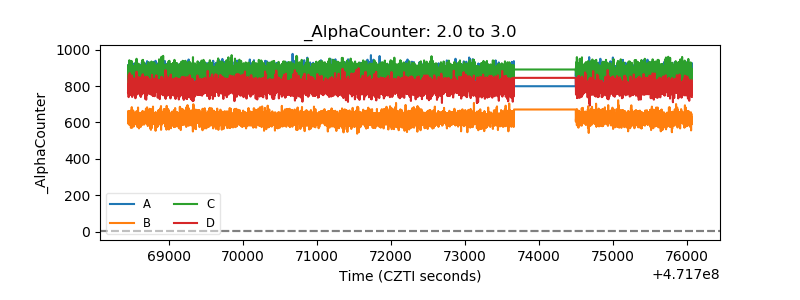 |
| _CPM_Rate | 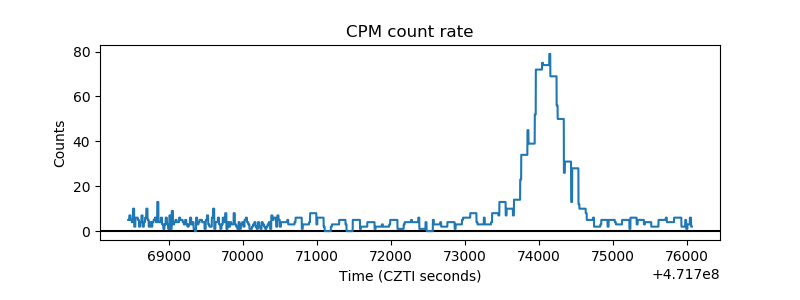 |
| CZT Counter | 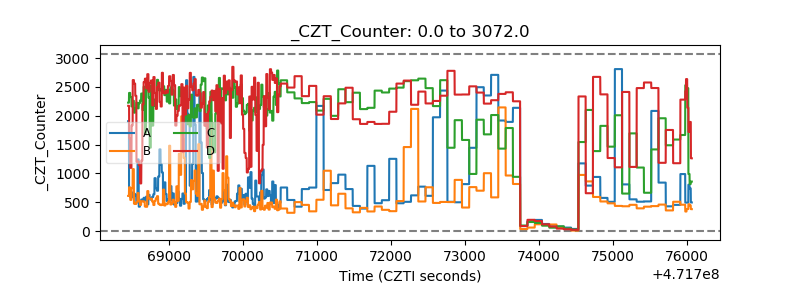 |
| +2.5 Volts monitor | 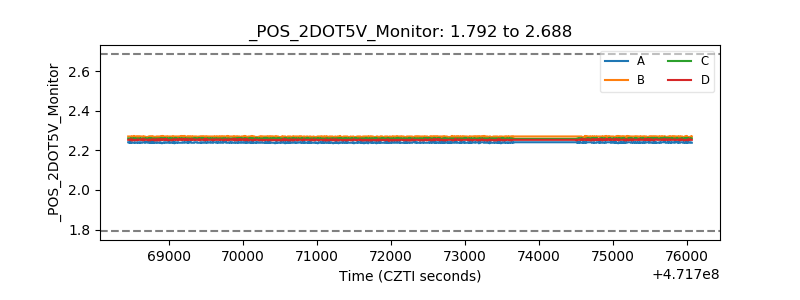 |
| +5 Volts monitor | 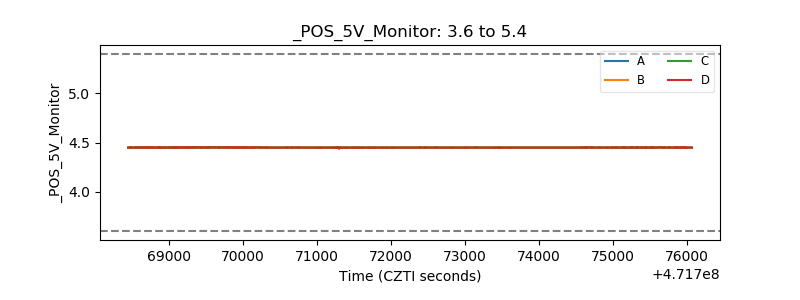 |
| _ROLL_ROT | 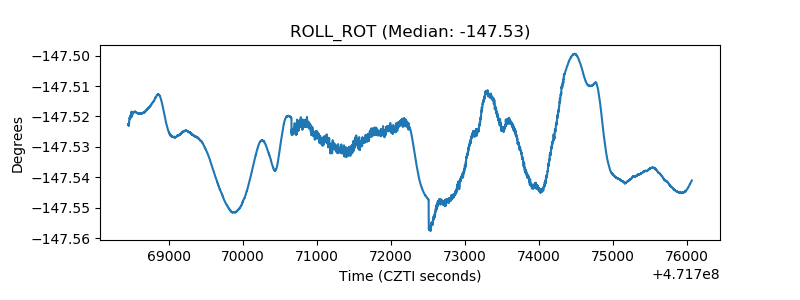 |
| _Roll_DEC | 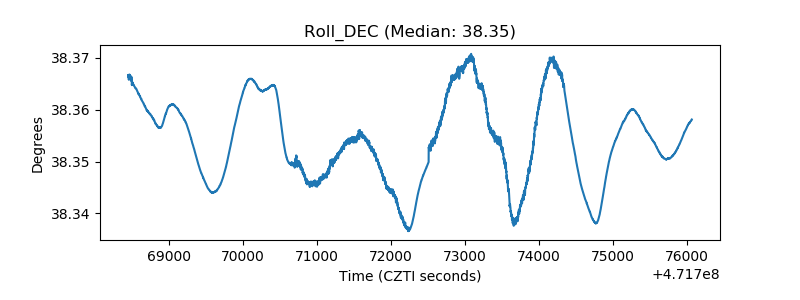 |
| _Roll_RA | 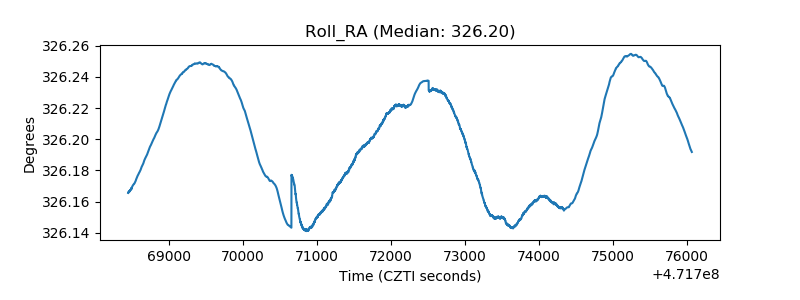 |
| Veto Counter | 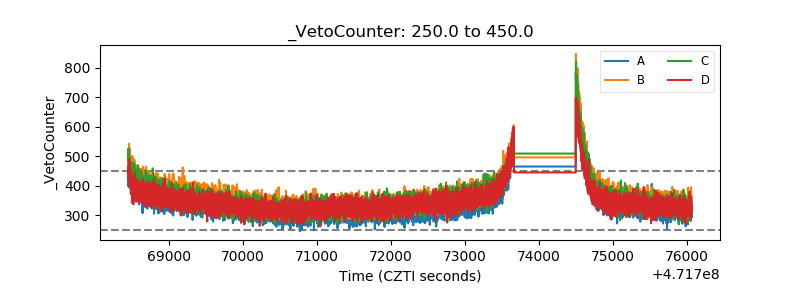 |