| Param | Original file | Final file |
|---|---|---|
| Filename | modeM0/AS1A13_037T01_9000006440_49814cztM0_level2.fits | modeM0/AS1A13_037T01_9000006440_49814cztM0_level2_quad_clean.evt |
| Size (bytes) | 1,159,424,640 | 56,822,400 |
| Size | 1.1 GB | 54.2 MB |
| Events in quadrant A | 9,869,724 | 423,712 |
| Events in quadrant B | 3,794,889 | 673,336 |
| Events in quadrant C | 13,066,678 | 43,069 |
| Events in quadrant D | 15,669,243 | 113,266 |
| Mode M9 | |||
|---|---|---|---|
| Quadrant | BADHDUFLAG | Total packets | Discarded packets |
| A | 0 | 3 | 0 |
| B | 0 | 3 | 0 |
| C | 0 | 3 | 0 |
| D | 0 | 3 | 0 |
| Mode SS | |||
|---|---|---|---|
| Quadrant | BADHDUFLAG | Total packets | Discarded packets |
| A | 0 | 140 | 0 |
| B | 0 | 140 | 0 |
| C | 0 | 140 | 0 |
| D | 0 | 140 | 0 |
| Mode M0 | |||
|---|---|---|---|
| Quadrant | BADHDUFLAG | Total packets | Discarded packets |
| A | 0 | 33898 | 1 |
| B | 0 | 15983 | 1 |
| C | 0 | 43504 | 6 |
| D | 0 | 51073 | 1 |
| Quadrant | Total seconds | Saturated seconds | Saturation percentage |
|---|---|---|---|
| A | 6694 | 2475 | 36.973409% |
| B | 6695 | 275 | 4.107543% |
| C | 6694 | 6354 | 94.920825% |
| D | 6694 | 5594 | 83.567374% |
Noise dominated data is calculated using 1-second bins in cleaned event files. If a bin has >2000 counts, and if more than 50% of those come from <1% of pixels, then it is considered to be noise-dominated and hence unusable.
| Quadrant | # 1 sec bins | Bins with >0 counts | Bins with >2000 counts | High rate bins dominated by noise | Noise dominated (total time) | Noise dominated (detector-on time) | Marked lightcurve |
|---|---|---|---|---|---|---|---|
| A | 6989 | 6694 | 2228 | 2228 | 31.88% | 33.28% | 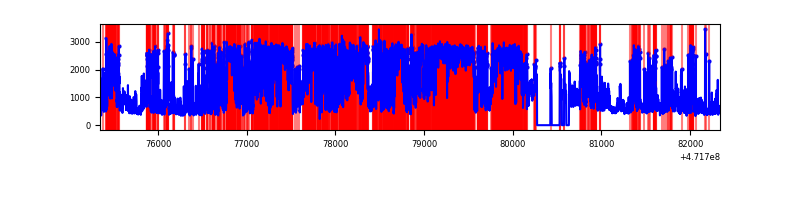 |
| B | 6990 | 6696 | 63 | 63 | 0.90% | 0.94% | 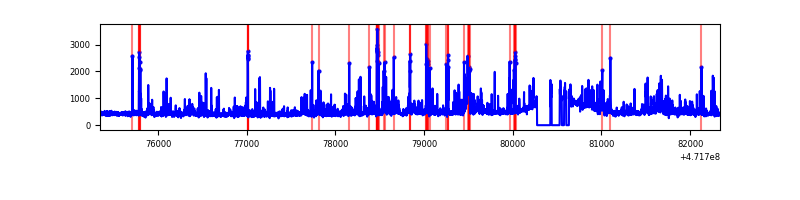 |
| C | 6988 | 6693 | 3906 | 3906 | 55.90% | 58.36% | 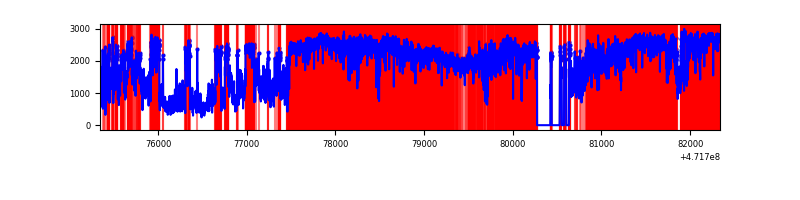 |
| D | 6988 | 6693 | 5460 | 5460 | 78.13% | 81.58% | 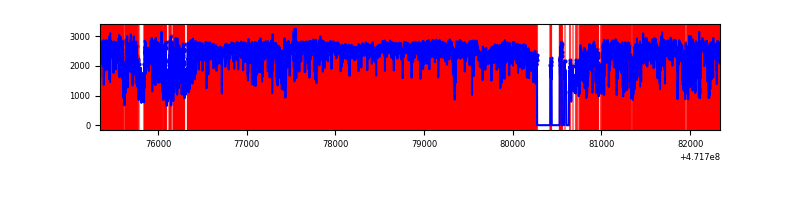 |
Top three noisy pixels from each quadrant. If the there are fewer than three noisy pixels in the level2.evt file, extra rows are filled as -1
| Pixel properties | Quadrant properties | ||||||
|---|---|---|---|---|---|---|---|
| Quadrant | DetID | PixID | Counts | Sigma | Mean | Median | Sigma |
| A | 0 | 98 | 1900497 | 11757.73 | 623 | 607 | 161.6 |
| A | 15 | 63 | 1072220 | 6631.82 | 623 | 607 | 161.6 |
| A | 5 | 16 | 960890 | 5942.84 | 623 | 607 | 161.6 |
| B | 10 | 28 | 322606 | 2083.54 | 726 | 703 | 154.5 |
| B | 4 | 206 | 153318 | 987.81 | 726 | 703 | 154.5 |
| B | 10 | 44 | 65884 | 421.89 | 726 | 703 | 154.5 |
| C | 1 | 44 | 3051168 | 45526.05 | 206 | 203 | 67.0 |
| C | 15 | 197 | 1946164 | 29037.34 | 206 | 203 | 67.0 |
| C | 15 | 164 | 1648113 | 24589.87 | 206 | 203 | 67.0 |
| D | 15 | 185 | 3726718 | 29759.22 | 415 | 400 | 125.2 |
| D | 7 | 61 | 2138465 | 17075.07 | 415 | 400 | 125.2 |
| D | 15 | 142 | 1592166 | 12712.2 | 415 | 400 | 125.2 |
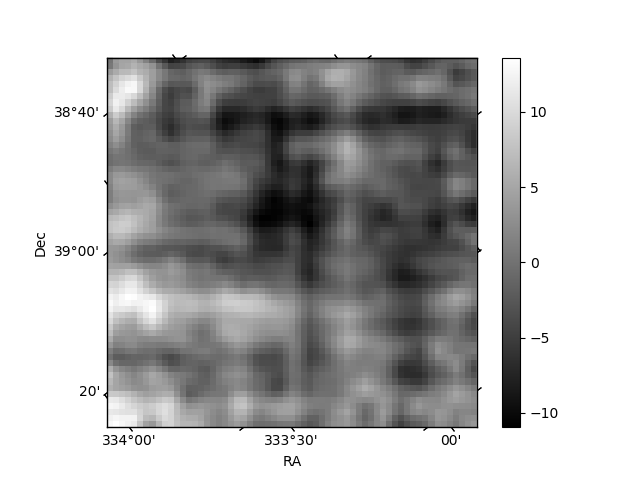
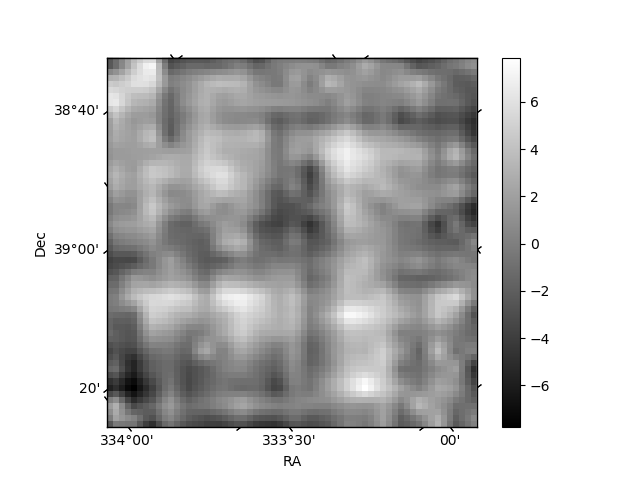
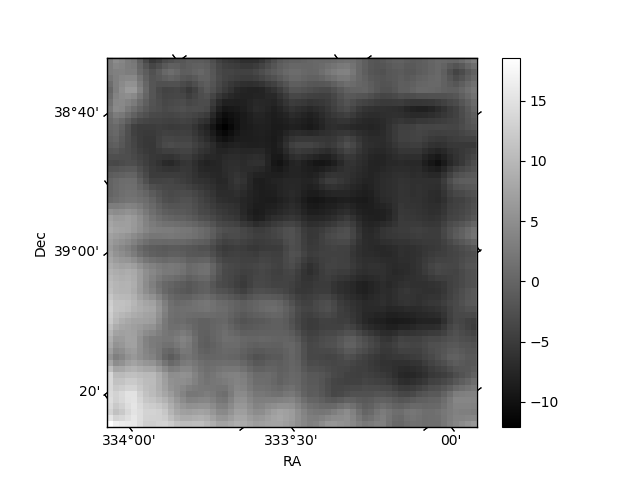
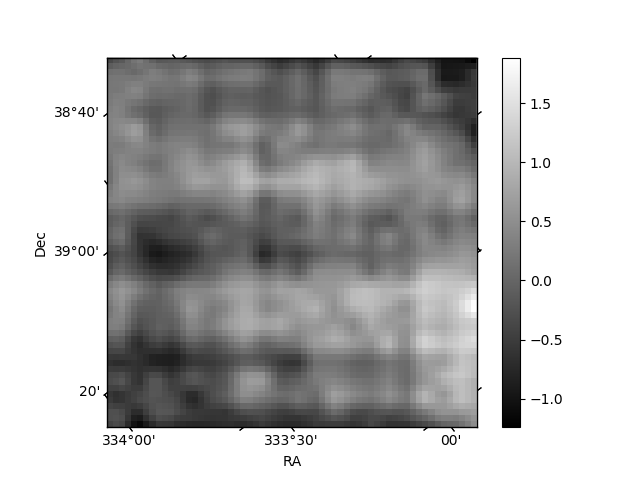
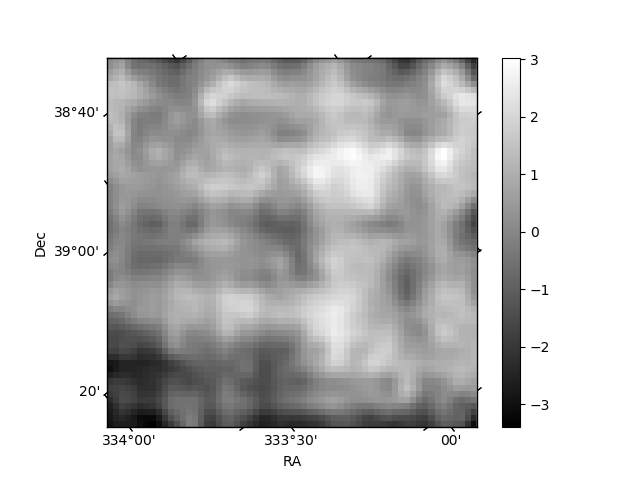
Histogram calculated using DETX and DETY for each event in the final _common_clean file
| Quadrant A | 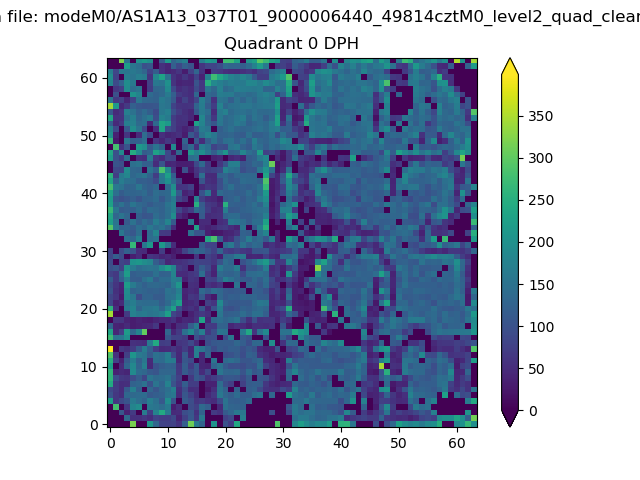 |
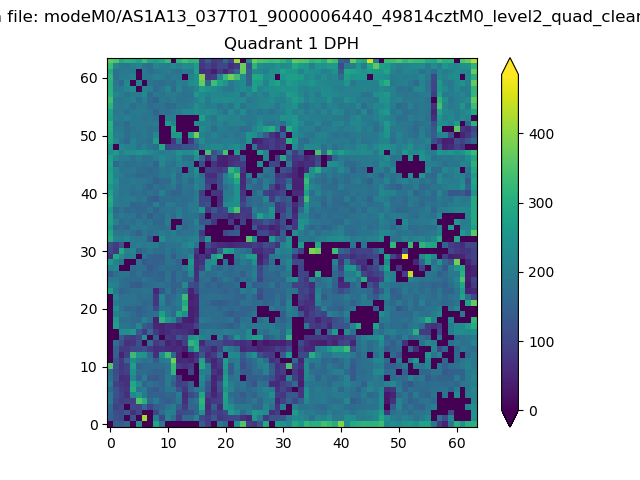 |
Quadrant B |
|---|---|---|---|
| Quadrant D | 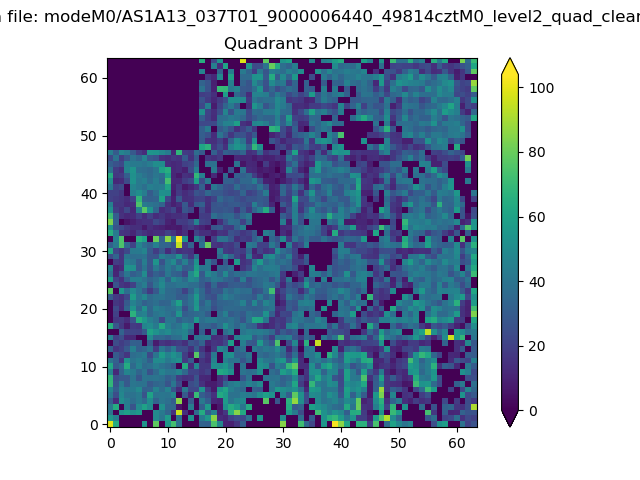 |
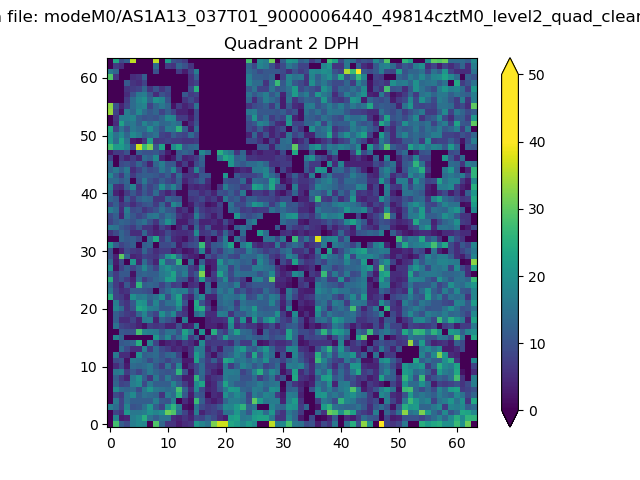 |
Quadrant C |
| Plot type | Count rate plots | Images |
|---|---|---|
| Comparison with Poisson distribution Blue bars denote a histogram of data divided into 1 sec bins. Red curve is a Poisson curve with rate = median count rate of data. |
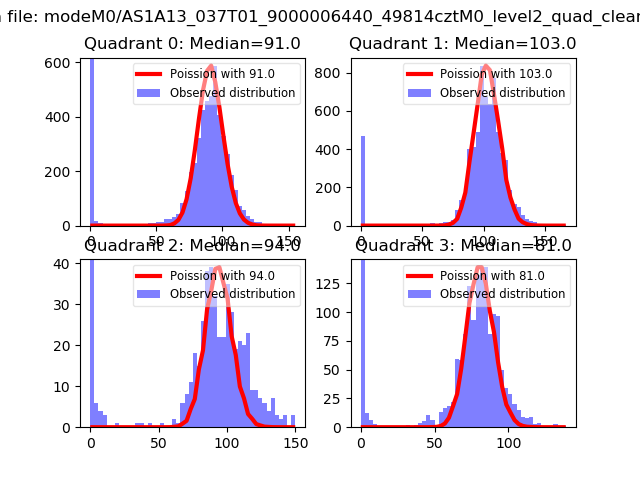 |
 |
| Quadrant-wise count rates Data is divided into 100 sec bins |
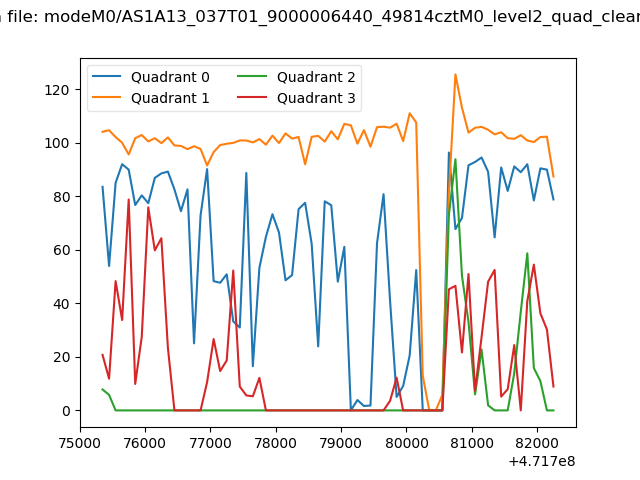 |
|
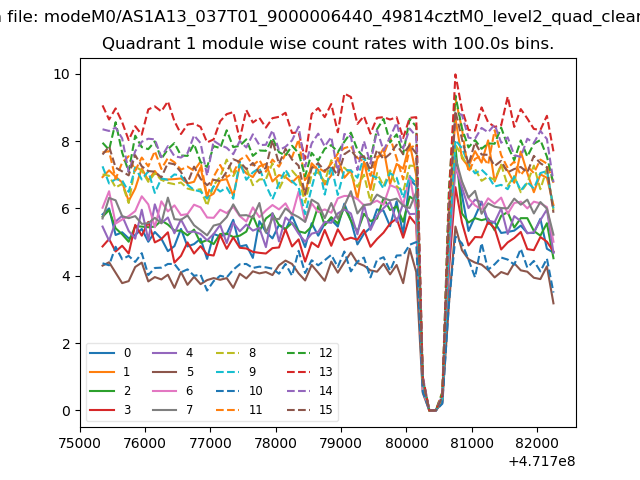
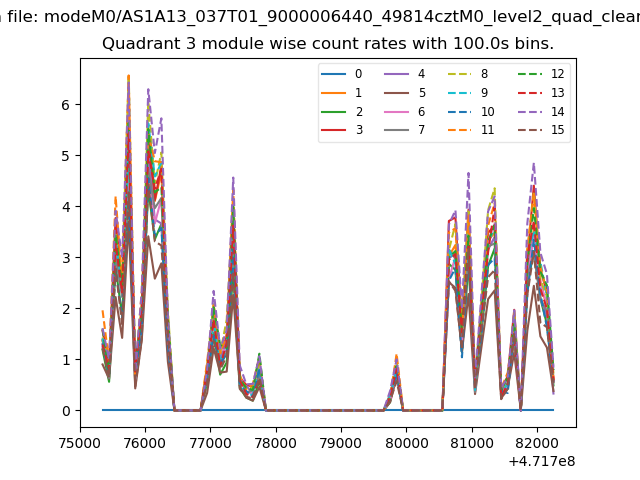
| Module-wise count rates for Quadrant A Data is divided into 100 sec bins |
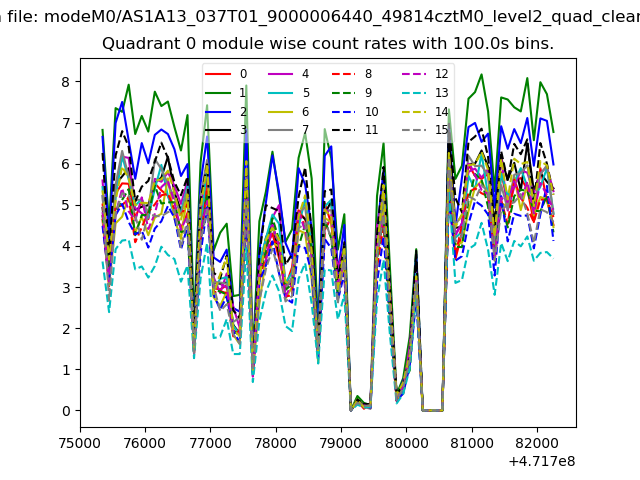 |
 |
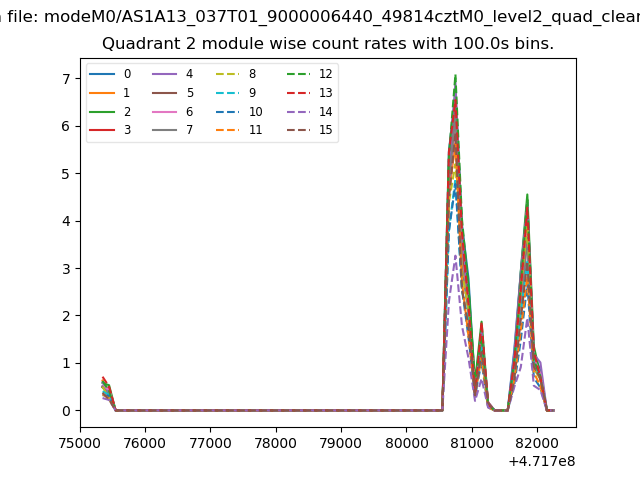
| Module-wise count rates for Quadrant B Data is divided into 100 sec bins |
 |
 |
| Module-wise count rates for Quadrant C Data is divided into 100 sec bins |
 |
 |
| Module-wise count rates for Quadrant D Data is divided into 100 sec bins |
 |
 |
| Parameter | Plot |
|---|---|
| CZT HV Monitor |  |
| D_VDD | 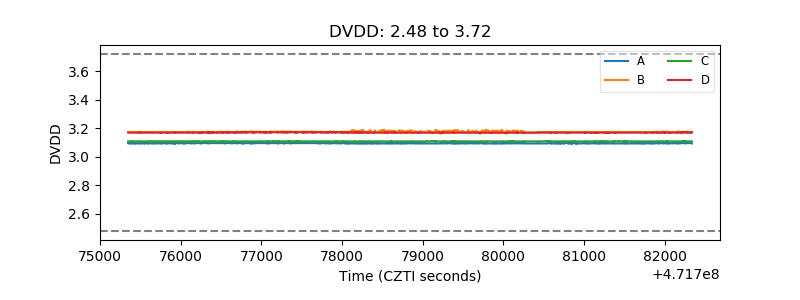 |
| Temperature 1 | 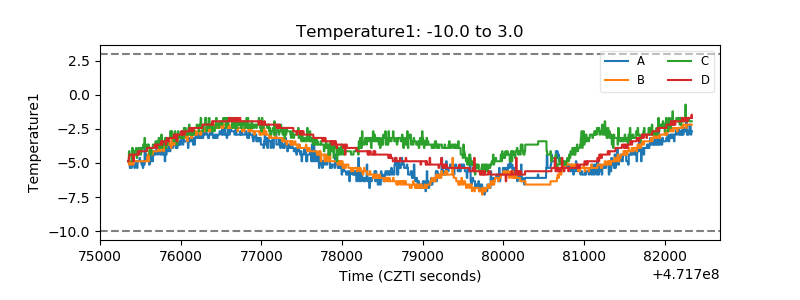 |
| Veto HV Monitor | 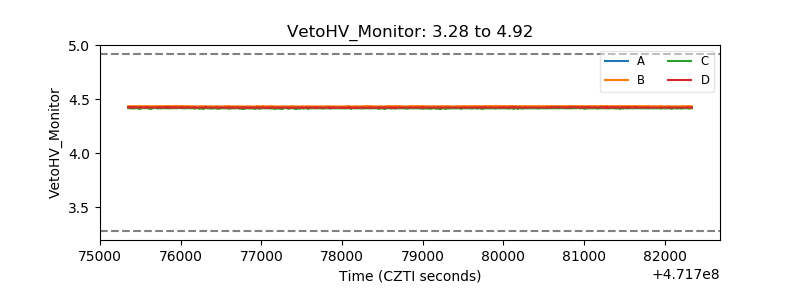 |
| Veto LLD | 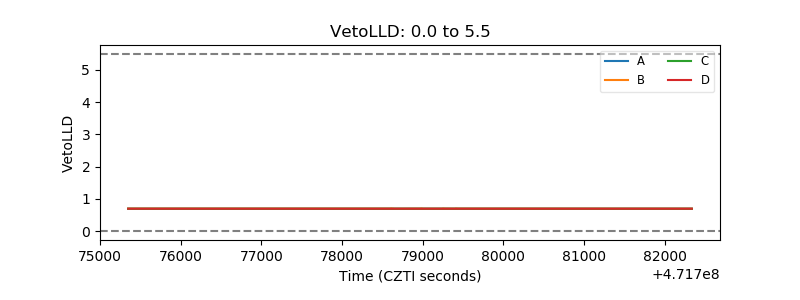 |
| Alpha Counter | 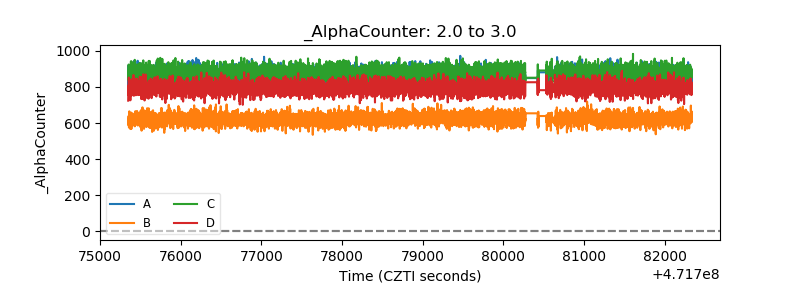 |
| _CPM_Rate | 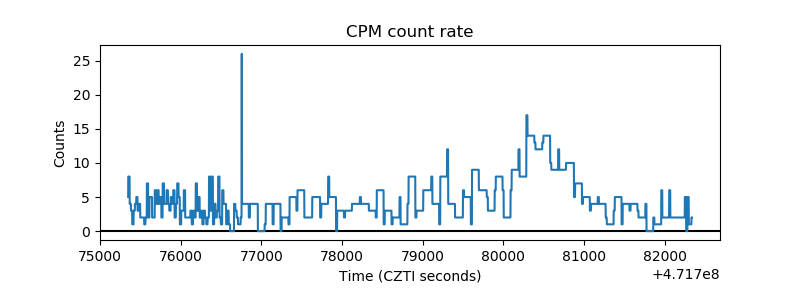 |
| CZT Counter | 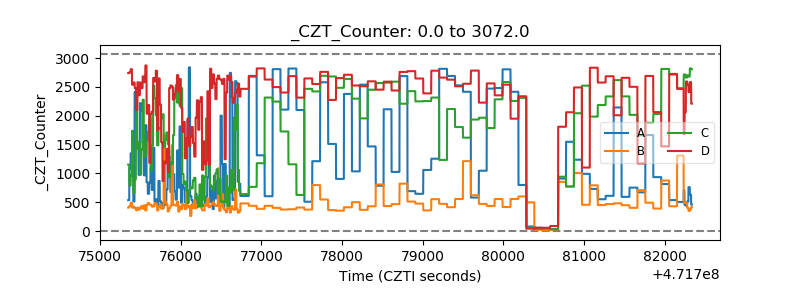 |
| +2.5 Volts monitor | 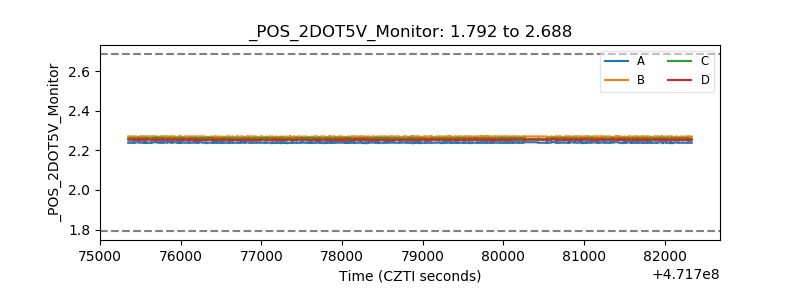 |
| +5 Volts monitor | 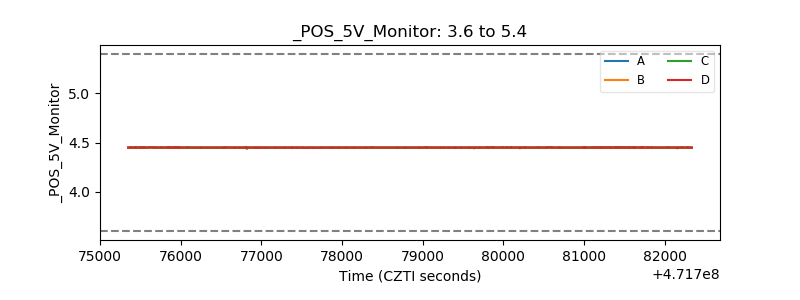 |
| _ROLL_ROT | 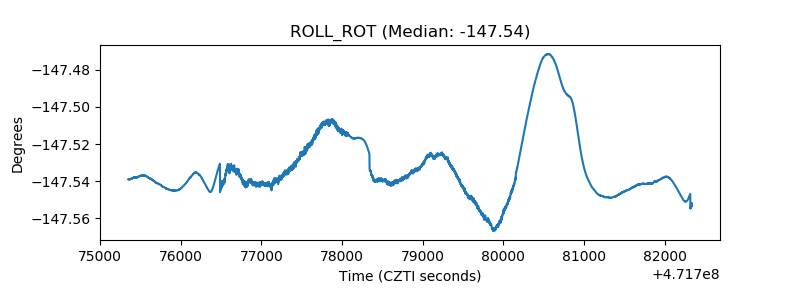 |
| _Roll_DEC | 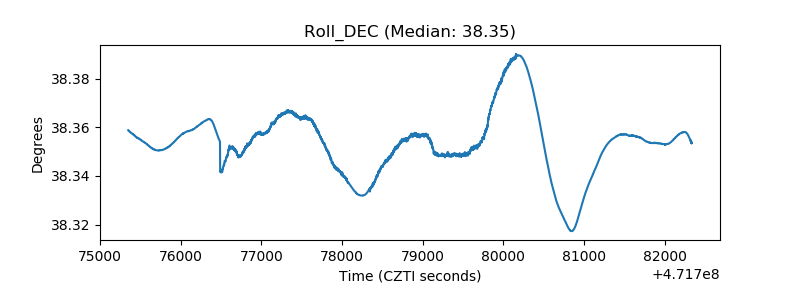 |
| _Roll_RA | 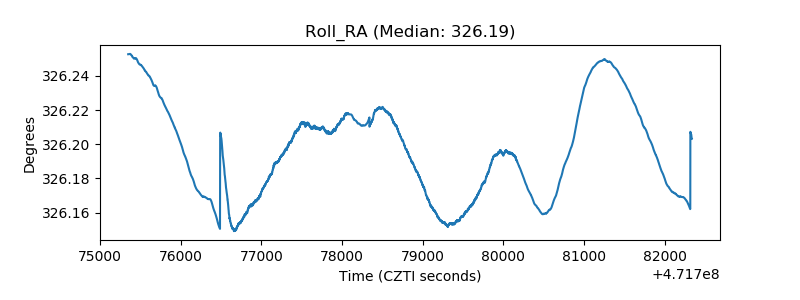 |
| Veto Counter | 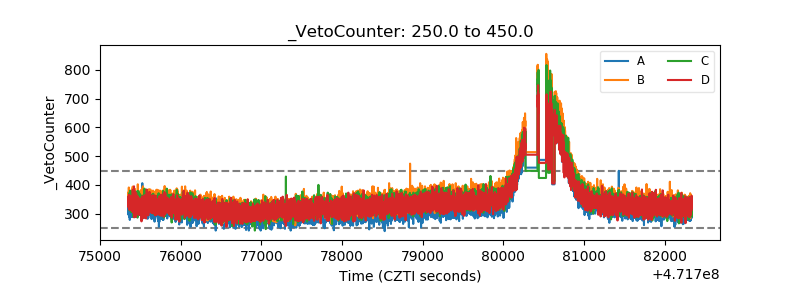 |