| Param | Original file | Final file |
|---|---|---|
| Filename | modeM0/AS1A13_037T01_9000006440_49815cztM0_level2.fits | modeM0/AS1A13_037T01_9000006440_49815cztM0_level2_quad_clean.evt |
| Size (bytes) | 1,439,507,520 | 56,793,600 |
| Size | 1.3 GB | 54.2 MB |
| Events in quadrant A | 13,664,219 | 327,550 |
| Events in quadrant B | 4,864,752 | 756,861 |
| Events in quadrant C | 16,581,455 | 17,332 |
| Events in quadrant D | 17,589,217 | 88,320 |
| Mode SS | |||
|---|---|---|---|
| Quadrant | BADHDUFLAG | Total packets | Discarded packets |
| A | 0 | 152 | 0 |
| B | 0 | 152 | 0 |
| C | 0 | 152 | 0 |
| D | 0 | 152 | 0 |
| Mode M0 | |||
|---|---|---|---|
| Quadrant | BADHDUFLAG | Total packets | Discarded packets |
| A | 0 | 45738 | 0 |
| B | 0 | 19698 | 0 |
| C | 0 | 54431 | 5 |
| D | 0 | 57382 | 0 |
| Quadrant | Total seconds | Saturated seconds | Saturation percentage |
|---|---|---|---|
| A | 7605 | 4274 | 56.199869% |
| B | 7606 | 288 | 3.786484% |
| C | 7605 | 7446 | 97.909270% |
| D | 7605 | 6790 | 89.283366% |
Noise dominated data is calculated using 1-second bins in cleaned event files. If a bin has >2000 counts, and if more than 50% of those come from <1% of pixels, then it is considered to be noise-dominated and hence unusable.
| Quadrant | # 1 sec bins | Bins with >0 counts | Bins with >2000 counts | High rate bins dominated by noise | Noise dominated (total time) | Noise dominated (detector-on time) | Marked lightcurve |
|---|---|---|---|---|---|---|---|
| A | 7604 | 7604 | 4114 | 4114 | 54.10% | 54.10% | 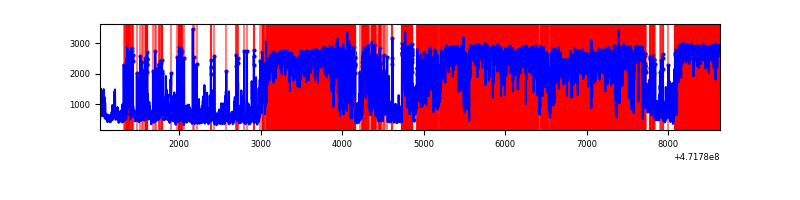 |
| B | 7606 | 7606 | 184 | 184 | 2.42% | 2.42% | 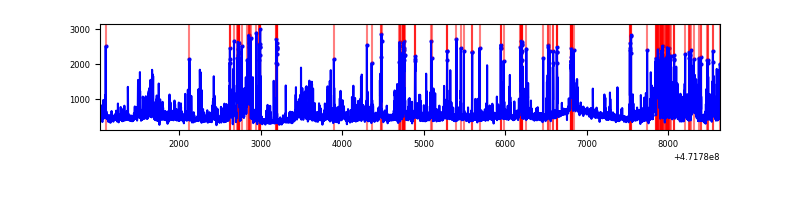 |
| C | 7604 | 7604 | 5487 | 5487 | 72.16% | 72.16% | 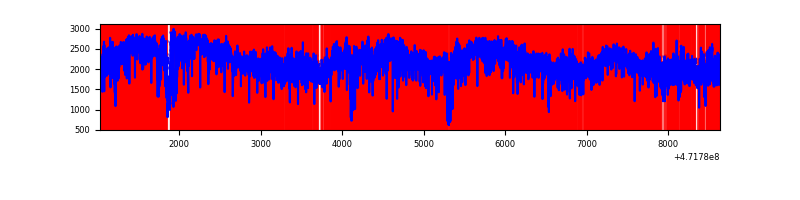 |
| D | 7604 | 7604 | 6309 | 6309 | 82.97% | 82.97% | 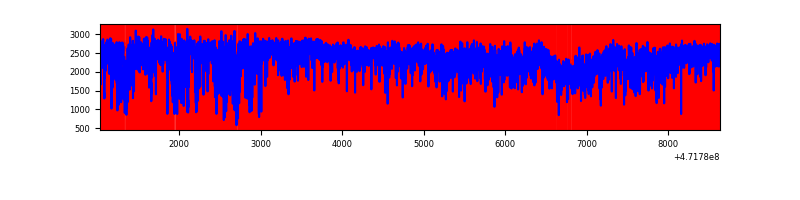 |
Top three noisy pixels from each quadrant. If the there are fewer than three noisy pixels in the level2.evt file, extra rows are filled as -1
| Pixel properties | Quadrant properties | ||||||
|---|---|---|---|---|---|---|---|
| Quadrant | DetID | PixID | Counts | Sigma | Mean | Median | Sigma |
| A | 0 | 98 | 5795842 | 39325.01 | 565 | 548 | 147.4 |
| A | 4 | 92 | 1392037 | 9442.2 | 565 | 548 | 147.4 |
| A | 3 | 99 | 728051 | 4936.6 | 565 | 548 | 147.4 |
| B | 4 | 171 | 467011 | 2724.15 | 806 | 780 | 171.1 |
| B | 10 | 28 | 317468 | 1850.38 | 806 | 780 | 171.1 |
| B | 4 | 206 | 192362 | 1119.4 | 806 | 780 | 171.1 |
| C | 15 | 197 | 3948895 | 60758.13 | 194 | 191 | 65.0 |
| C | 15 | 147 | 3505446 | 53934.84 | 194 | 191 | 65.0 |
| C | 1 | 44 | 2724241 | 41914.56 | 194 | 191 | 65.0 |
| D | 7 | 61 | 2931780 | 20948.98 | 450 | 432 | 139.9 |
| D | 15 | 185 | 2424507 | 17323.74 | 450 | 432 | 139.9 |
| D | 7 | 126 | 2204622 | 15752.32 | 450 | 432 | 139.9 |
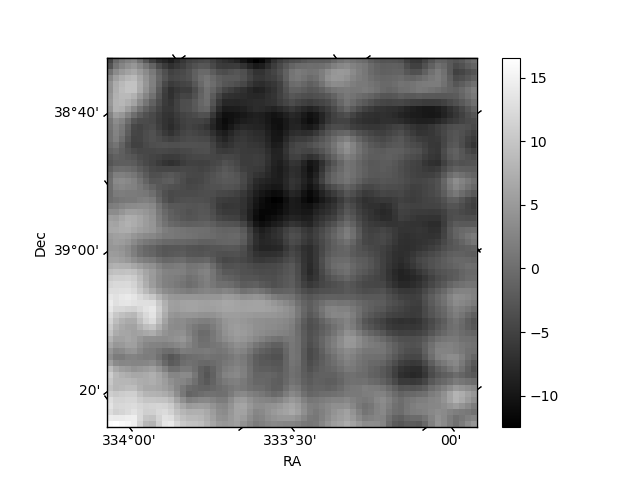
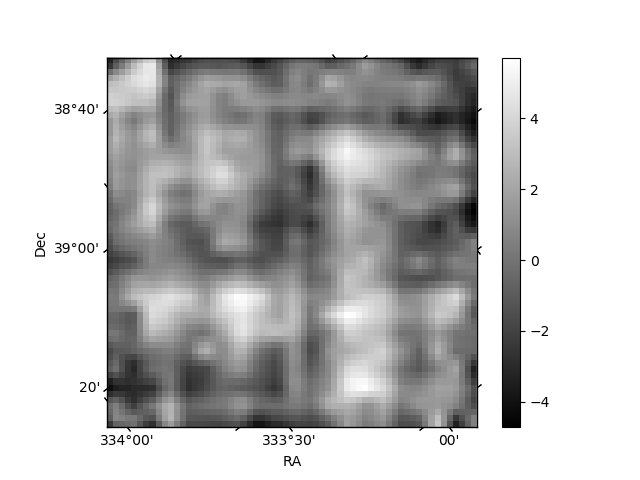
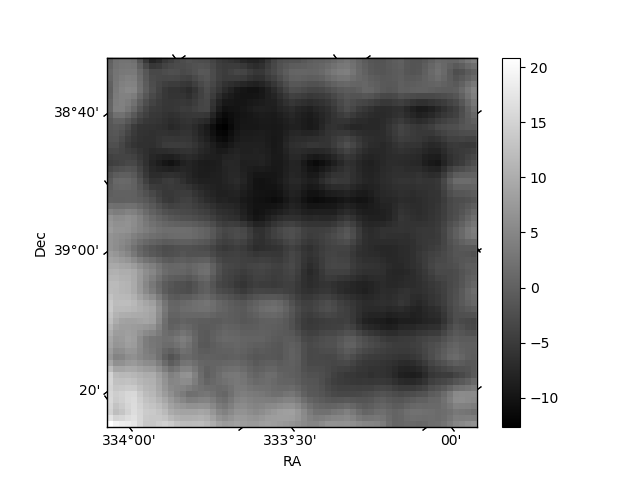
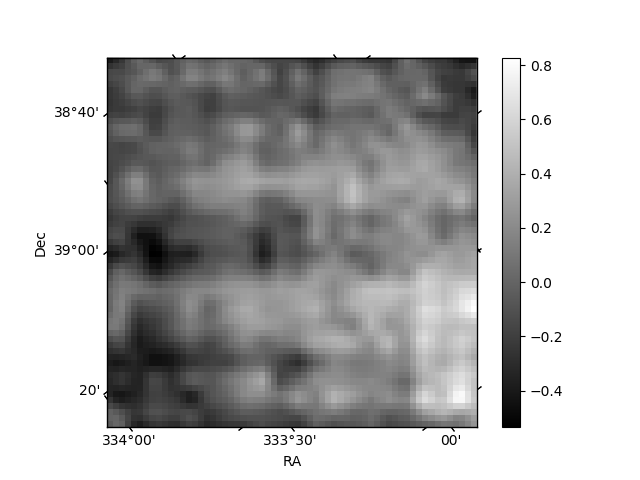
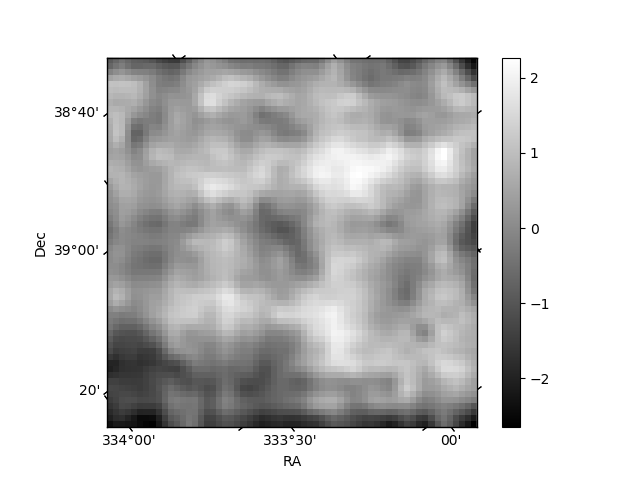
Histogram calculated using DETX and DETY for each event in the final _common_clean file
| Quadrant A | 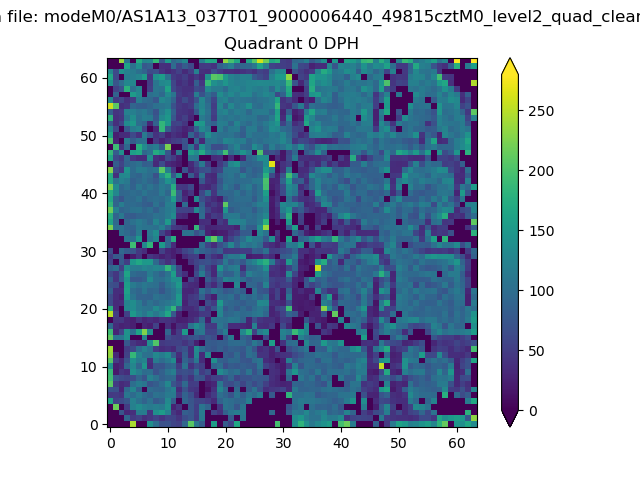 |
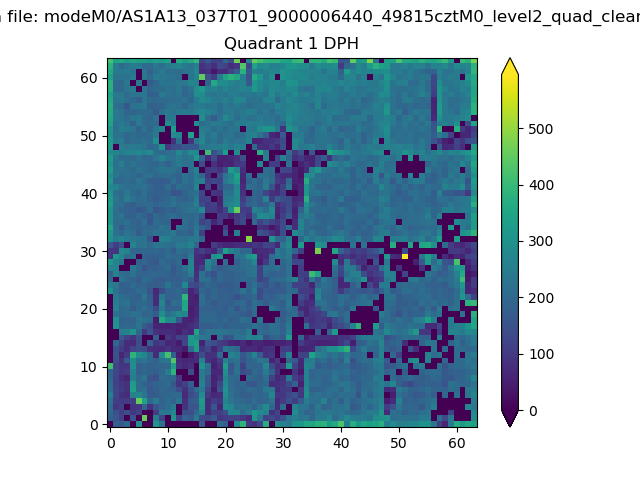 |
Quadrant B |
|---|---|---|---|
| Quadrant D | 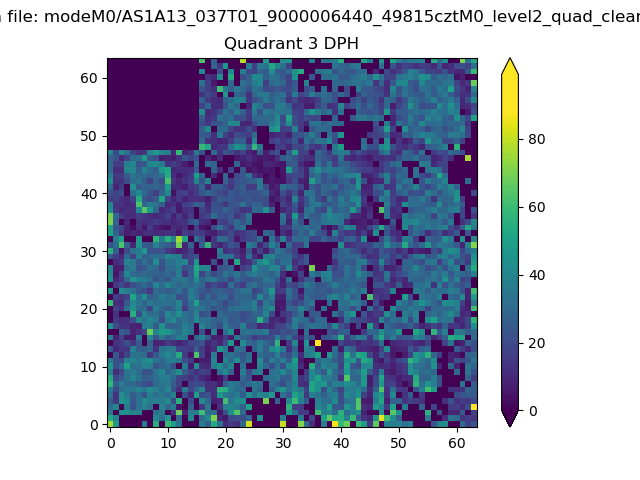 |
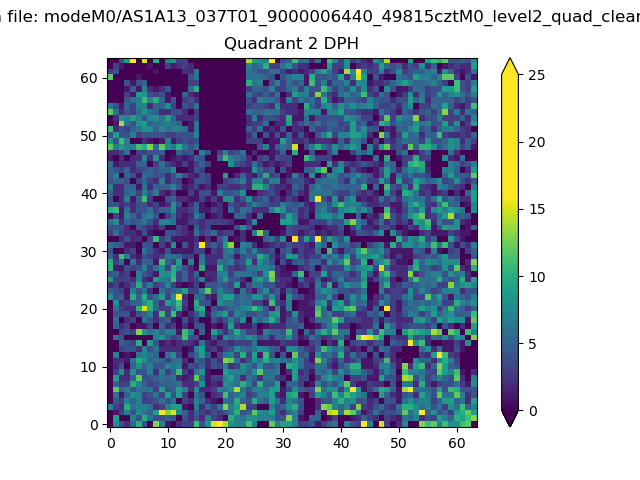 |
Quadrant C |
| Plot type | Count rate plots | Images |
|---|---|---|
| Comparison with Poisson distribution Blue bars denote a histogram of data divided into 1 sec bins. Red curve is a Poisson curve with rate = median count rate of data. |
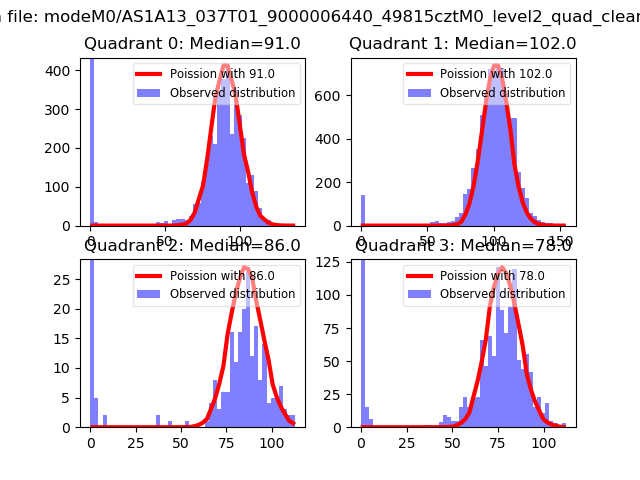 |
 |
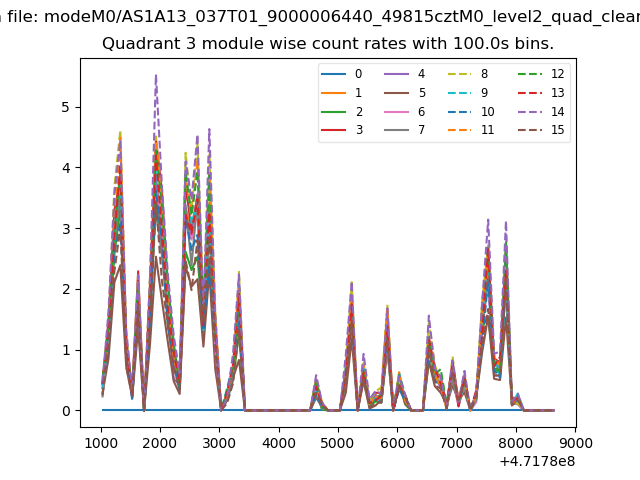
| Quadrant-wise count rates Data is divided into 100 sec bins |
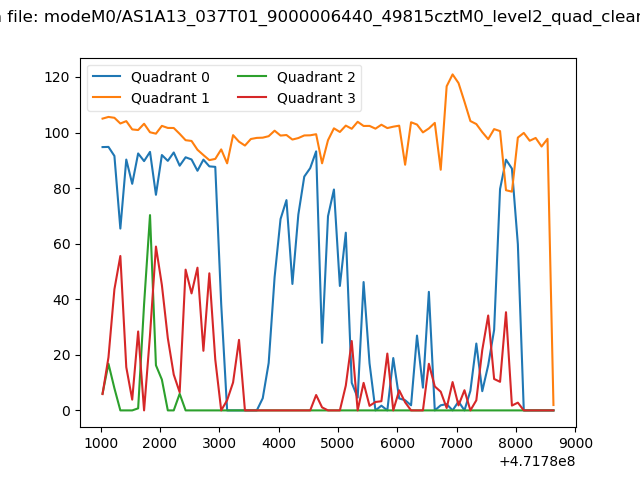 |
|
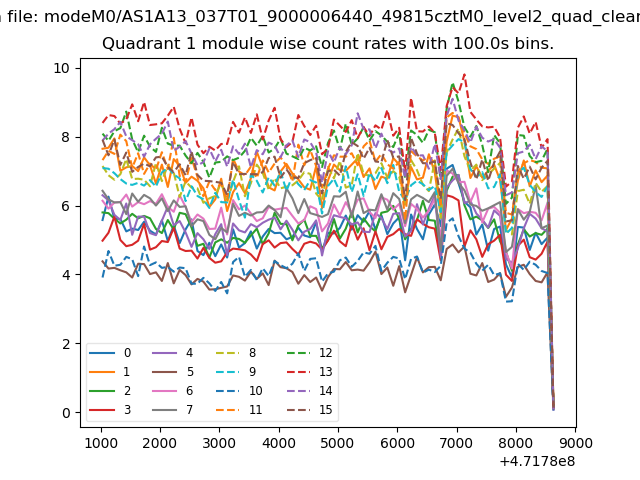
| Module-wise count rates for Quadrant A Data is divided into 100 sec bins |
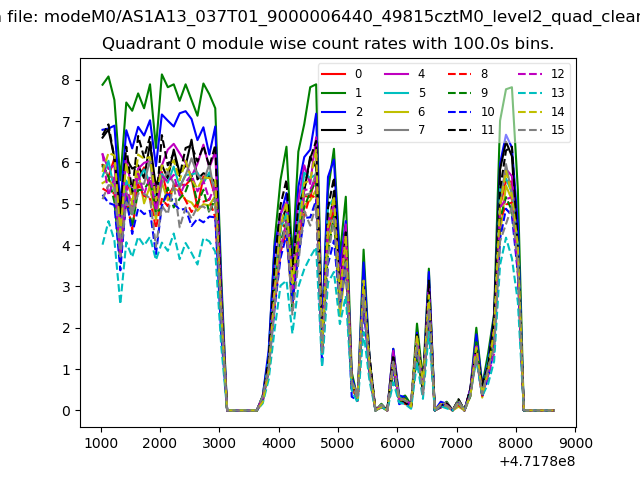 |
 |
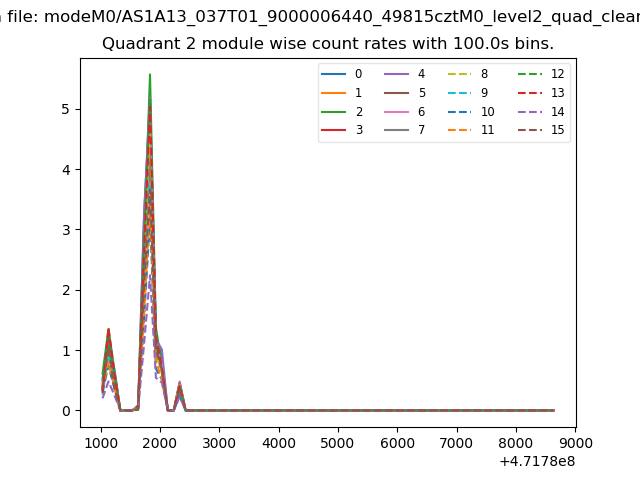
| Module-wise count rates for Quadrant B Data is divided into 100 sec bins |
 |
 |
| Module-wise count rates for Quadrant C Data is divided into 100 sec bins |
 |
 |
| Module-wise count rates for Quadrant D Data is divided into 100 sec bins |
 |
 |
| Parameter | Plot |
|---|---|
| CZT HV Monitor | 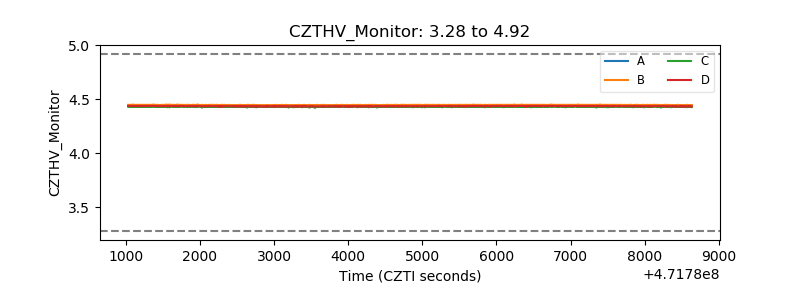 |
| D_VDD | 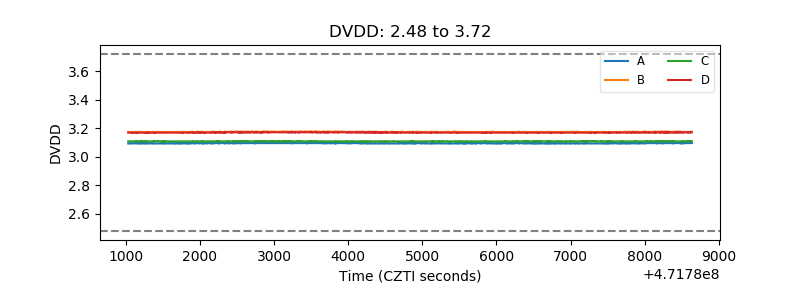 |
| Temperature 1 | 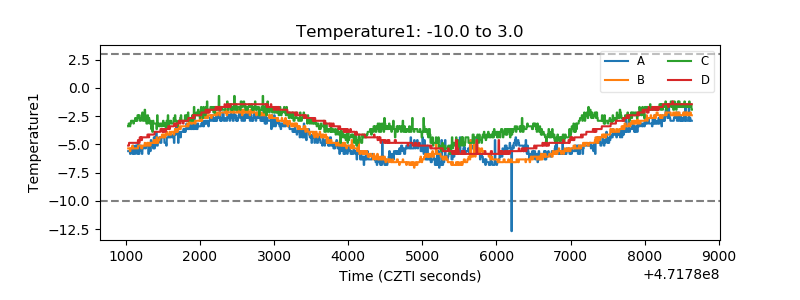 |
| Veto HV Monitor |  |
| Veto LLD | 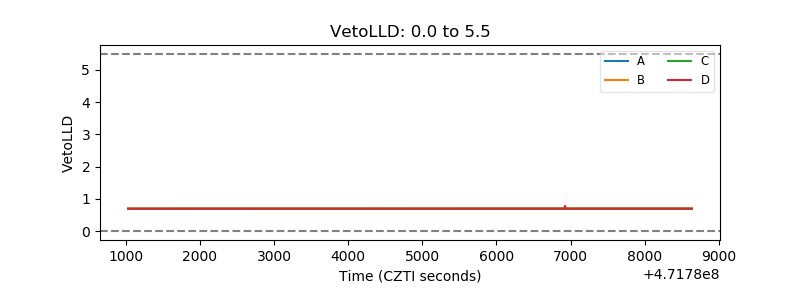 |
| Alpha Counter | 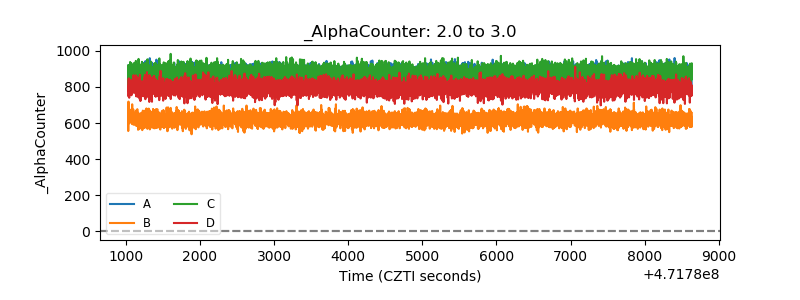 |
| _CPM_Rate | 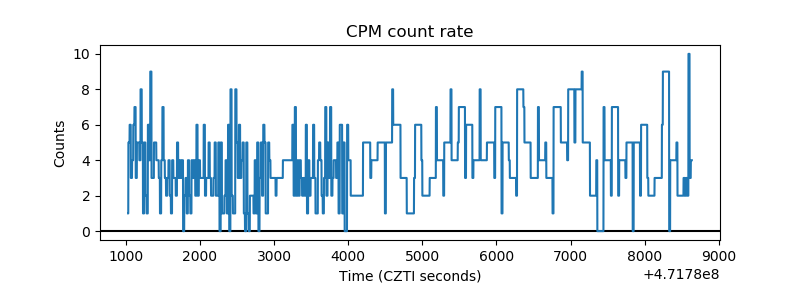 |
| CZT Counter | 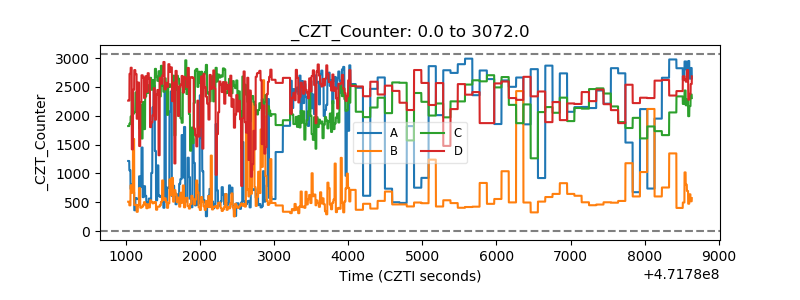 |
| +2.5 Volts monitor | 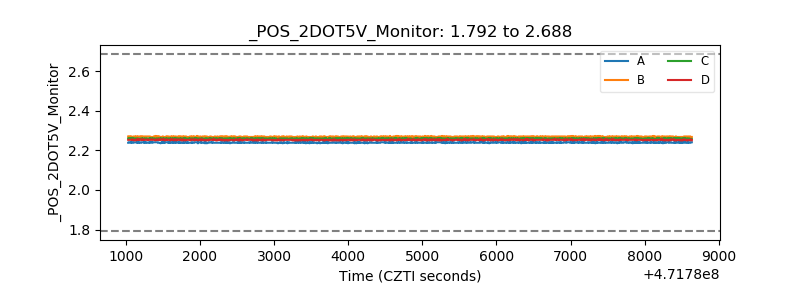 |
| +5 Volts monitor | 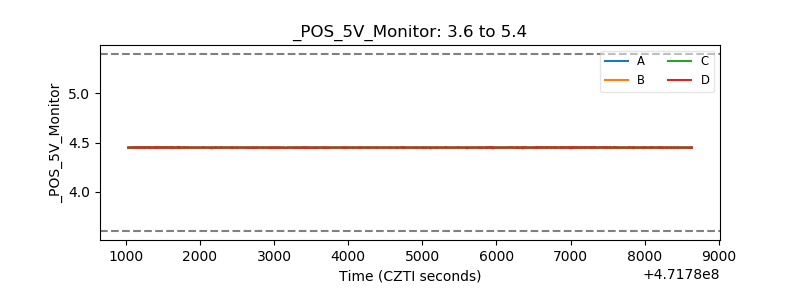 |
| _ROLL_ROT | 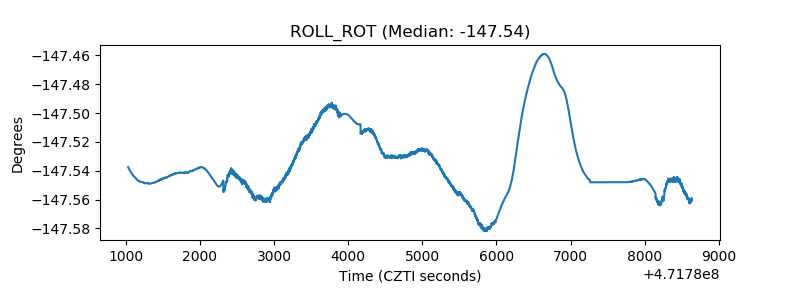 |
| _Roll_DEC | 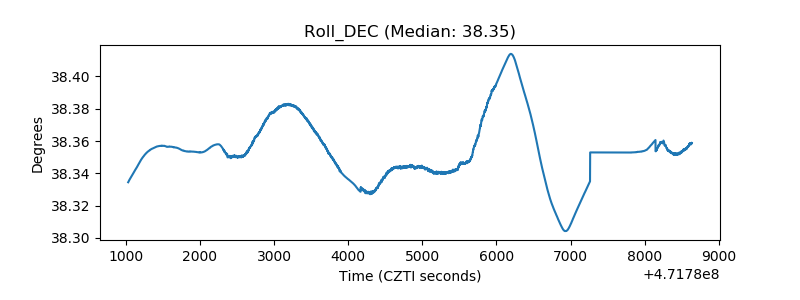 |
| _Roll_RA | 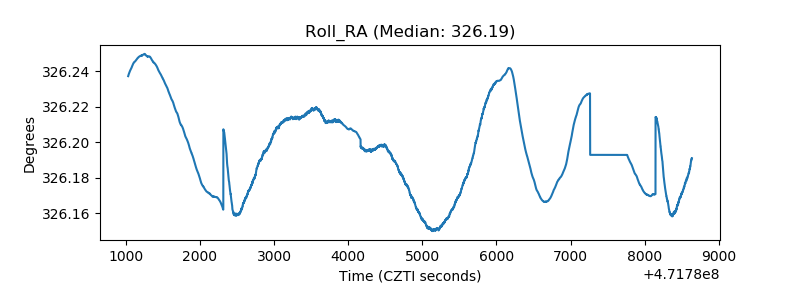 |
| Veto Counter | 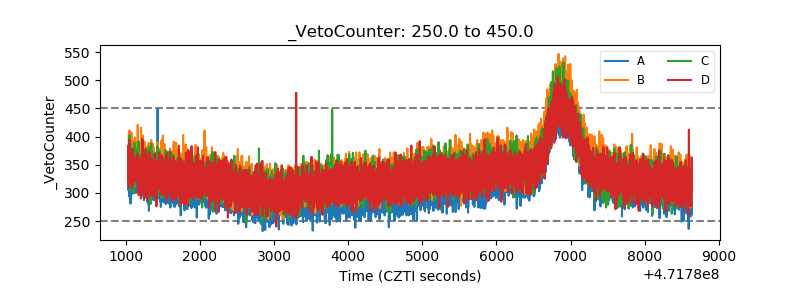 |