| Param | Original file | Final file |
|---|---|---|
| Filename | modeM0/AS1A13_037T01_9000006440_49819cztM0_level2.fits | modeM0/AS1A13_037T01_9000006440_49819cztM0_level2_quad_clean.evt |
| Size (bytes) | 2,911,625,280 | 114,560,640 |
| Size | 2.7 GB | 109.3 MB |
| Events in quadrant A | 32,688,864 | 606,002 |
| Events in quadrant B | 10,019,760 | 1,603,709 |
| Events in quadrant C | 25,701,500 | 101,874 |
| Events in quadrant D | 38,076,526 | 1,907 |
| Mode M9 | |||
|---|---|---|---|
| Quadrant | BADHDUFLAG | Total packets | Discarded packets |
| A | 0 | 3 | 0 |
| B | 0 | 3 | 0 |
| C | 0 | 3 | 0 |
| D | 0 | 3 | 0 |
| Mode SS | |||
|---|---|---|---|
| Quadrant | BADHDUFLAG | Total packets | Discarded packets |
| A | 0 | 336 | 0 |
| B | 0 | 336 | 0 |
| C | 0 | 336 | 0 |
| D | 0 | 336 | 0 |
| Mode M0 | |||
|---|---|---|---|
| Quadrant | BADHDUFLAG | Total packets | Discarded packets |
| A | 0 | 108556 | 1 |
| B | 0 | 41319 | 1 |
| C | 0 | 88133 | 1 |
| D | 0 | 124401 | 1 |
| Quadrant | Total seconds | Saturated seconds | Saturation percentage |
|---|---|---|---|
| A | 16739 | 10504 | 62.751658% |
| B | 16739 | 714 | 4.265488% |
| C | 16740 | 15762 | 94.157706% |
| D | 16740 | 16727 | 99.922342% |
Noise dominated data is calculated using 1-second bins in cleaned event files. If a bin has >2000 counts, and if more than 50% of those come from <1% of pixels, then it is considered to be noise-dominated and hence unusable.
| Quadrant | # 1 sec bins | Bins with >0 counts | Bins with >2000 counts | High rate bins dominated by noise | Noise dominated (total time) | Noise dominated (detector-on time) | Marked lightcurve |
|---|---|---|---|---|---|---|---|
| A | 17043 | 16738 | 10201 | 10201 | 59.85% | 60.95% | 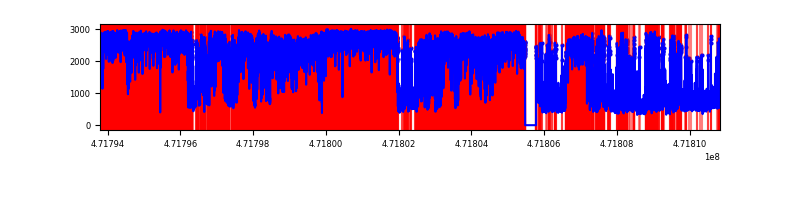 |
| B | 17043 | 16738 | 521 | 521 | 3.06% | 3.11% | 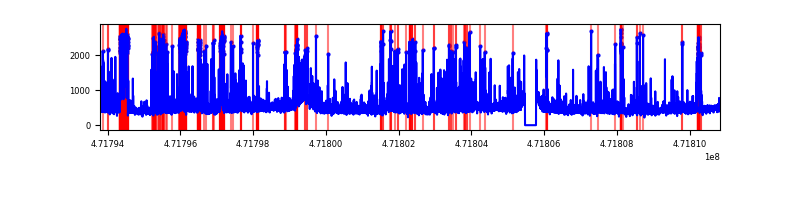 |
| C | 17044 | 16739 | 4048 | 4048 | 23.75% | 24.18% | 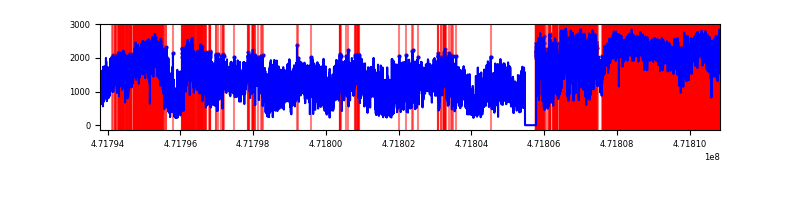 |
| D | 17044 | 16739 | 14367 | 14367 | 84.29% | 85.83% | 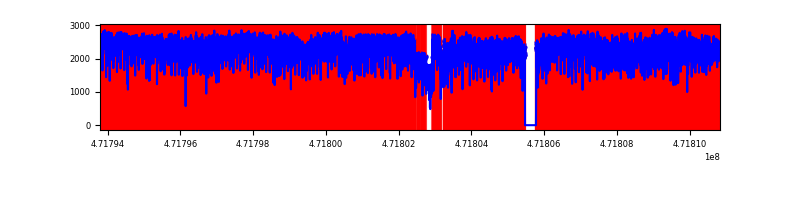 |
Top three noisy pixels from each quadrant. If the there are fewer than three noisy pixels in the level2.evt file, extra rows are filled as -1
| Pixel properties | Quadrant properties | ||||||
|---|---|---|---|---|---|---|---|
| Quadrant | DetID | PixID | Counts | Sigma | Mean | Median | Sigma |
| A | 0 | 98 | 16891397 | 51928.6 | 1173 | 1135 | 325.3 |
| A | 12 | 50 | 1695091 | 5208.02 | 1173 | 1135 | 325.3 |
| A | 3 | 99 | 1507431 | 4631.06 | 1173 | 1135 | 325.3 |
| B | 10 | 44 | 1418172 | 3847.76 | 1746 | 1687 | 368.1 |
| B | 1 | 255 | 293252 | 792.01 | 1746 | 1687 | 368.1 |
| B | 4 | 206 | 286736 | 774.31 | 1746 | 1687 | 368.1 |
| C | 15 | 147 | 9604568 | 70919.88 | 323 | 313 | 135.4 |
| C | 15 | 197 | 4565758 | 33712.23 | 323 | 313 | 135.4 |
| C | 15 | 174 | 1209527 | 8929.1 | 323 | 313 | 135.4 |
| D | 7 | 61 | 8447797 | 43222.26 | 514 | 486 | 195.4 |
| D | 7 | 126 | 3260071 | 16678.28 | 514 | 486 | 195.4 |
| D | 15 | 168 | 2680317 | 13711.86 | 514 | 486 | 195.4 |
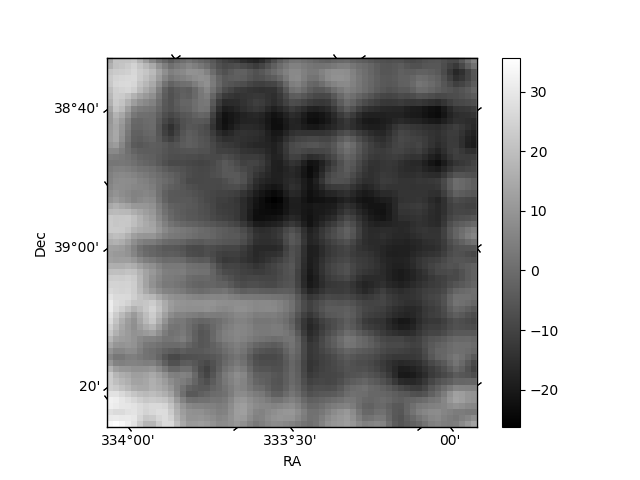
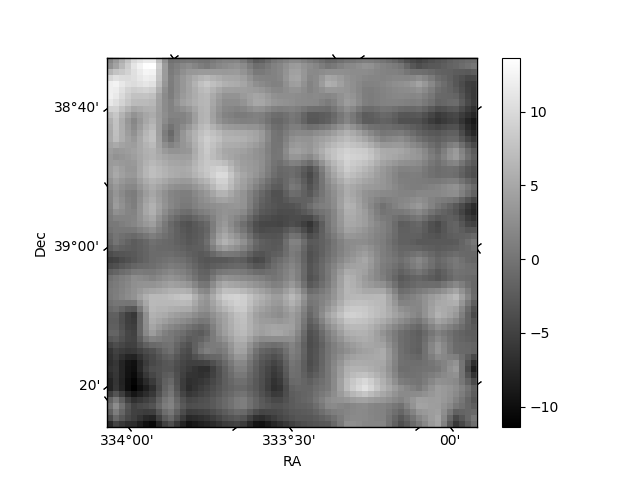
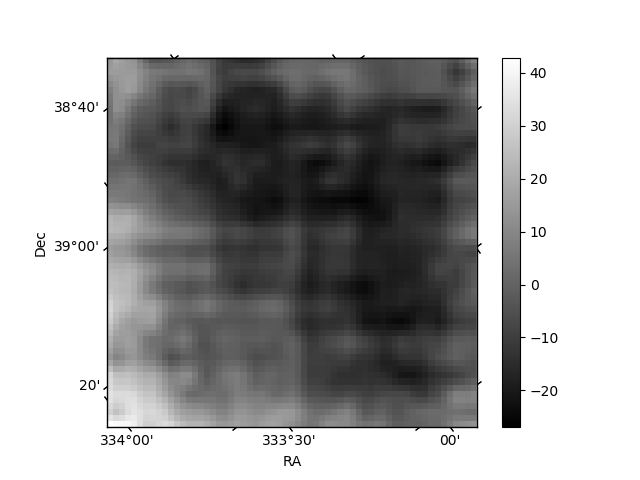
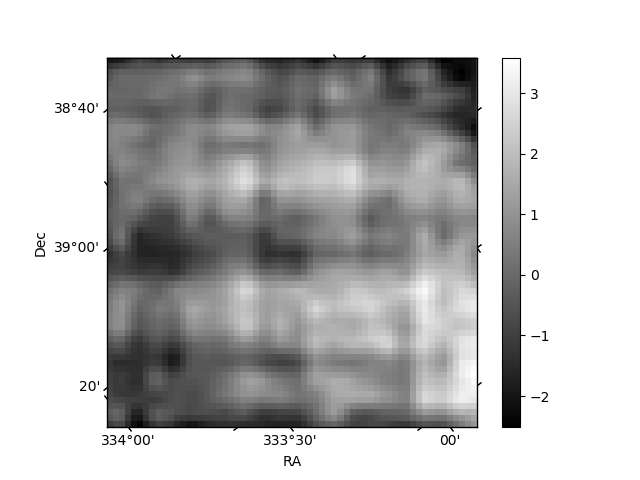
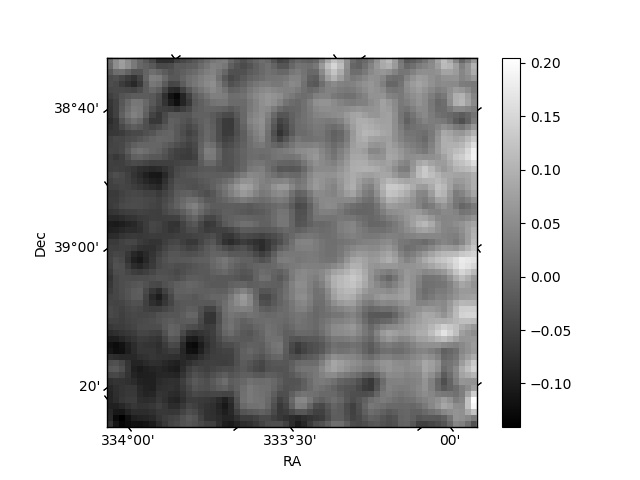
Histogram calculated using DETX and DETY for each event in the final _common_clean file
| Quadrant A | 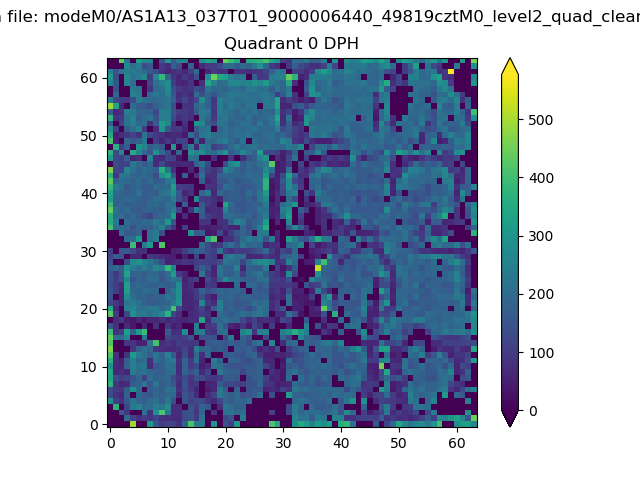 |
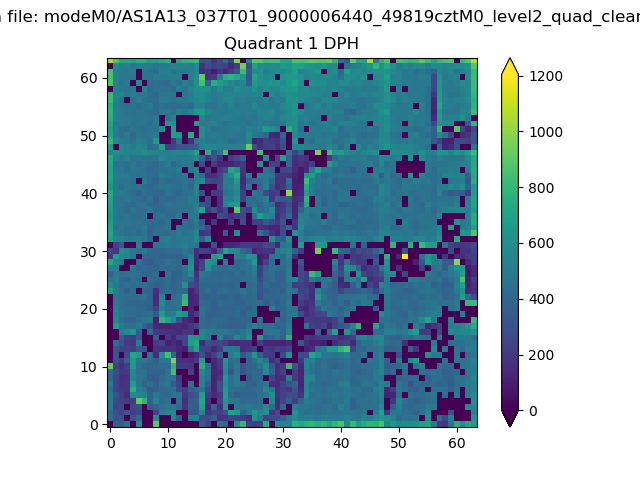 |
Quadrant B |
|---|---|---|---|
| Quadrant D | 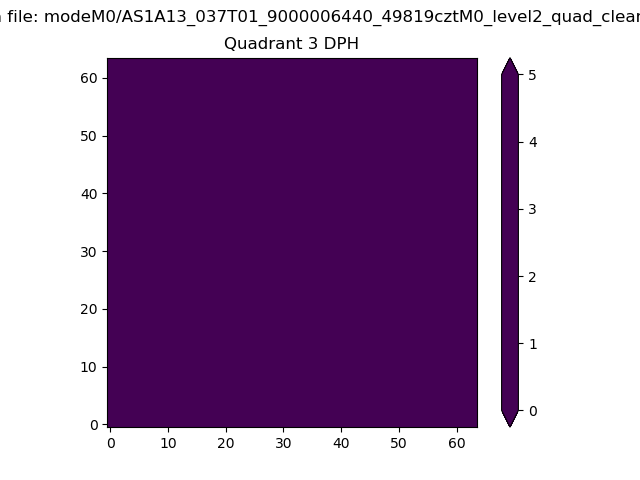 |
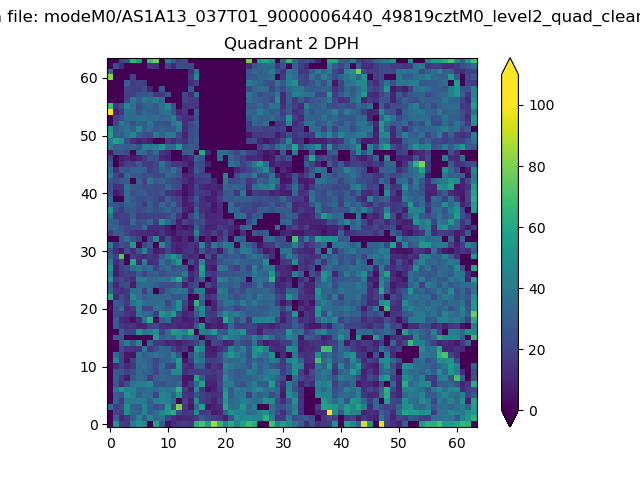 |
Quadrant C |
| Plot type | Count rate plots | Images |
|---|---|---|
| Comparison with Poisson distribution Blue bars denote a histogram of data divided into 1 sec bins. Red curve is a Poisson curve with rate = median count rate of data. |
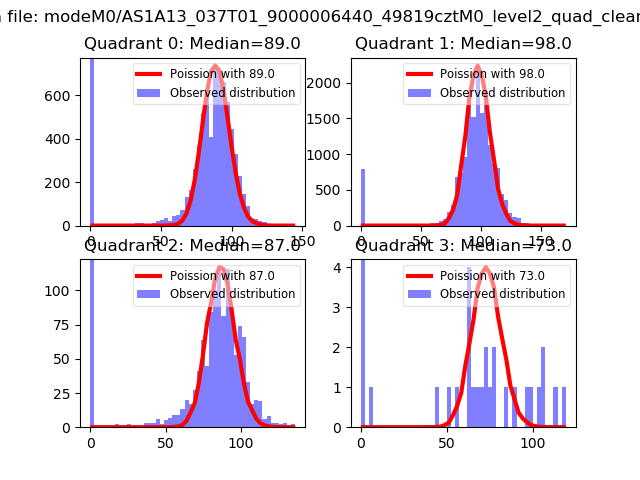 |
 |
| Quadrant-wise count rates Data is divided into 100 sec bins |
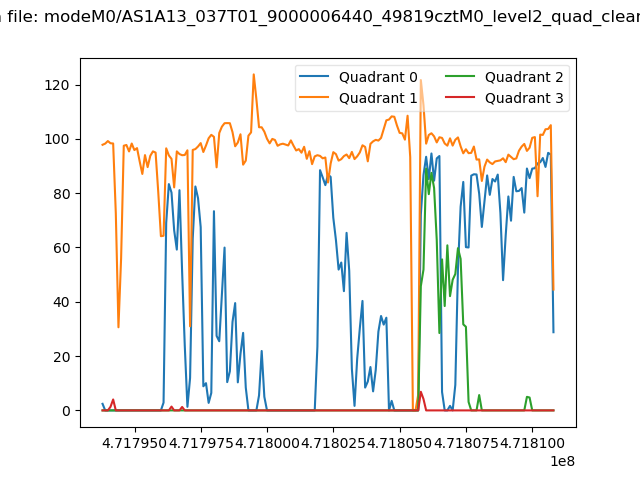 |
|
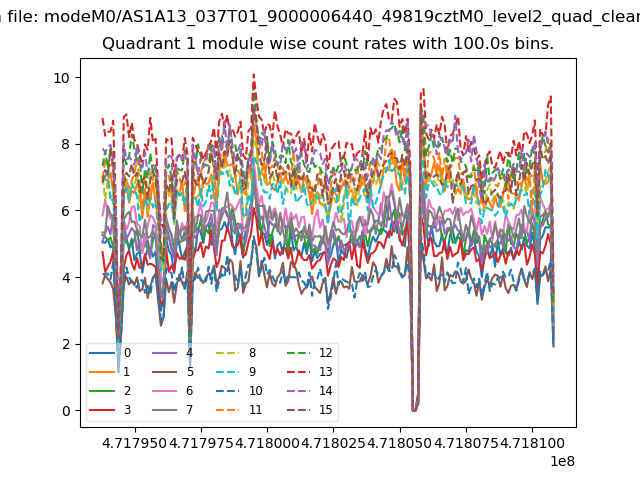
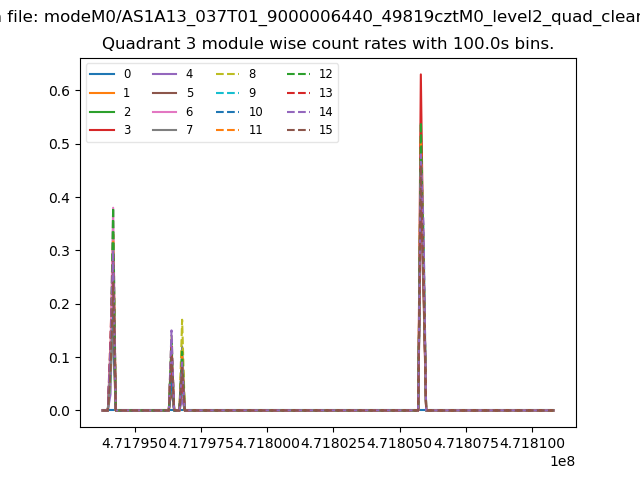
| Module-wise count rates for Quadrant A Data is divided into 100 sec bins |
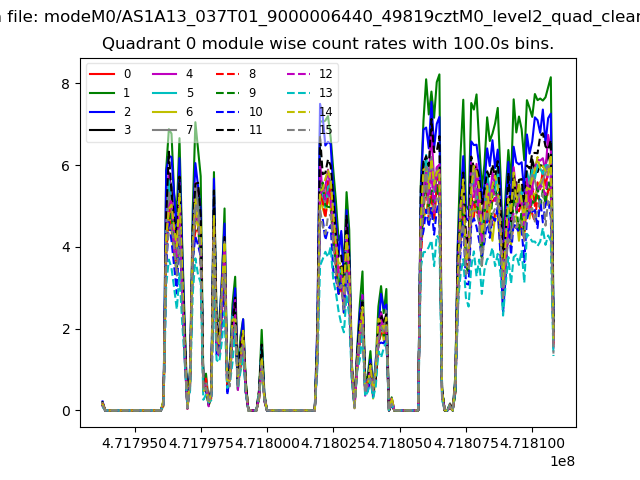 |
 |
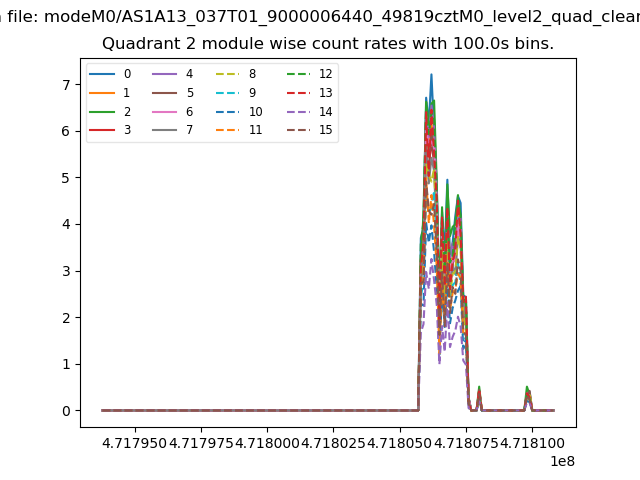
| Module-wise count rates for Quadrant B Data is divided into 100 sec bins |
 |
 |
| Module-wise count rates for Quadrant C Data is divided into 100 sec bins |
 |
 |
| Module-wise count rates for Quadrant D Data is divided into 100 sec bins |
 |
 |
| Parameter | Plot |
|---|---|
| CZT HV Monitor | 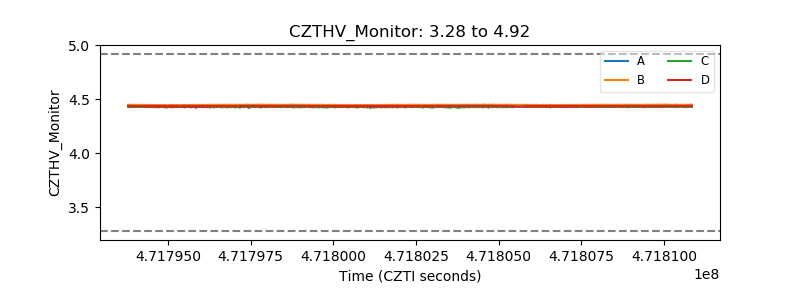 |
| D_VDD | 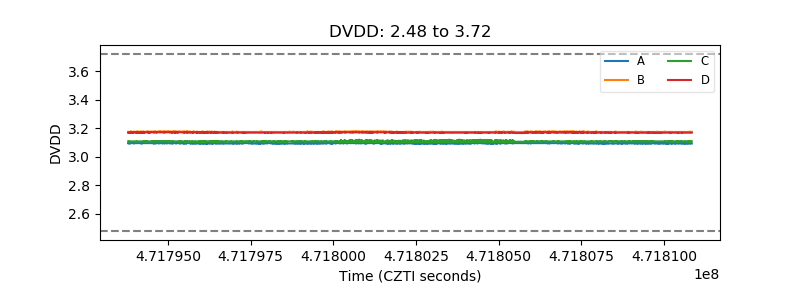 |
| Temperature 1 | 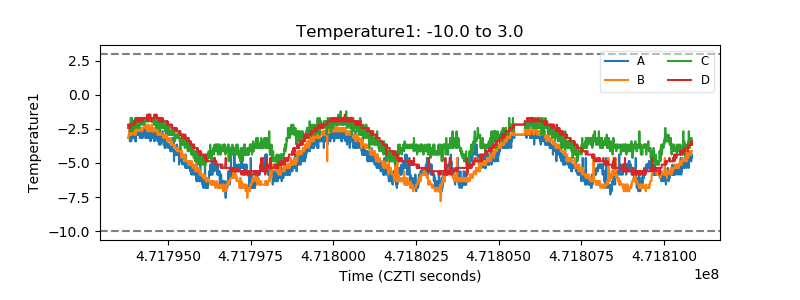 |
| Veto HV Monitor | 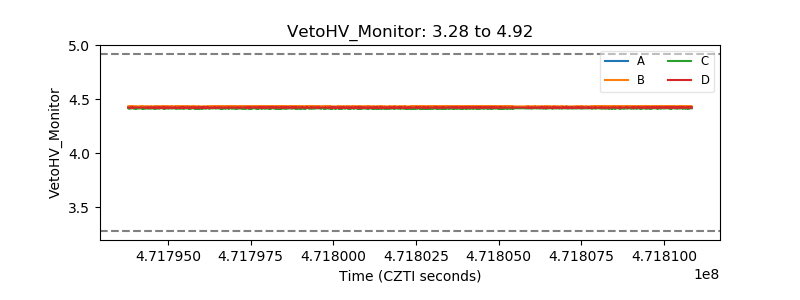 |
| Veto LLD | 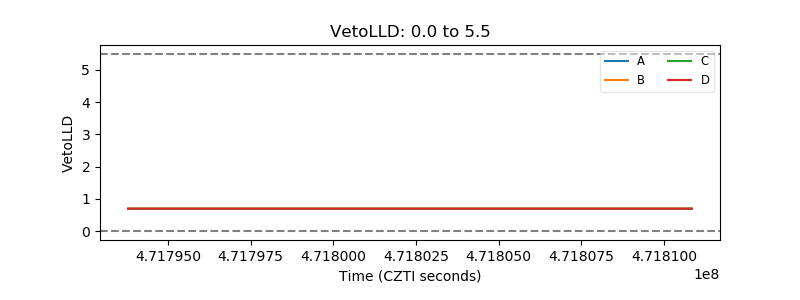 |
| Alpha Counter | 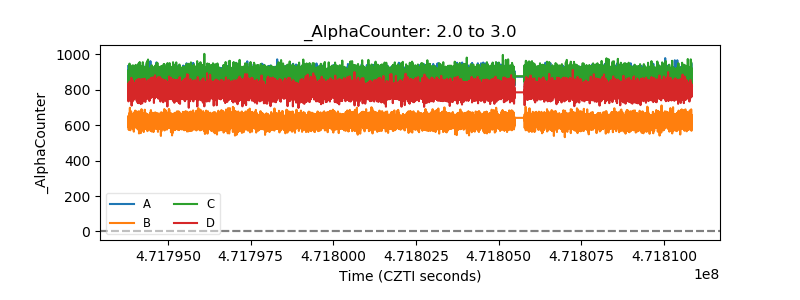 |
| _CPM_Rate |  |
| CZT Counter | 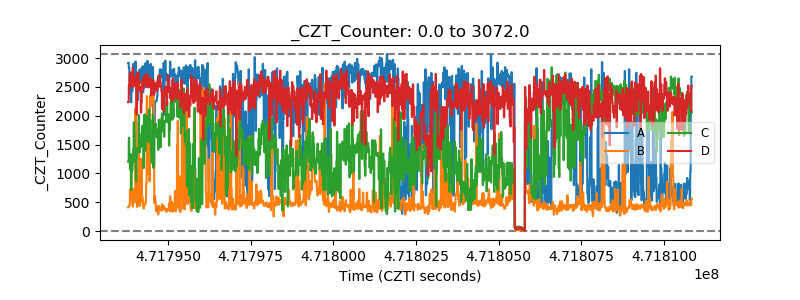 |
| +2.5 Volts monitor | 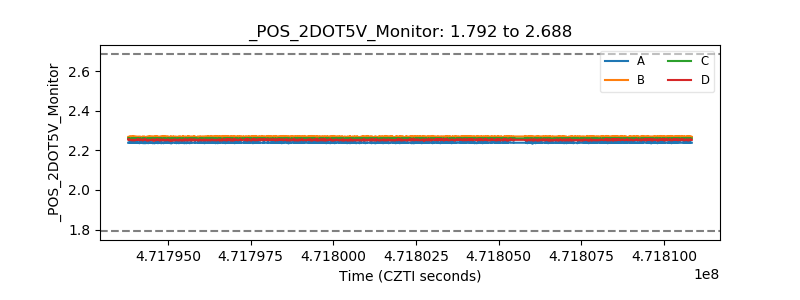 |
| +5 Volts monitor | 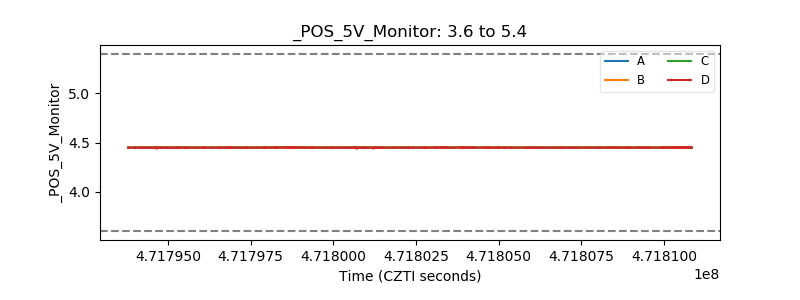 |
| _ROLL_ROT | 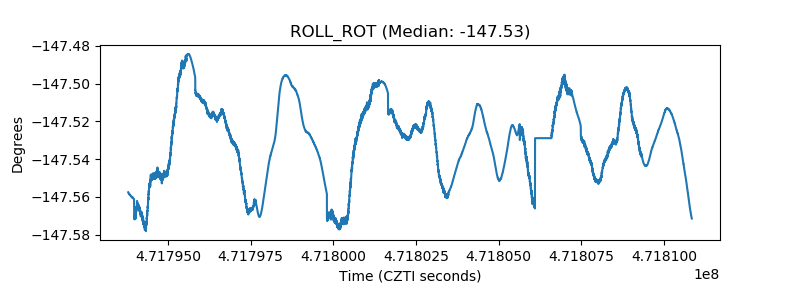 |
| _Roll_DEC | 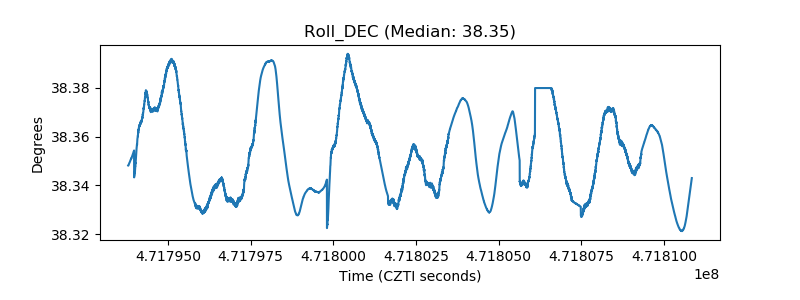 |
| _Roll_RA | 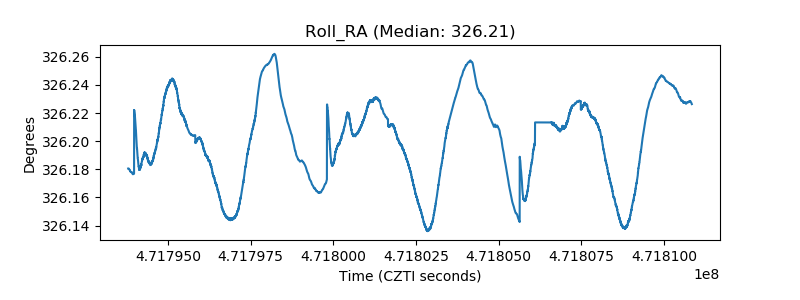 |
| Veto Counter | 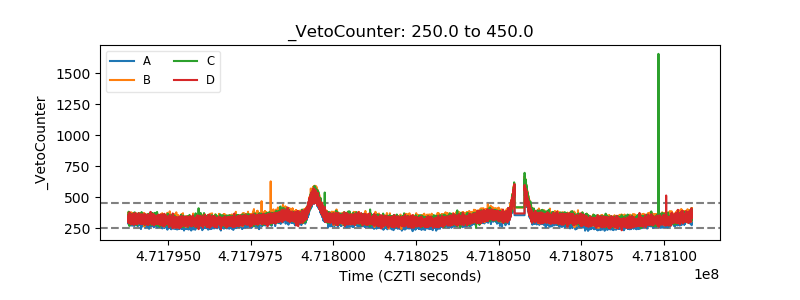 |