| Param | Original file | Final file |
|---|---|---|
| Filename | modeM0/AS1A13_037T01_9000006440_49820cztM0_level2.fits | modeM0/AS1A13_037T01_9000006440_49820cztM0_level2_quad_clean.evt |
| Size (bytes) | 1,238,889,600 | 71,274,240 |
| Size | 1.2 GB | 68.0 MB |
| Events in quadrant A | 6,535,267 | 689,106 |
| Events in quadrant B | 5,909,763 | 744,222 |
| Events in quadrant C | 16,074,688 | 157,343 |
| Events in quadrant D | 16,729,708 | 18,881 |
| Mode M9 | |||
|---|---|---|---|
| Quadrant | BADHDUFLAG | Total packets | Discarded packets |
| A | 0 | 14 | 0 |
| B | 0 | 14 | 0 |
| C | 0 | 14 | 0 |
| D | 0 | 14 | 0 |
| Mode SS | |||
|---|---|---|---|
| Quadrant | BADHDUFLAG | Total packets | Discarded packets |
| A | 0 | 162 | 0 |
| B | 0 | 162 | 0 |
| C | 0 | 162 | 0 |
| D | 0 | 162 | 0 |
| Mode M0 | |||
|---|---|---|---|
| Quadrant | BADHDUFLAG | Total packets | Discarded packets |
| A | 0 | 24682 | 2 |
| B | 0 | 22902 | 2 |
| C | 0 | 53093 | 2 |
| D | 0 | 55105 | 3 |
| Quadrant | Total seconds | Saturated seconds | Saturation percentage |
|---|---|---|---|
| A | 7881 | 594 | 7.537115% |
| B | 7882 | 694 | 8.804872% |
| C | 7882 | 6420 | 81.451408% |
| D | 7881 | 7713 | 97.868291% |
Noise dominated data is calculated using 1-second bins in cleaned event files. If a bin has >2000 counts, and if more than 50% of those come from <1% of pixels, then it is considered to be noise-dominated and hence unusable.
| Quadrant | # 1 sec bins | Bins with >0 counts | Bins with >2000 counts | High rate bins dominated by noise | Noise dominated (total time) | Noise dominated (detector-on time) | Marked lightcurve |
|---|---|---|---|---|---|---|---|
| A | 9306 | 7883 | 531 | 531 | 5.71% | 6.74% | 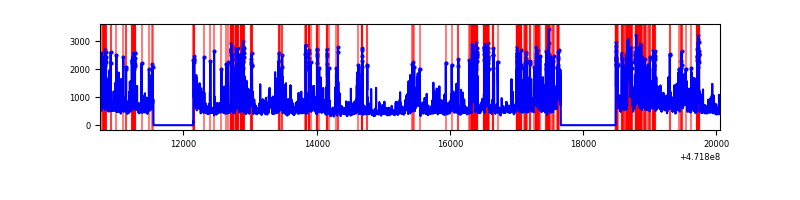 |
| B | 9307 | 7884 | 568 | 568 | 6.10% | 7.20% | 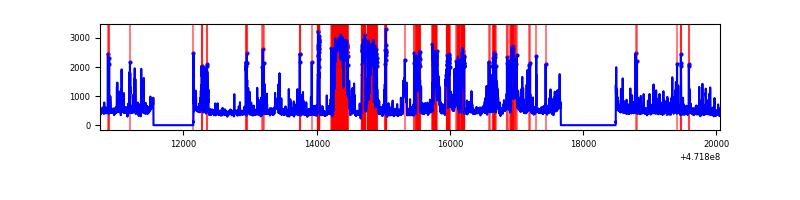 |
| C | 9307 | 7884 | 5033 | 5033 | 54.08% | 63.84% | 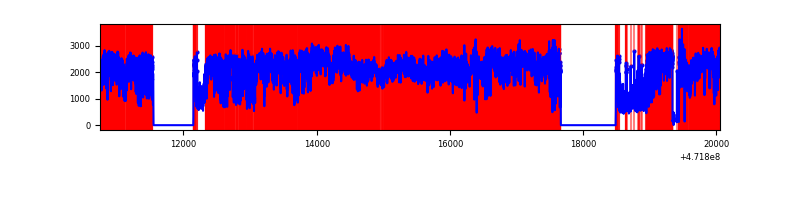 |
| D | 9306 | 7883 | 5356 | 5356 | 57.55% | 67.94% | 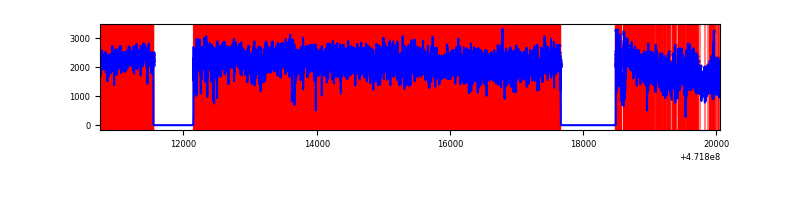 |
Top three noisy pixels from each quadrant. If the there are fewer than three noisy pixels in the level2.evt file, extra rows are filled as -1
| Pixel properties | Quadrant properties | ||||||
|---|---|---|---|---|---|---|---|
| Quadrant | DetID | PixID | Counts | Sigma | Mean | Median | Sigma |
| A | 0 | 175 | 873199 | 4274.88 | 822 | 800 | 204.1 |
| A | 8 | 38 | 307176 | 1501.29 | 822 | 800 | 204.1 |
| A | 15 | 191 | 263790 | 1288.69 | 822 | 800 | 204.1 |
| B | 5 | 49 | 1572693 | 9129.1 | 814 | 789 | 172.2 |
| B | 10 | 28 | 337438 | 1955.15 | 814 | 789 | 172.2 |
| B | 4 | 206 | 308477 | 1786.95 | 814 | 789 | 172.2 |
| C | 1 | 44 | 3264972 | 20369.99 | 417 | 406 | 160.3 |
| C | 15 | 197 | 2853041 | 17799.65 | 417 | 406 | 160.3 |
| C | 15 | 147 | 2207901 | 13774.16 | 417 | 406 | 160.3 |
| D | 7 | 61 | 5456614 | 49926.97 | 303 | 288 | 109.3 |
| D | 14 | 66 | 1562980 | 14299.09 | 303 | 288 | 109.3 |
| D | 15 | 184 | 1076355 | 9846.33 | 303 | 288 | 109.3 |
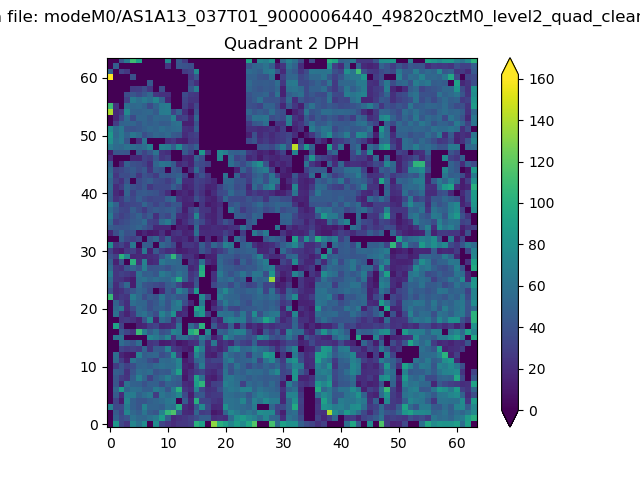
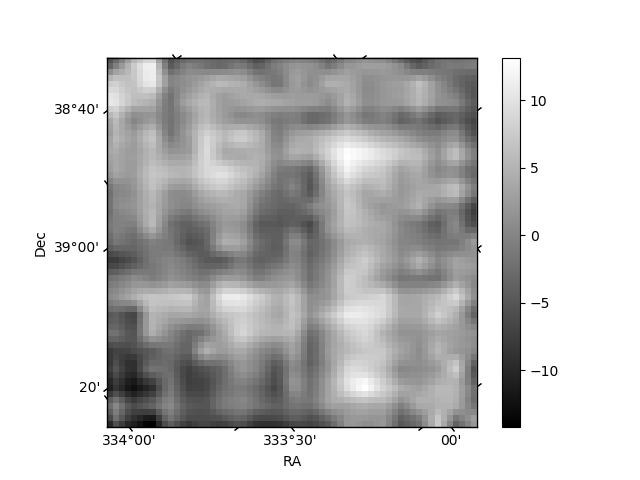
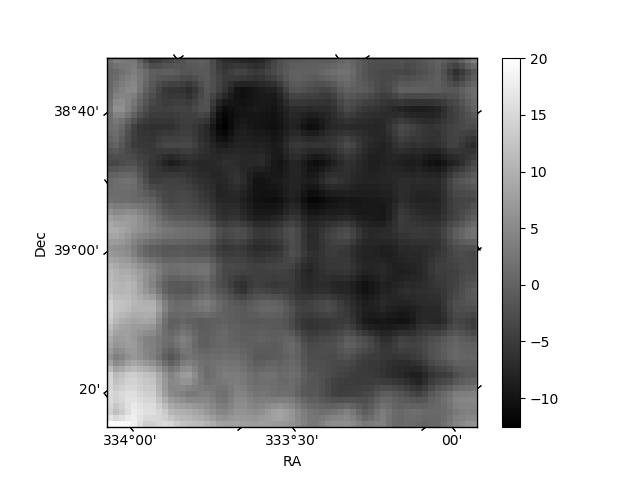
Histogram calculated using DETX and DETY for each event in the final _common_clean file
| Quadrant A | 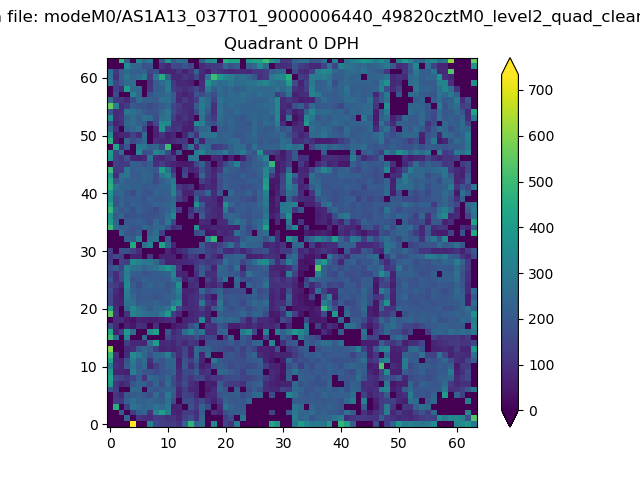 |
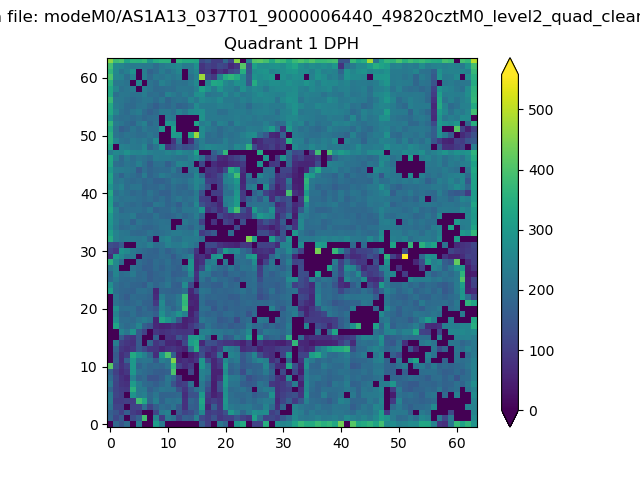 |
Quadrant B |
|---|---|---|---|
| Quadrant D | 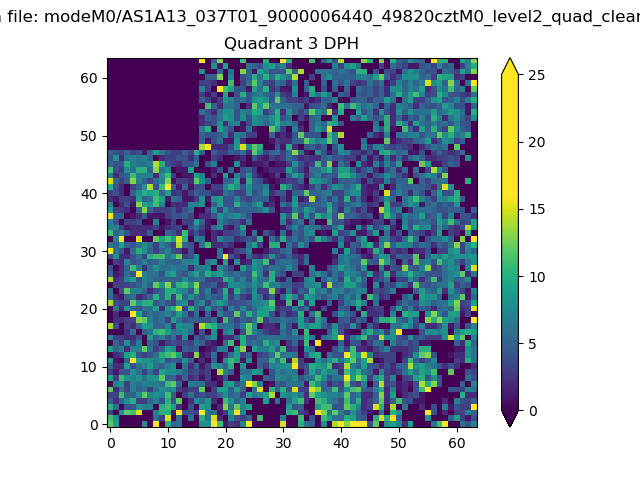 |
 |
Quadrant C |
| Plot type | Count rate plots | Images |
|---|---|---|
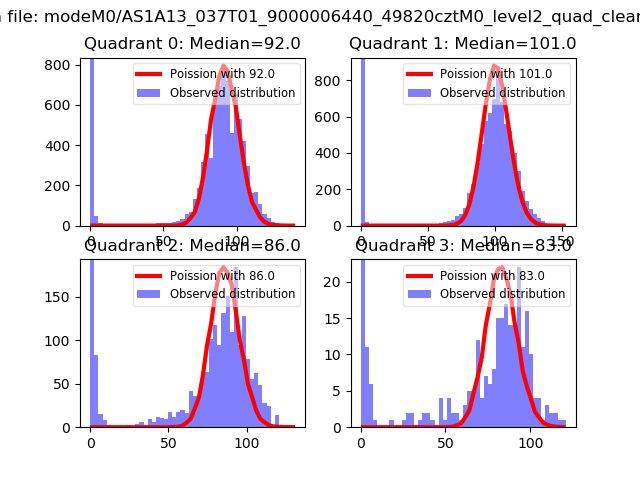
| Comparison with Poisson distribution Blue bars denote a histogram of data divided into 1 sec bins. Red curve is a Poisson curve with rate = median count rate of data. |
 |
 |
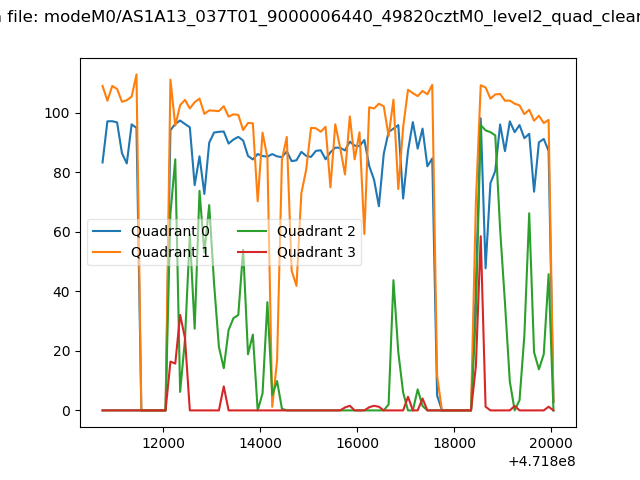
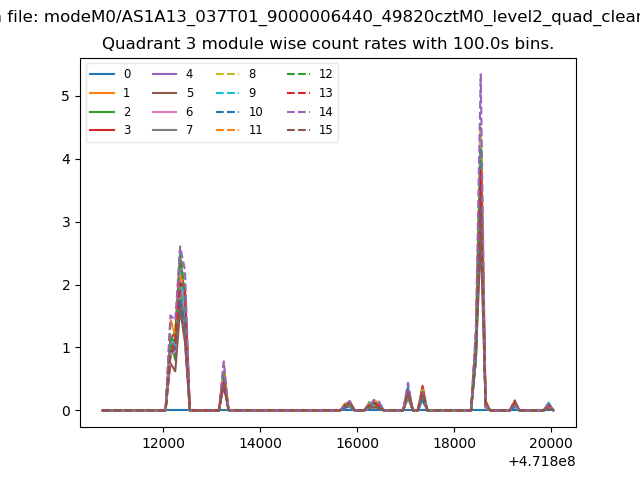
| Quadrant-wise count rates Data is divided into 100 sec bins |
 |
|
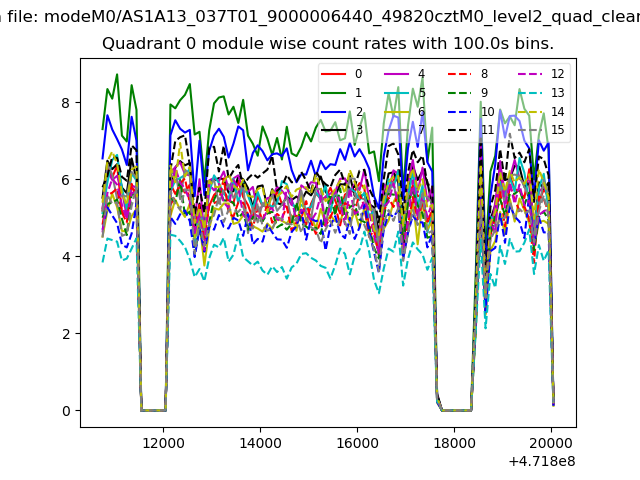
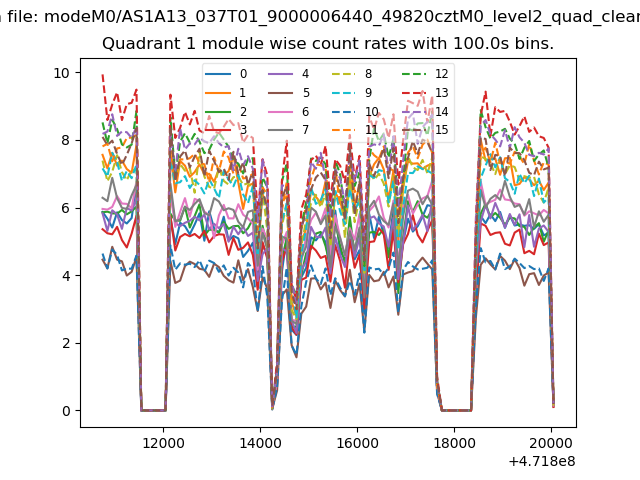
| Module-wise count rates for Quadrant A Data is divided into 100 sec bins |
 |
 |
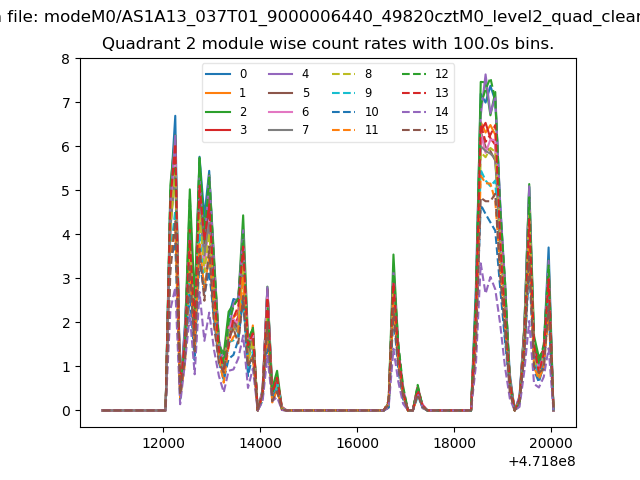
| Module-wise count rates for Quadrant B Data is divided into 100 sec bins |
 |
 |
| Module-wise count rates for Quadrant C Data is divided into 100 sec bins |
 |
 |
| Module-wise count rates for Quadrant D Data is divided into 100 sec bins |
 |
 |
| Parameter | Plot |
|---|---|
| CZT HV Monitor | 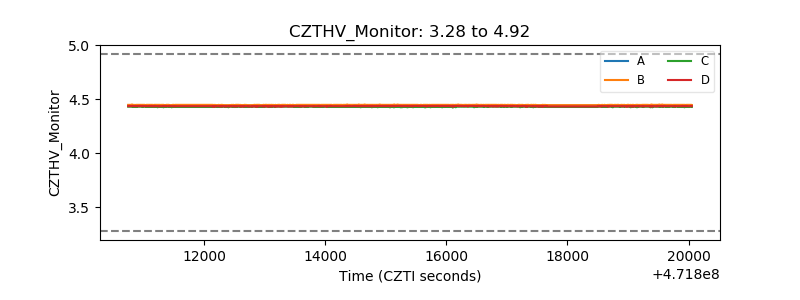 |
| D_VDD | 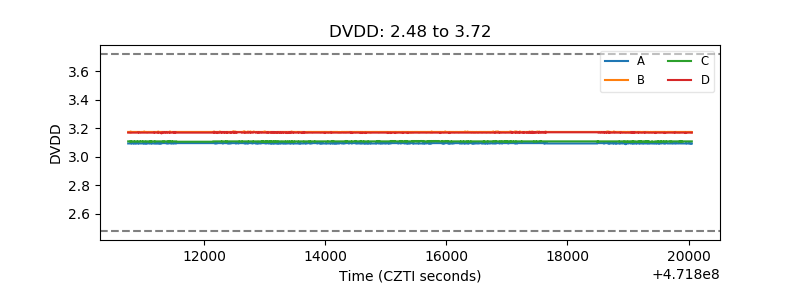 |
| Temperature 1 | 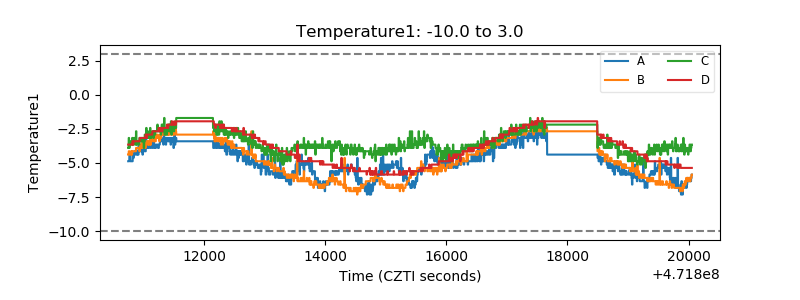 |
| Veto HV Monitor | 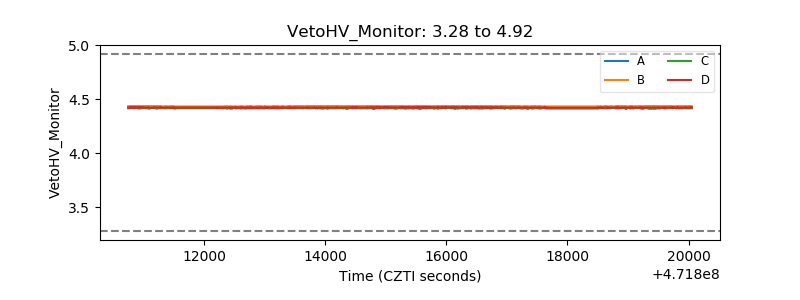 |
| Veto LLD | 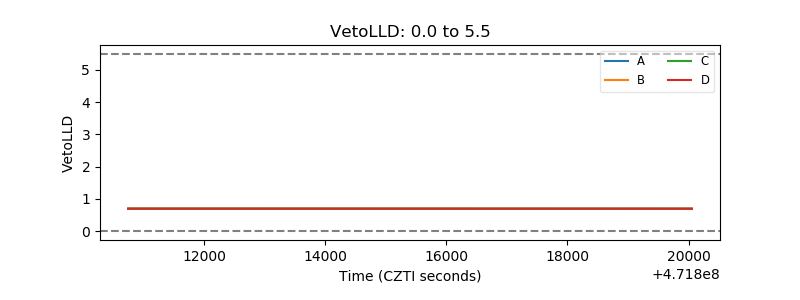 |
| Alpha Counter | 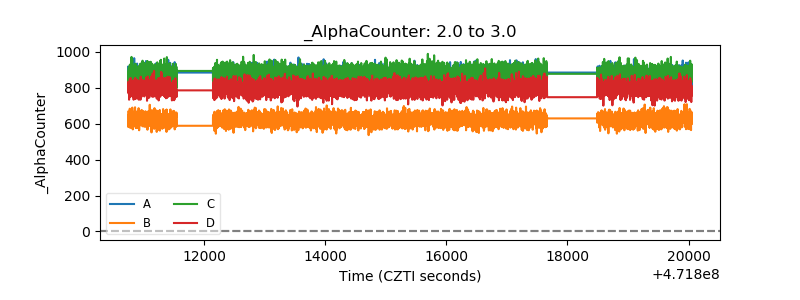 |
| _CPM_Rate | 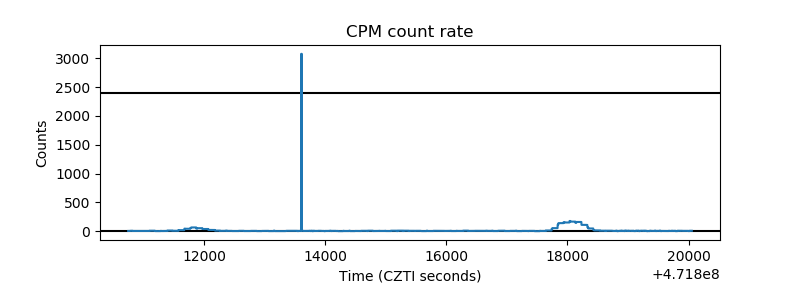 |
| CZT Counter | 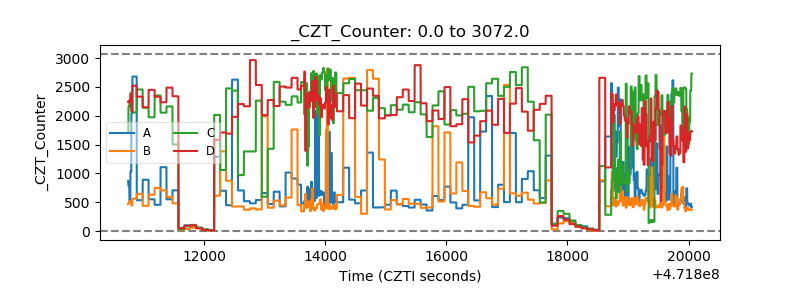 |
| +2.5 Volts monitor |  |
| +5 Volts monitor | 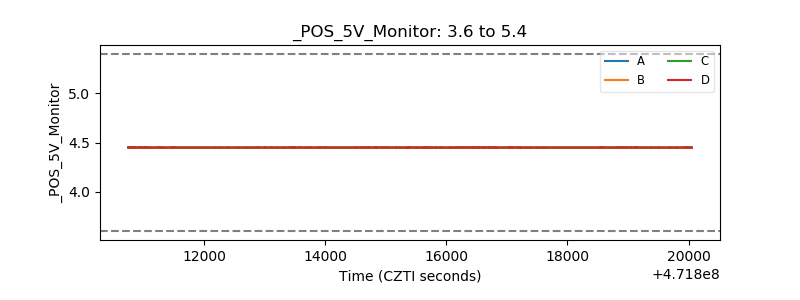 |
| _ROLL_ROT | 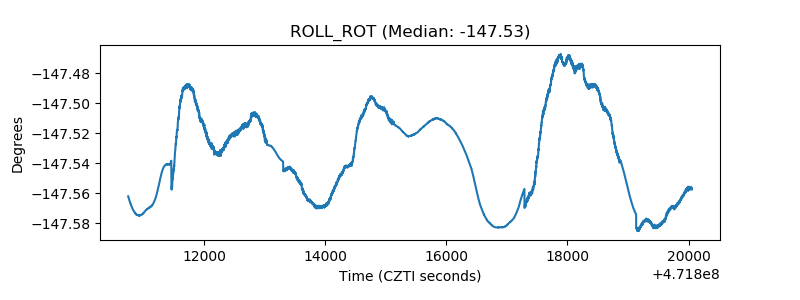 |
| _Roll_DEC | 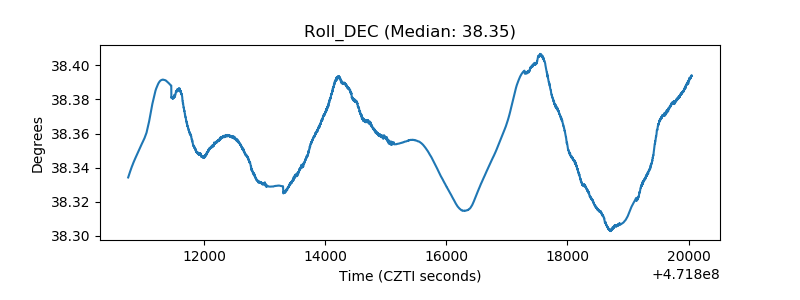 |
| _Roll_RA | 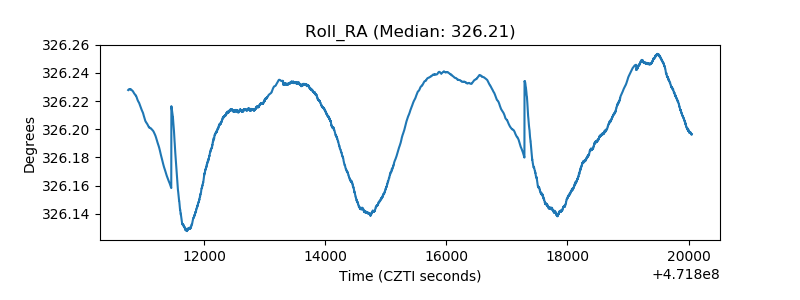 |
| Veto Counter | 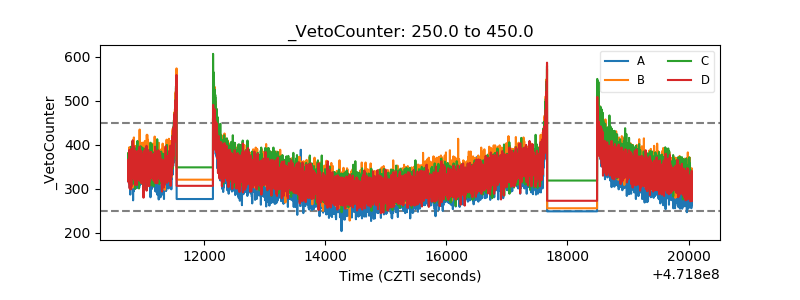 |