| Param | Original file | Final file |
|---|---|---|
| Filename | modeM0/AS1A13_037T01_9000006440_49821cztM0_level2.fits | modeM0/AS1A13_037T01_9000006440_49821cztM0_level2_quad_clean.evt |
| Size (bytes) | 985,227,840 | 57,689,280 |
| Size | 939.6 MB | 55.0 MB |
| Events in quadrant A | 7,428,709 | 510,271 |
| Events in quadrant B | 3,608,266 | 666,458 |
| Events in quadrant C | 11,778,252 | 94,310 |
| Events in quadrant D | 13,141,578 | 15,064 |
| Mode M9 | |||
|---|---|---|---|
| Quadrant | BADHDUFLAG | Total packets | Discarded packets |
| A | 0 | 10 | 0 |
| B | 0 | 10 | 0 |
| C | 0 | 10 | 0 |
| D | 0 | 10 | 0 |
| Mode SS | |||
|---|---|---|---|
| Quadrant | BADHDUFLAG | Total packets | Discarded packets |
| A | 0 | 134 | 0 |
| B | 0 | 134 | 0 |
| C | 0 | 134 | 0 |
| D | 0 | 134 | 0 |
| Mode M0 | |||
|---|---|---|---|
| Quadrant | BADHDUFLAG | Total packets | Discarded packets |
| A | 0 | 26647 | 1 |
| B | 0 | 15266 | 1 |
| C | 0 | 39530 | 1 |
| D | 0 | 43581 | 1 |
| Quadrant | Total seconds | Saturated seconds | Saturation percentage |
|---|---|---|---|
| A | 6601 | 1236 | 18.724436% |
| B | 6601 | 97 | 1.469474% |
| C | 6601 | 5724 | 86.714134% |
| D | 6602 | 6475 | 98.076341% |
Noise dominated data is calculated using 1-second bins in cleaned event files. If a bin has >2000 counts, and if more than 50% of those come from <1% of pixels, then it is considered to be noise-dominated and hence unusable.
| Quadrant | # 1 sec bins | Bins with >0 counts | Bins with >2000 counts | High rate bins dominated by noise | Noise dominated (total time) | Noise dominated (detector-on time) | Marked lightcurve |
|---|---|---|---|---|---|---|---|
| A | 7581 | 6602 | 1149 | 1149 | 15.16% | 17.40% | 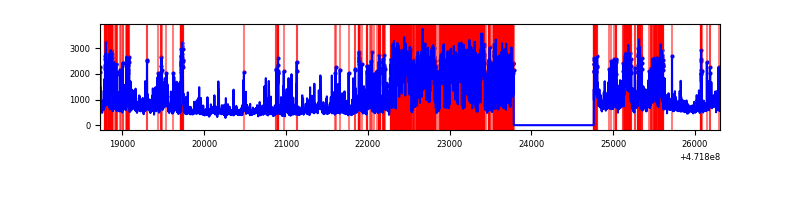 |
| B | 7581 | 6602 | 67 | 67 | 0.88% | 1.01% | 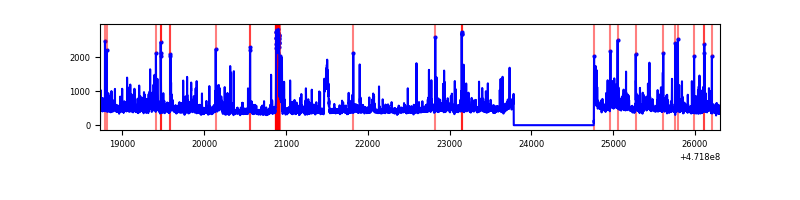 |
| C | 7581 | 6602 | 2789 | 2789 | 36.79% | 42.24% | 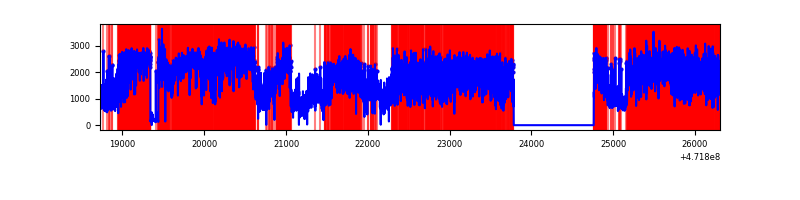 |
| D | 7582 | 6603 | 3340 | 3340 | 44.05% | 50.58% | 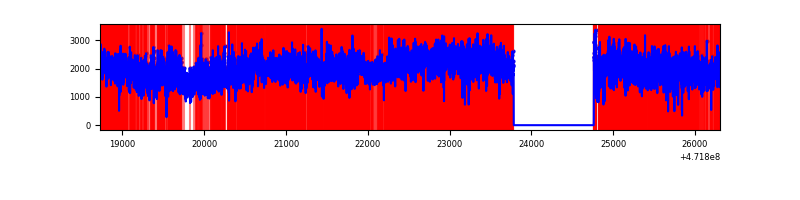 |
Top three noisy pixels from each quadrant. If the there are fewer than three noisy pixels in the level2.evt file, extra rows are filled as -1
| Pixel properties | Quadrant properties | ||||||
|---|---|---|---|---|---|---|---|
| Quadrant | DetID | PixID | Counts | Sigma | Mean | Median | Sigma |
| A | 0 | 175 | 2288471 | 14062.18 | 639 | 622 | 162.7 |
| A | 3 | 1 | 460077 | 2824.02 | 639 | 622 | 162.7 |
| A | 4 | 4 | 454239 | 2788.14 | 639 | 622 | 162.7 |
| B | 5 | 49 | 207153 | 1399.5 | 698 | 676 | 147.5 |
| B | 0 | 229 | 158409 | 1069.11 | 698 | 676 | 147.5 |
| B | 4 | 206 | 118402 | 797.94 | 698 | 676 | 147.5 |
| C | 15 | 147 | 3620919 | 38826.65 | 254 | 248 | 93.3 |
| C | 1 | 44 | 1175251 | 12600.27 | 254 | 248 | 93.3 |
| C | 15 | 197 | 1164367 | 12483.55 | 254 | 248 | 93.3 |
| D | 7 | 61 | 6121222 | 73254.08 | 247 | 236 | 83.6 |
| D | 14 | 66 | 1431564 | 17129.69 | 247 | 236 | 83.6 |
| D | 15 | 184 | 1276166 | 15269.94 | 247 | 236 | 83.6 |
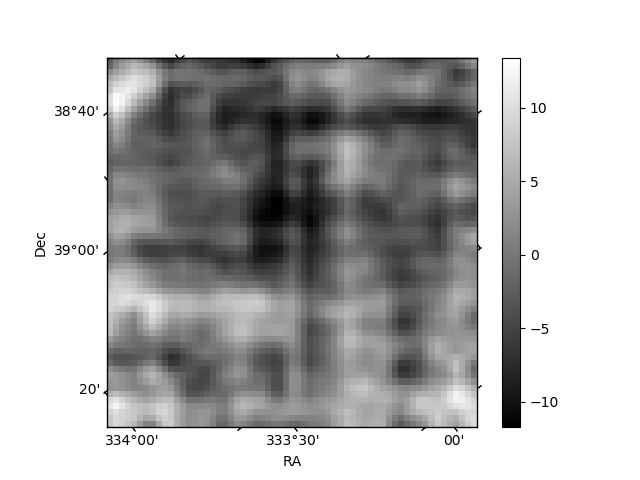
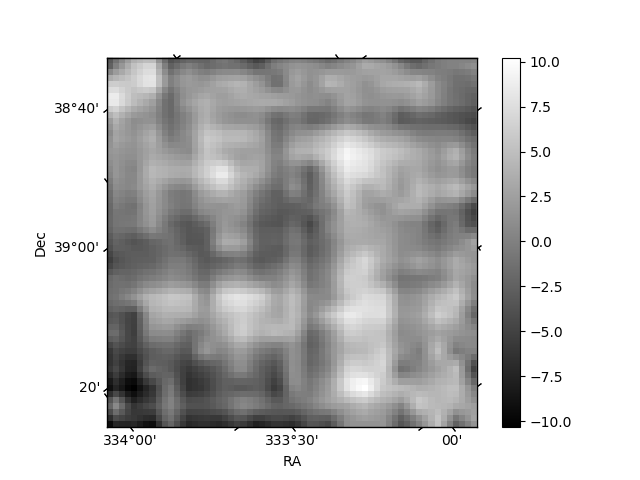
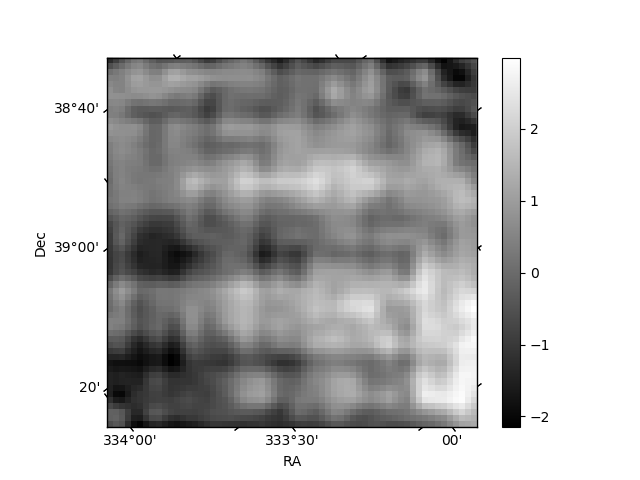
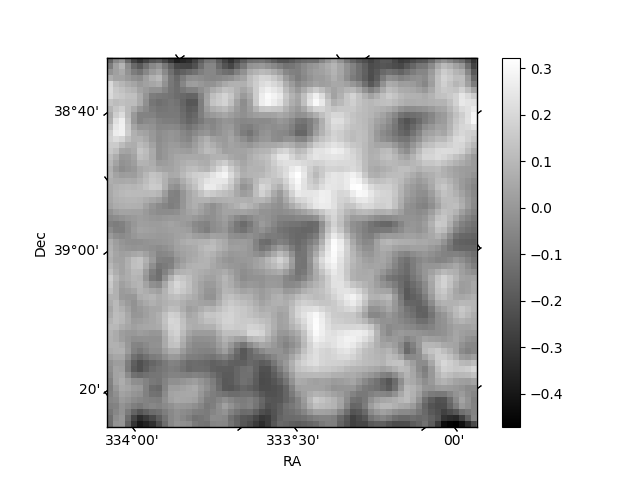
Histogram calculated using DETX and DETY for each event in the final _common_clean file
| Quadrant A | 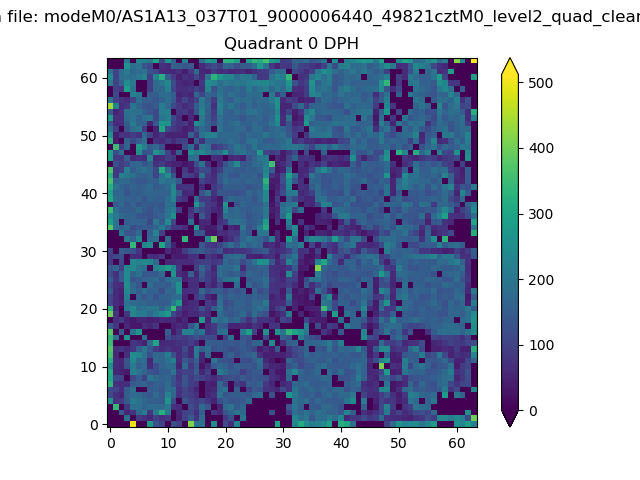 |
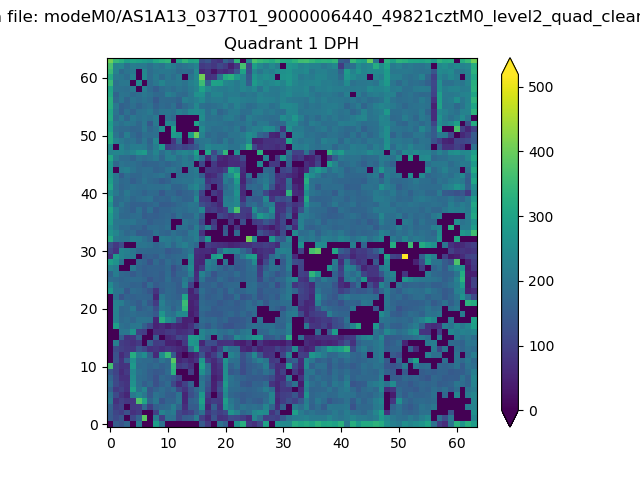 |
Quadrant B |
|---|---|---|---|
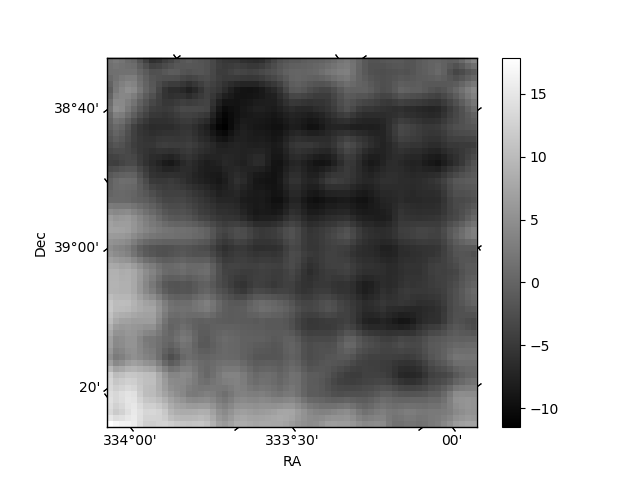
| Quadrant D | 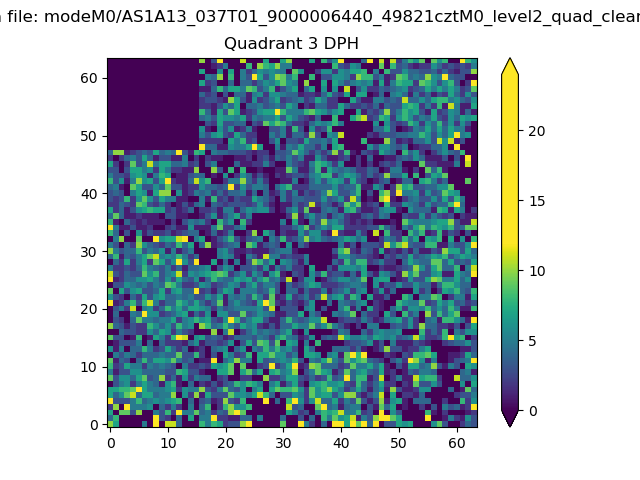 |
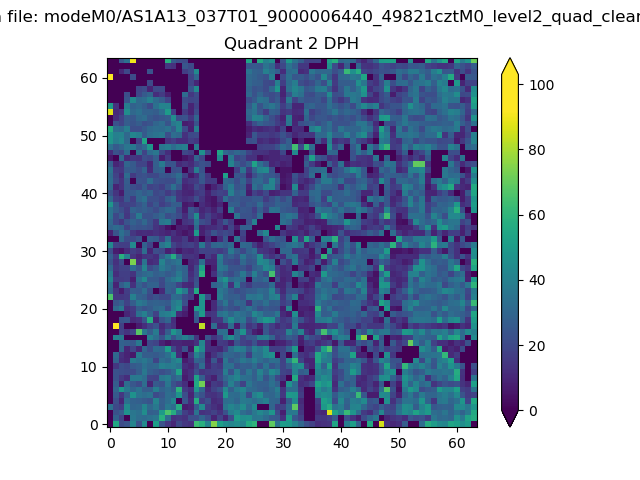 |
Quadrant C |
| Plot type | Count rate plots | Images |
|---|---|---|
| Comparison with Poisson distribution Blue bars denote a histogram of data divided into 1 sec bins. Red curve is a Poisson curve with rate = median count rate of data. |
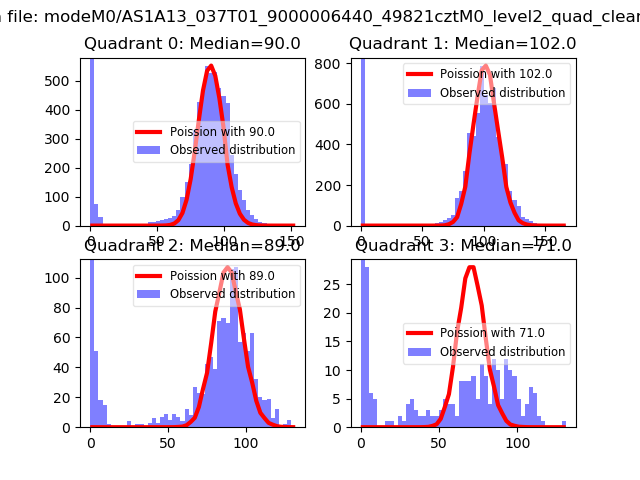 |
 |
| Quadrant-wise count rates Data is divided into 100 sec bins |
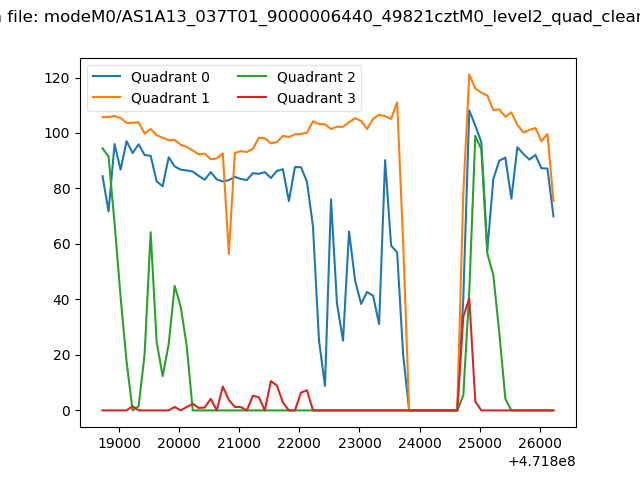 |
|
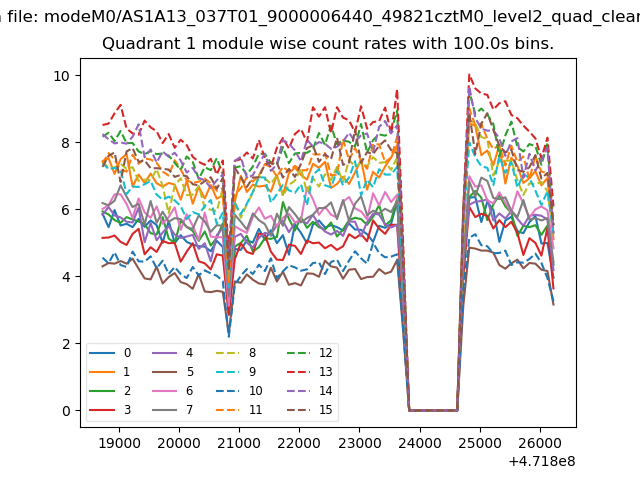
| Module-wise count rates for Quadrant A Data is divided into 100 sec bins |
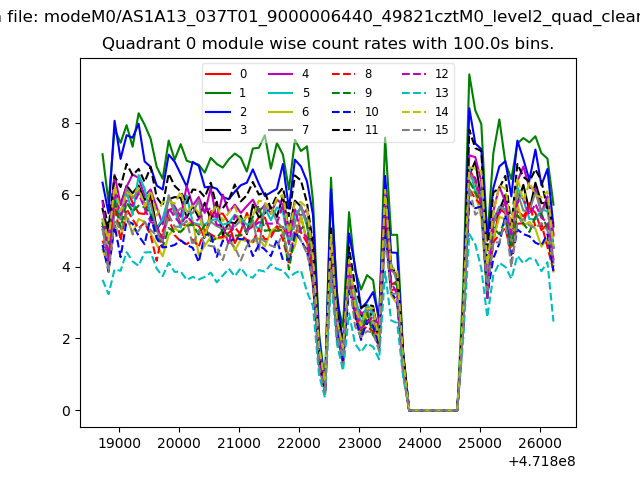 |
 |
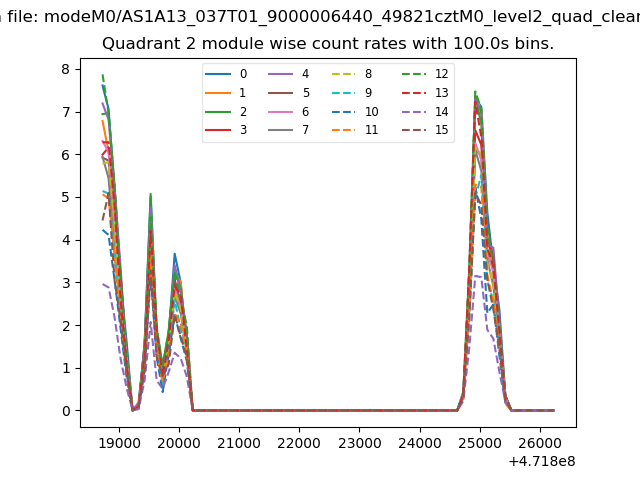
| Module-wise count rates for Quadrant B Data is divided into 100 sec bins |
 |
 |
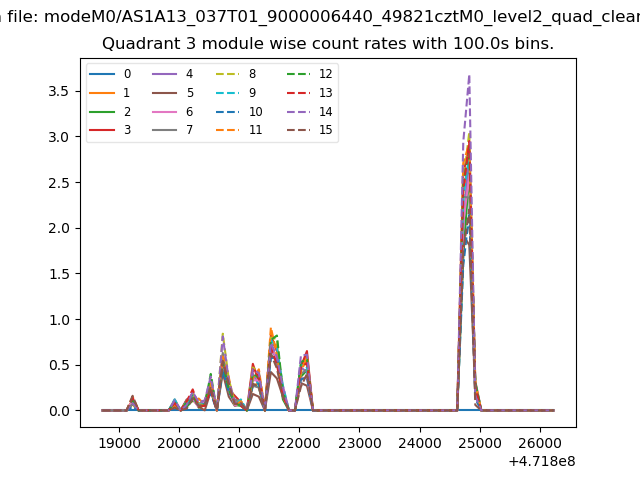
| Module-wise count rates for Quadrant C Data is divided into 100 sec bins |
 |
 |
| Module-wise count rates for Quadrant D Data is divided into 100 sec bins |
 |
 |
| Parameter | Plot |
|---|---|
| CZT HV Monitor | 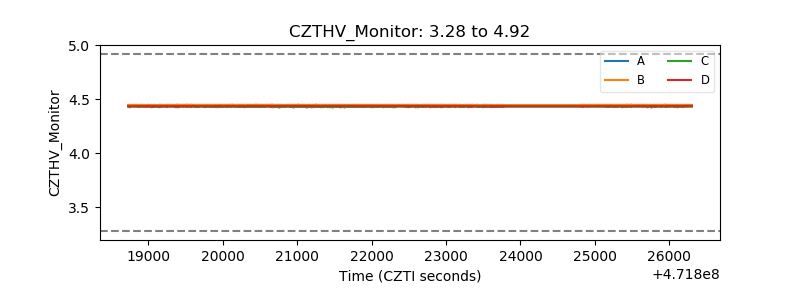 |
| D_VDD |  |
| Temperature 1 | 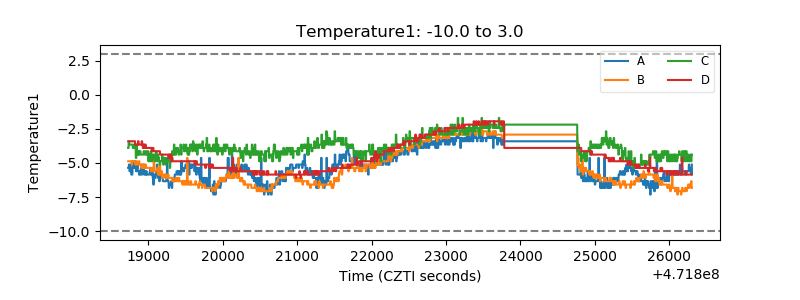 |
| Veto HV Monitor | 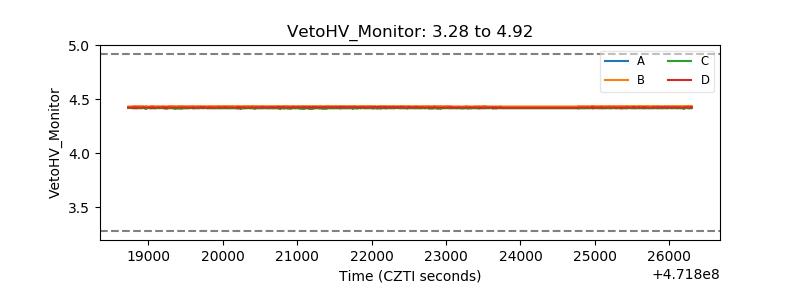 |
| Veto LLD | 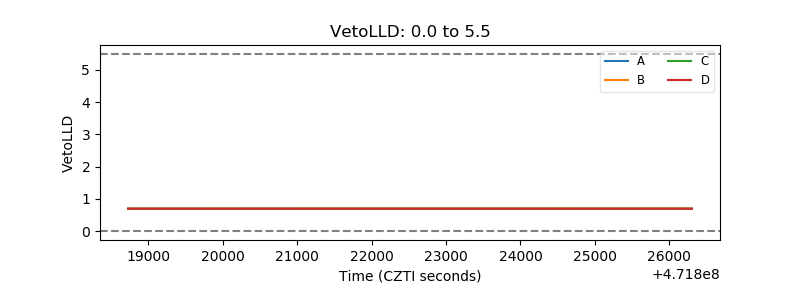 |
| Alpha Counter | 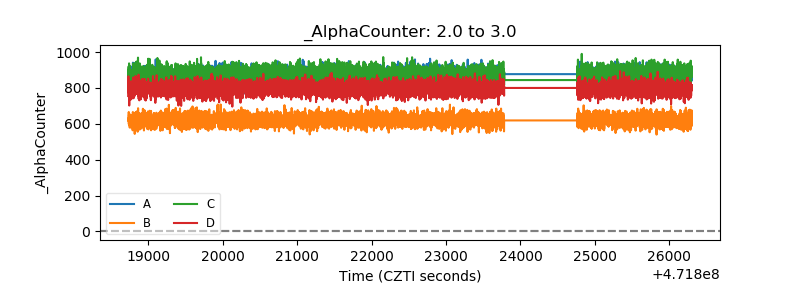 |
| _CPM_Rate | 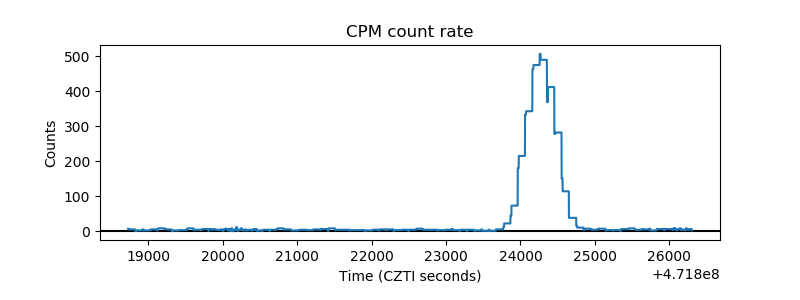 |
| CZT Counter | 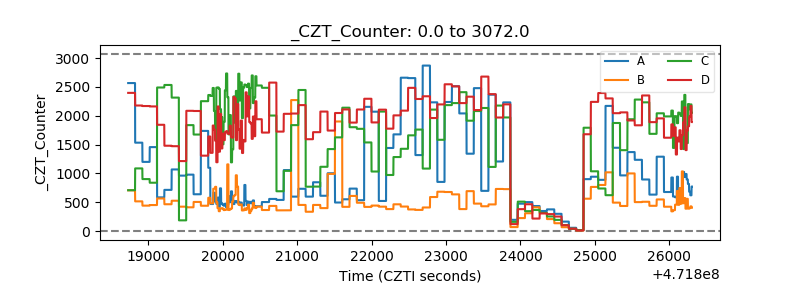 |
| +2.5 Volts monitor |  |
| +5 Volts monitor | 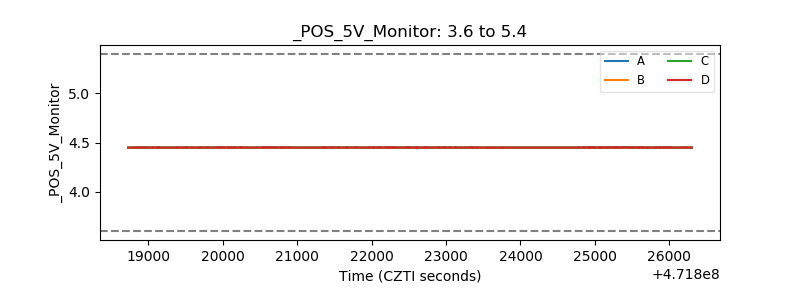 |
| _ROLL_ROT | 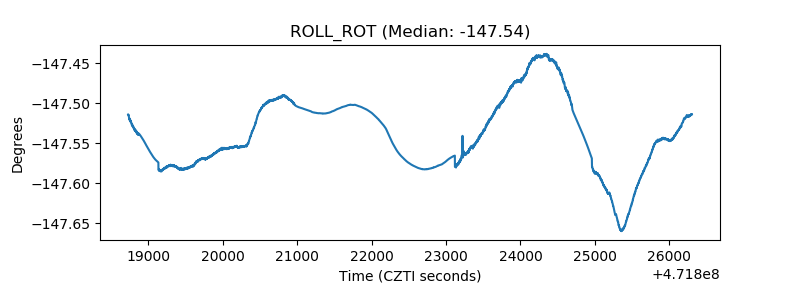 |
| _Roll_DEC | 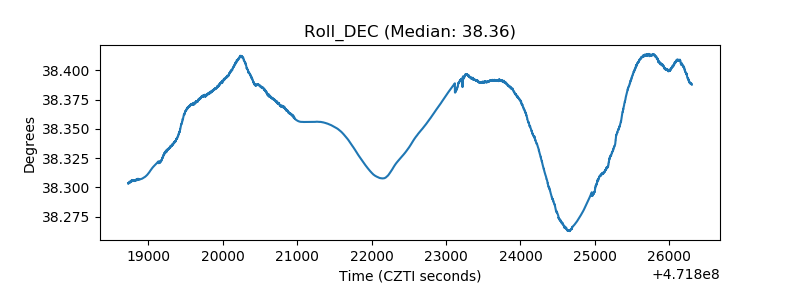 |
| _Roll_RA | 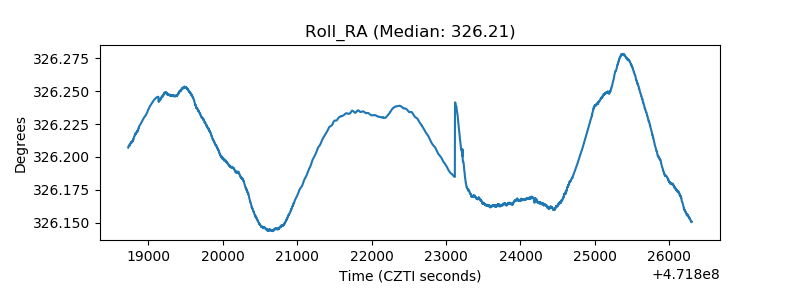 |
| Veto Counter | 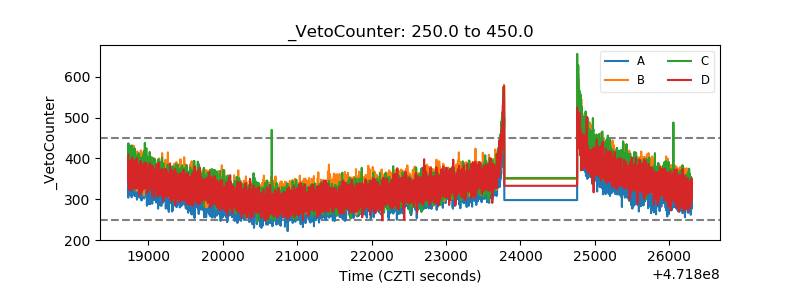 |