| Param | Original file | Final file |
|---|---|---|
| Filename | modeM0/AS1A13_037T01_9000006440_49824cztM0_level2.fits | modeM0/AS1A13_037T01_9000006440_49824cztM0_level2_quad_clean.evt |
| Size (bytes) | 969,364,800 | 51,822,720 |
| Size | 924.5 MB | 49.4 MB |
| Events in quadrant A | 7,347,487 | 464,519 |
| Events in quadrant B | 3,357,843 | 617,445 |
| Events in quadrant C | 12,015,361 | 52,946 |
| Events in quadrant D | 12,714,174 | 29,418 |
| Mode M9 | |||
|---|---|---|---|
| Quadrant | BADHDUFLAG | Total packets | Discarded packets |
| A | 0 | 11 | 0 |
| B | 0 | 11 | 0 |
| C | 0 | 11 | 0 |
| D | 0 | 11 | 0 |
| Mode SS | |||
|---|---|---|---|
| Quadrant | BADHDUFLAG | Total packets | Discarded packets |
| A | 0 | 120 | 0 |
| B | 0 | 120 | 0 |
| C | 0 | 120 | 0 |
| D | 0 | 120 | 0 |
| Mode M0 | |||
|---|---|---|---|
| Quadrant | BADHDUFLAG | Total packets | Discarded packets |
| A | 0 | 25850 | 1 |
| B | 0 | 13896 | 1 |
| C | 0 | 39646 | 8 |
| D | 0 | 41673 | 1 |
| Quadrant | Total seconds | Saturated seconds | Saturation percentage |
|---|---|---|---|
| A | 5781 | 1233 | 21.328490% |
| B | 5781 | 153 | 2.646601% |
| C | 5780 | 5385 | 93.166090% |
| D | 5780 | 5546 | 95.951557% |
Noise dominated data is calculated using 1-second bins in cleaned event files. If a bin has >2000 counts, and if more than 50% of those come from <1% of pixels, then it is considered to be noise-dominated and hence unusable.
| Quadrant | # 1 sec bins | Bins with >0 counts | Bins with >2000 counts | High rate bins dominated by noise | Noise dominated (total time) | Noise dominated (detector-on time) | Marked lightcurve |
|---|---|---|---|---|---|---|---|
| A | 6951 | 5782 | 1131 | 1131 | 16.27% | 19.56% | 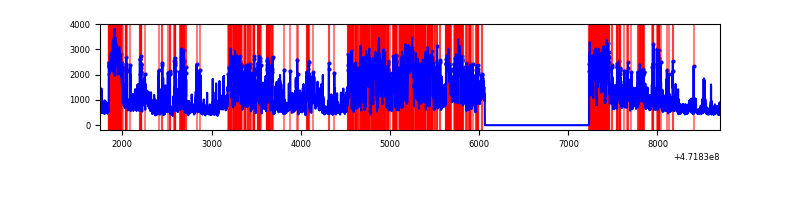 |
| B | 6951 | 5782 | 96 | 96 | 1.38% | 1.66% | 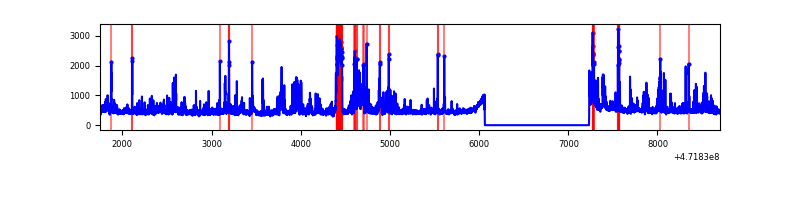 |
| C | 6950 | 5780 | 3410 | 3410 | 49.06% | 59.00% | 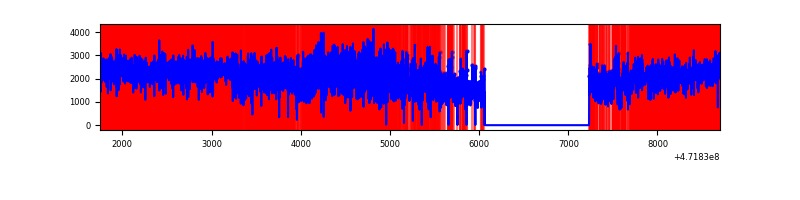 |
| D | 6950 | 5781 | 4010 | 4010 | 57.70% | 69.37% | 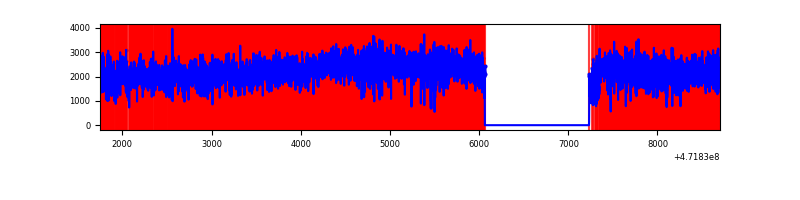 |
Top three noisy pixels from each quadrant. If the there are fewer than three noisy pixels in the level2.evt file, extra rows are filled as -1
| Pixel properties | Quadrant properties | ||||||
|---|---|---|---|---|---|---|---|
| Quadrant | DetID | PixID | Counts | Sigma | Mean | Median | Sigma |
| A | 4 | 4 | 2098993 | 13907.96 | 590 | 573 | 150.9 |
| A | 0 | 175 | 913029 | 6047.6 | 590 | 573 | 150.9 |
| A | 0 | 50 | 339789 | 2248.26 | 590 | 573 | 150.9 |
| B | 5 | 49 | 243316 | 1807.74 | 634 | 616 | 134.3 |
| B | 10 | 28 | 186021 | 1380.98 | 634 | 616 | 134.3 |
| B | 4 | 206 | 86175 | 637.28 | 634 | 616 | 134.3 |
| C | 15 | 147 | 4161868 | 72685.14 | 190 | 189 | 57.3 |
| C | 15 | 197 | 1974999 | 34490.73 | 190 | 189 | 57.3 |
| C | 5 | 236 | 966478 | 16876.57 | 190 | 189 | 57.3 |
| D | 7 | 61 | 6539330 | 77006.14 | 262 | 251 | 84.9 |
| D | 14 | 66 | 1009485 | 11885.04 | 262 | 251 | 84.9 |
| D | 7 | 126 | 712056 | 8382.43 | 262 | 251 | 84.9 |
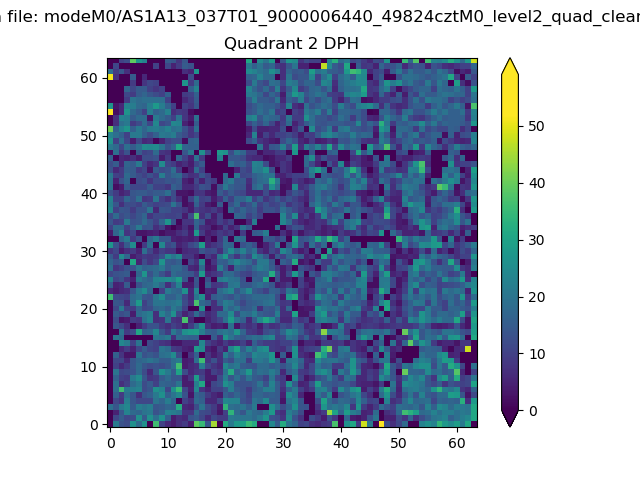
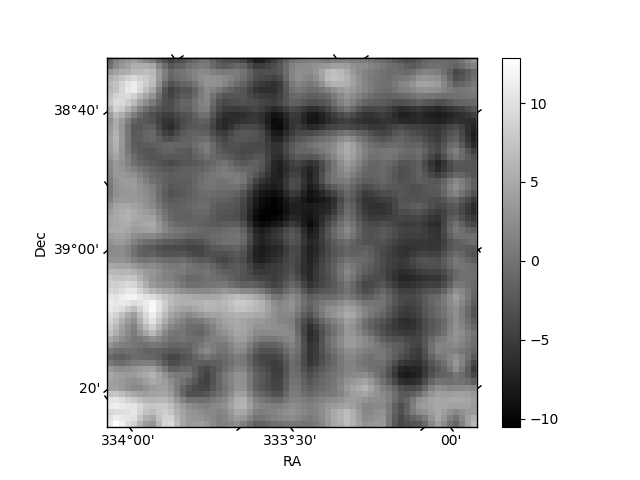
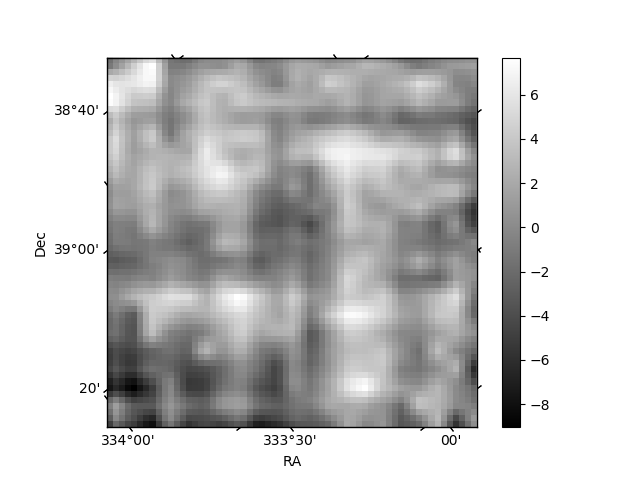
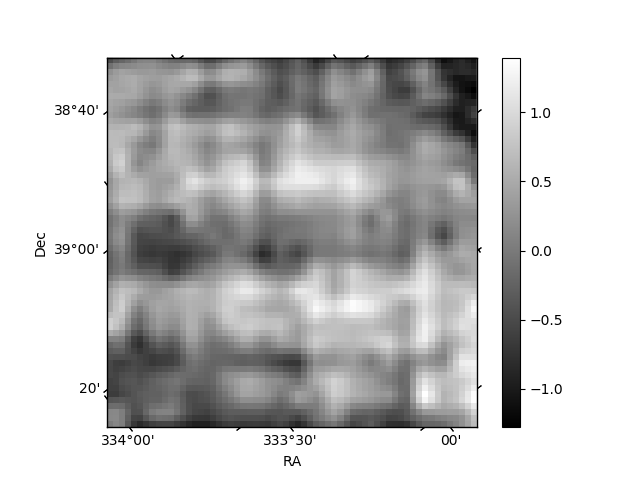
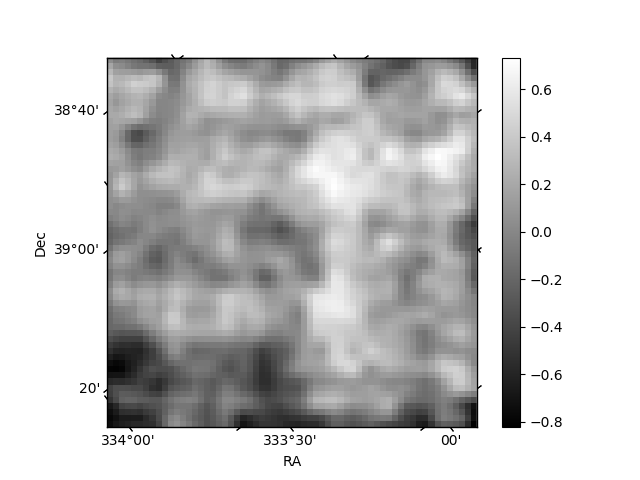
Histogram calculated using DETX and DETY for each event in the final _common_clean file
| Quadrant A | 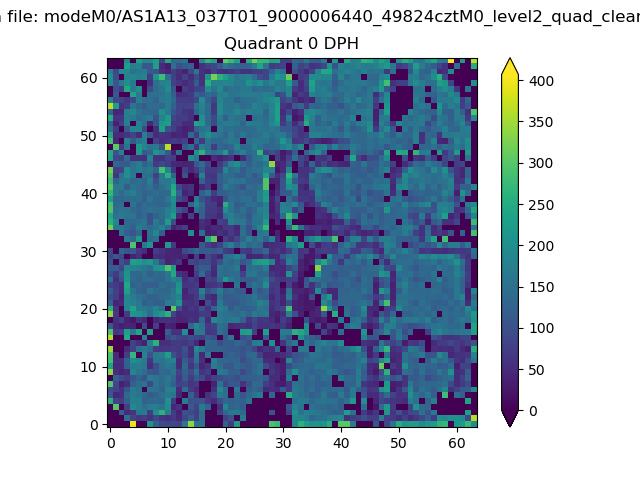 |
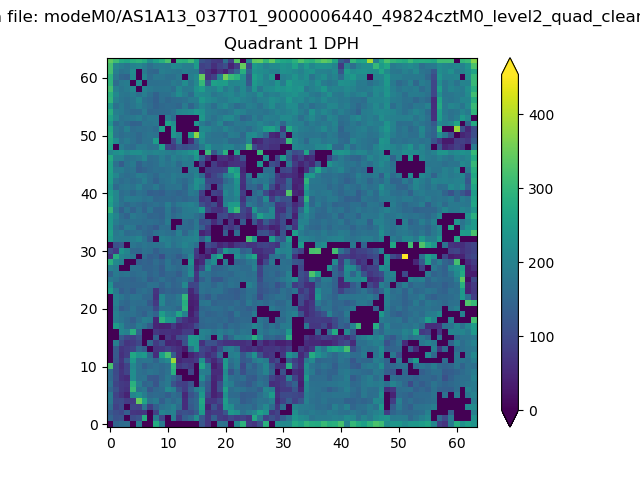 |
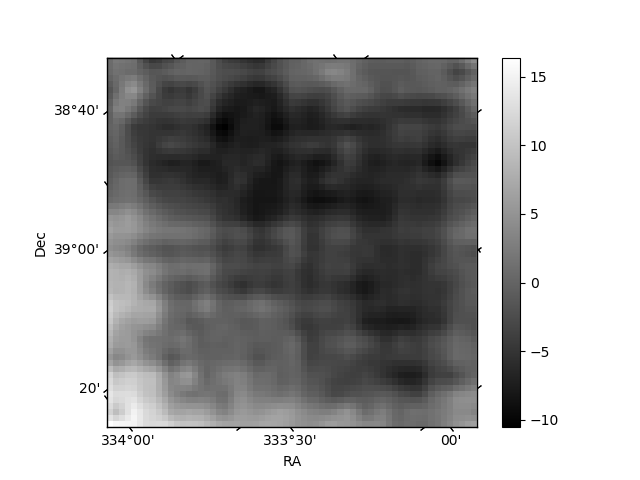
Quadrant B |
|---|---|---|---|
| Quadrant D | 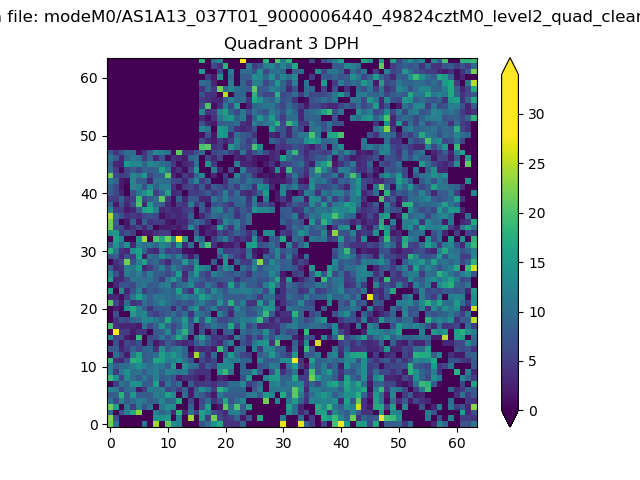 |
 |
Quadrant C |
| Plot type | Count rate plots | Images |
|---|---|---|
| Comparison with Poisson distribution Blue bars denote a histogram of data divided into 1 sec bins. Red curve is a Poisson curve with rate = median count rate of data. |
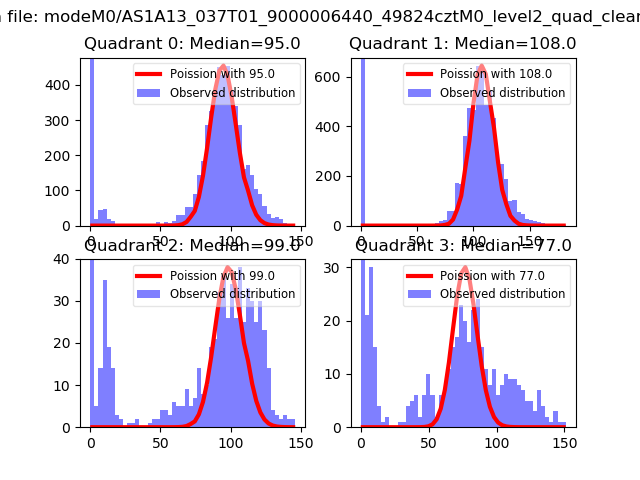 |
 |
| Quadrant-wise count rates Data is divided into 100 sec bins |
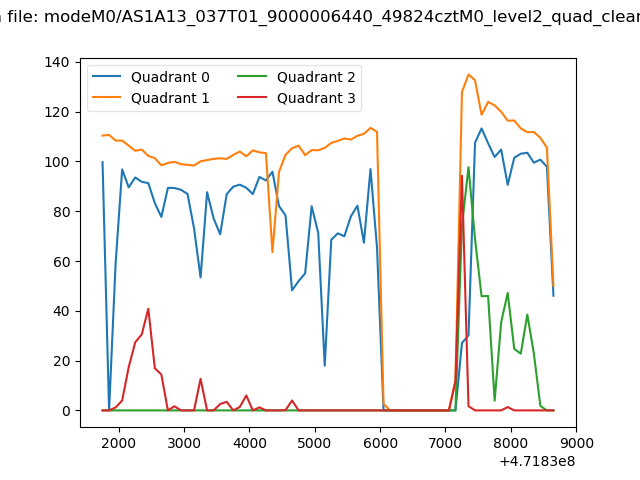 |
|
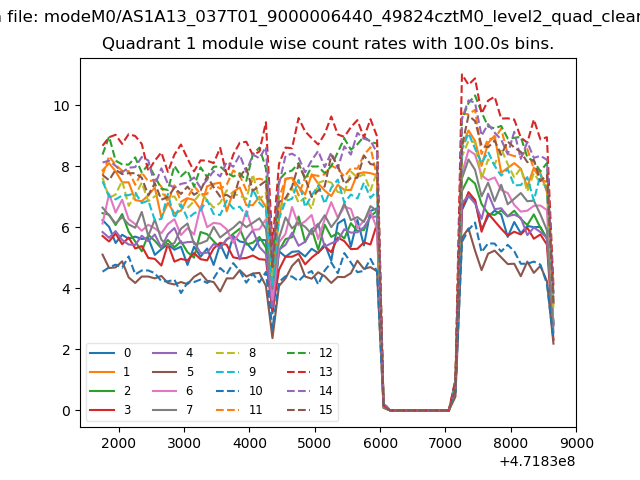
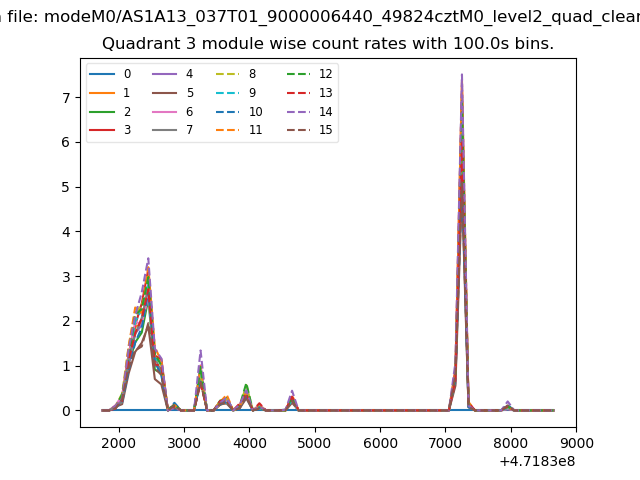
| Module-wise count rates for Quadrant A Data is divided into 100 sec bins |
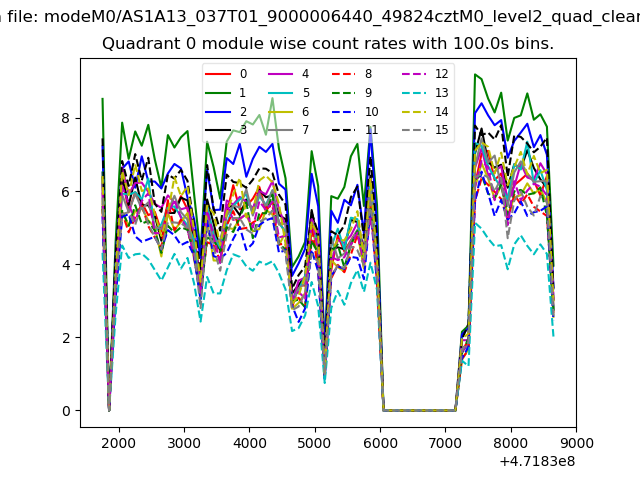 |
 |
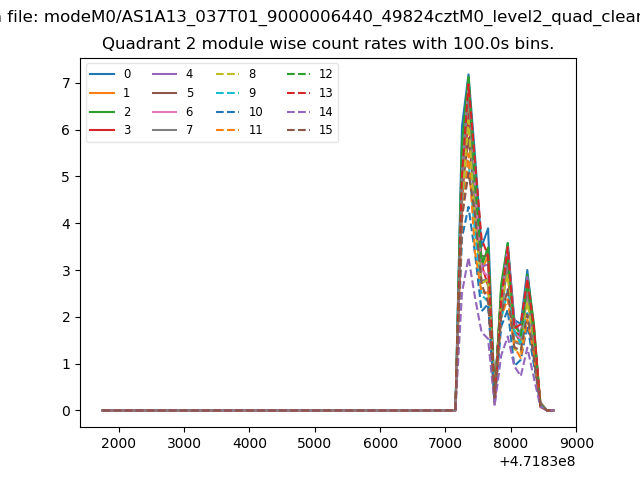
| Module-wise count rates for Quadrant B Data is divided into 100 sec bins |
 |
 |
| Module-wise count rates for Quadrant C Data is divided into 100 sec bins |
 |
 |
| Module-wise count rates for Quadrant D Data is divided into 100 sec bins |
 |
 |
| Parameter | Plot |
|---|---|
| CZT HV Monitor | 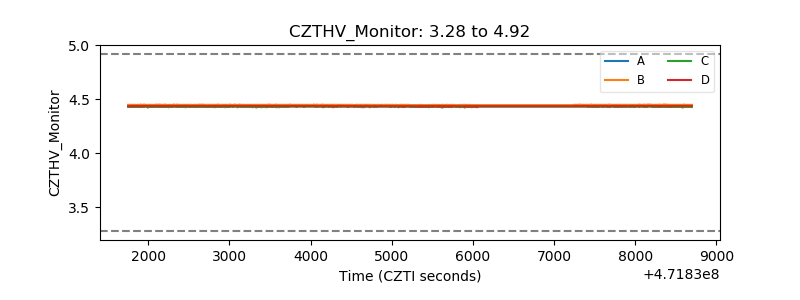 |
| D_VDD | 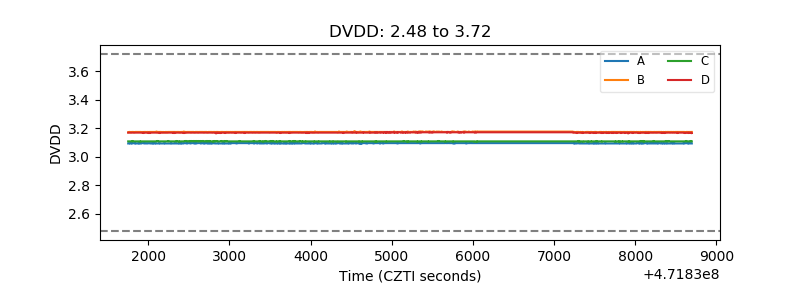 |
| Temperature 1 | 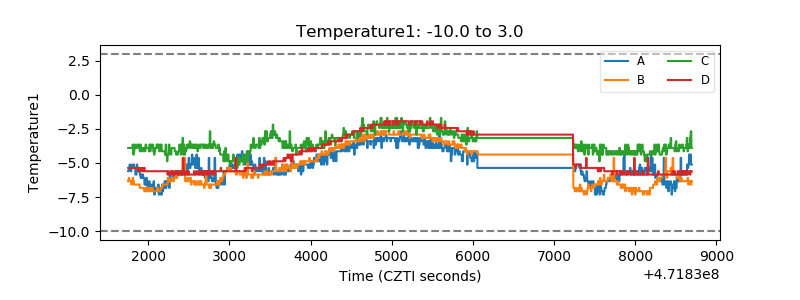 |
| Veto HV Monitor | 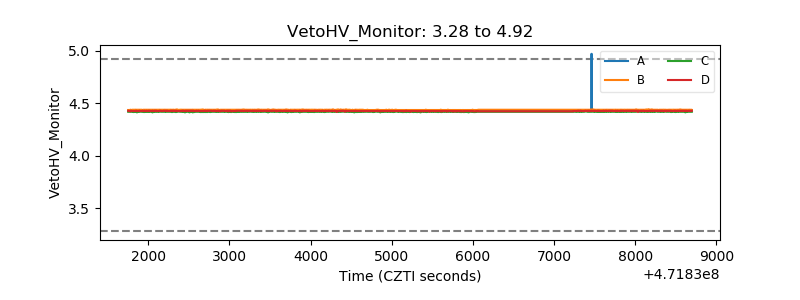 |
| Veto LLD | 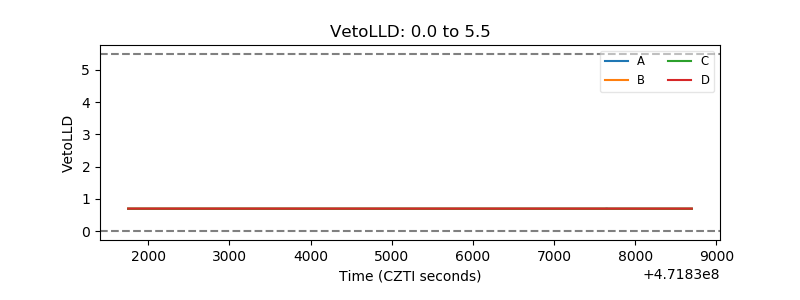 |
| Alpha Counter | 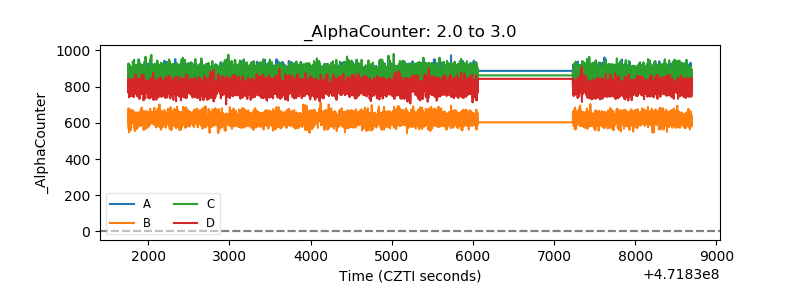 |
| _CPM_Rate | 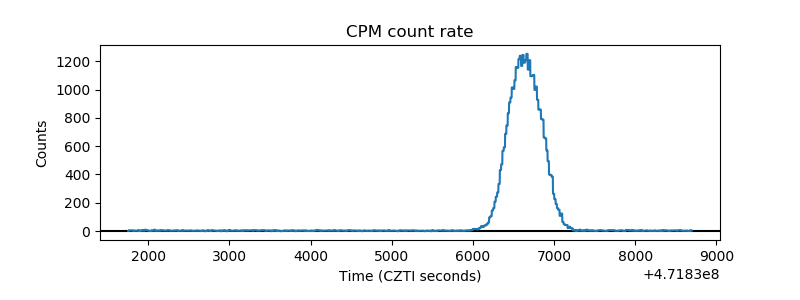 |
| CZT Counter | 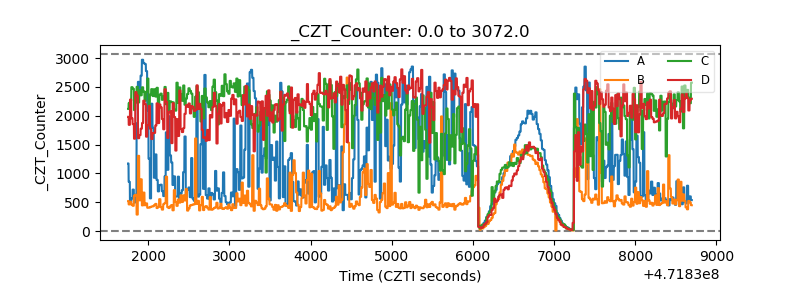 |
| +2.5 Volts monitor | 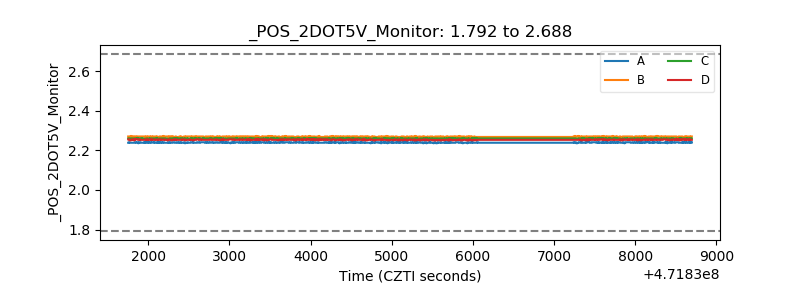 |
| +5 Volts monitor | 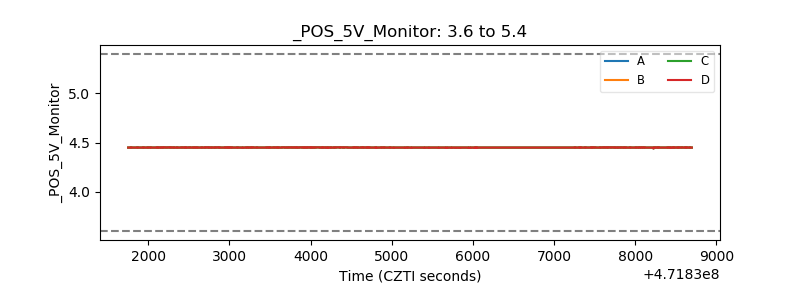 |
| _ROLL_ROT | 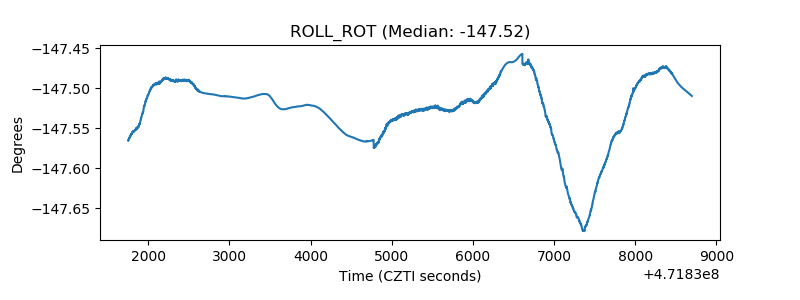 |
| _Roll_DEC | 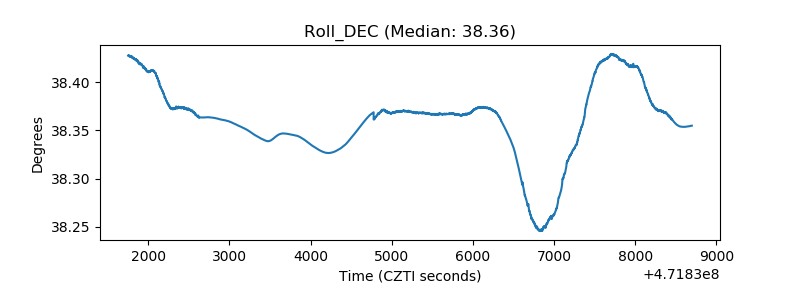 |
| _Roll_RA | 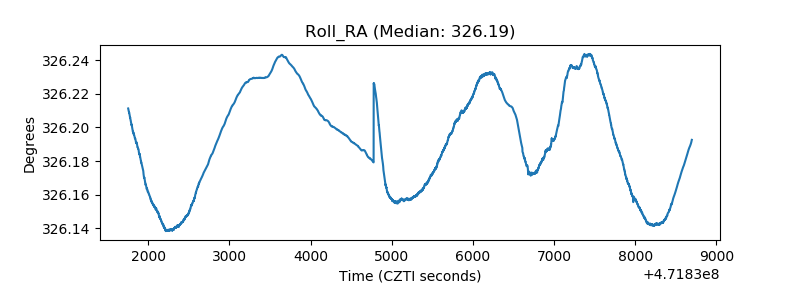 |
| Veto Counter | 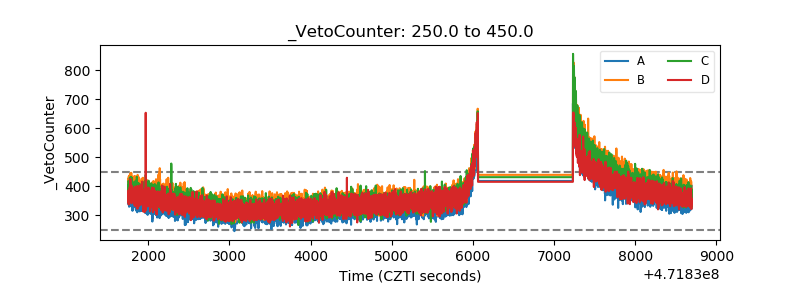 |