| Param | Original file | Final file |
|---|---|---|
| Filename | modeM0/AS1A13_037T01_9000006440_49825cztM0_level2.fits | modeM0/AS1A13_037T01_9000006440_49825cztM0_level2_quad_clean.evt |
| Size (bytes) | 1,090,722,240 | 61,188,480 |
| Size | 1.0 GB | 58.4 MB |
| Events in quadrant A | 8,125,165 | 557,399 |
| Events in quadrant B | 3,674,925 | 721,175 |
| Events in quadrant C | 13,915,318 | 75,339 |
| Events in quadrant D | 14,158,943 | 47,107 |
| Mode M9 | |||
|---|---|---|---|
| Quadrant | BADHDUFLAG | Total packets | Discarded packets |
| A | 0 | 11 | 0 |
| B | 0 | 11 | 0 |
| C | 0 | 11 | 0 |
| D | 0 | 11 | 0 |
| Mode SS | |||
|---|---|---|---|
| Quadrant | BADHDUFLAG | Total packets | Discarded packets |
| A | 0 | 132 | 0 |
| B | 0 | 132 | 0 |
| C | 0 | 132 | 0 |
| D | 0 | 132 | 0 |
| Mode M0 | |||
|---|---|---|---|
| Quadrant | BADHDUFLAG | Total packets | Discarded packets |
| A | 0 | 28630 | 2 |
| B | 0 | 15308 | 1 |
| C | 0 | 45731 | 1 |
| D | 0 | 46421 | 1 |
| Quadrant | Total seconds | Saturated seconds | Saturation percentage |
|---|---|---|---|
| A | 6471 | 1245 | 19.239685% |
| B | 6471 | 153 | 2.364395% |
| C | 6472 | 5882 | 90.883807% |
| D | 6472 | 6104 | 94.313968% |
Noise dominated data is calculated using 1-second bins in cleaned event files. If a bin has >2000 counts, and if more than 50% of those come from <1% of pixels, then it is considered to be noise-dominated and hence unusable.
| Quadrant | # 1 sec bins | Bins with >0 counts | Bins with >2000 counts | High rate bins dominated by noise | Noise dominated (total time) | Noise dominated (detector-on time) | Marked lightcurve |
|---|---|---|---|---|---|---|---|
| A | 7646 | 6472 | 1107 | 1107 | 14.48% | 17.10% | 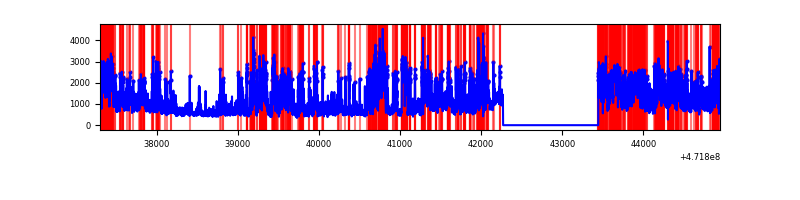 |
| B | 7646 | 6472 | 36 | 36 | 0.47% | 0.56% | 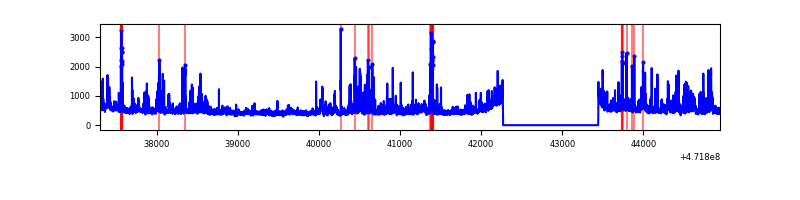 |
| C | 7647 | 6472 | 4146 | 4146 | 54.22% | 64.06% | 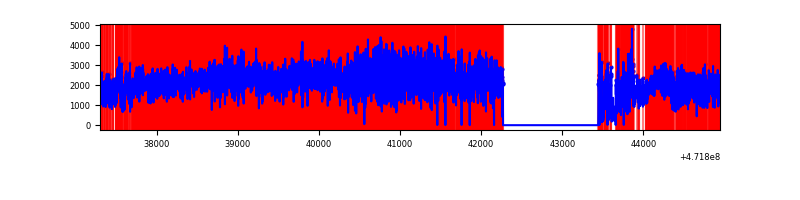 |
| D | 7647 | 6473 | 4357 | 4357 | 56.98% | 67.31% | 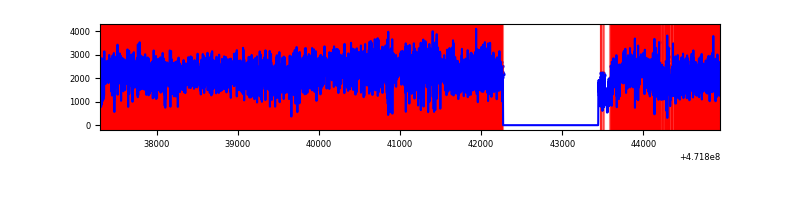 |
Top three noisy pixels from each quadrant. If the there are fewer than three noisy pixels in the level2.evt file, extra rows are filled as -1
| Pixel properties | Quadrant properties | ||||||
|---|---|---|---|---|---|---|---|
| Quadrant | DetID | PixID | Counts | Sigma | Mean | Median | Sigma |
| A | 4 | 4 | 2096842 | 11900.45 | 690 | 672 | 176.1 |
| A | 0 | 175 | 1209737 | 6864.15 | 690 | 672 | 176.1 |
| A | 4 | 13 | 470846 | 2669.29 | 690 | 672 | 176.1 |
| B | 10 | 28 | 123839 | 792.45 | 738 | 714 | 155.4 |
| B | 4 | 206 | 107266 | 685.78 | 738 | 714 | 155.4 |
| B | 5 | 49 | 97897 | 625.48 | 738 | 714 | 155.4 |
| C | 15 | 147 | 4473598 | 61148.86 | 251 | 250 | 73.2 |
| C | 15 | 197 | 1730902 | 23657.31 | 251 | 250 | 73.2 |
| C | 15 | 174 | 1219163 | 16662.05 | 251 | 250 | 73.2 |
| D | 7 | 61 | 7390218 | 83188.07 | 280 | 269 | 88.8 |
| D | 15 | 184 | 1860386 | 20939.19 | 280 | 269 | 88.8 |
| D | 7 | 126 | 918499 | 10336.44 | 280 | 269 | 88.8 |
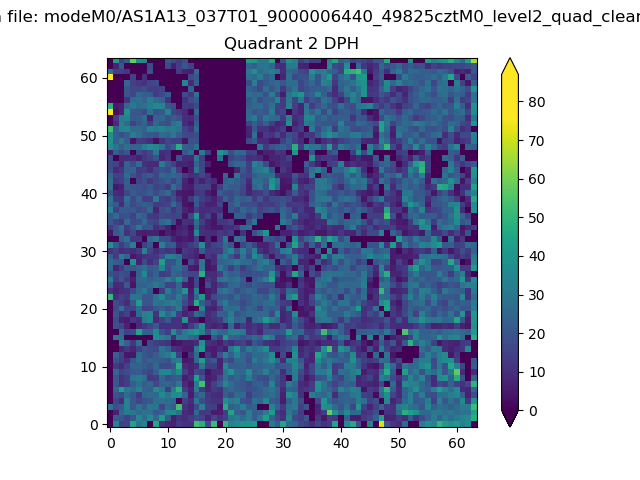
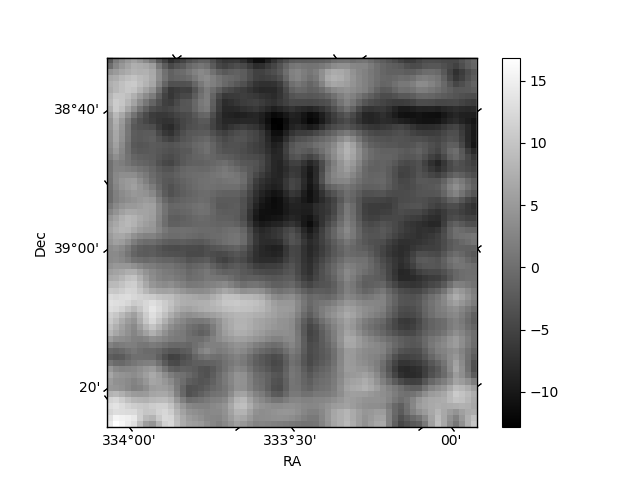
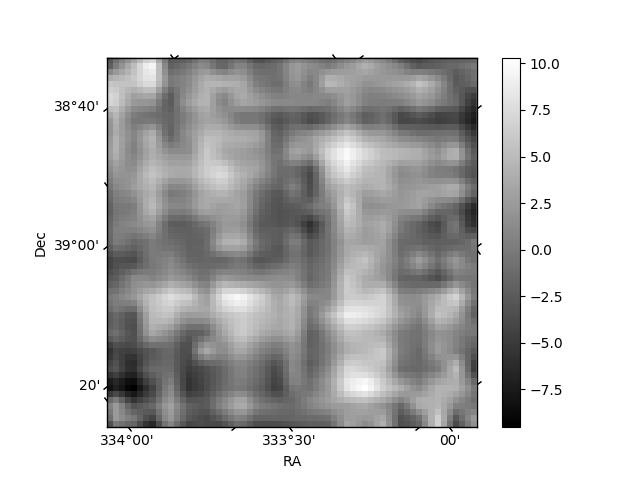
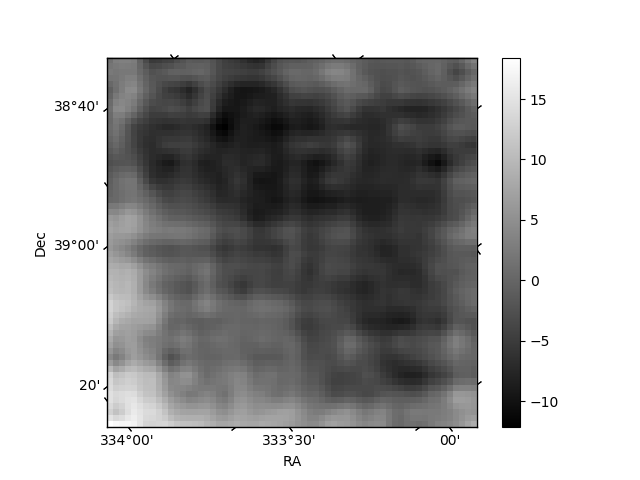
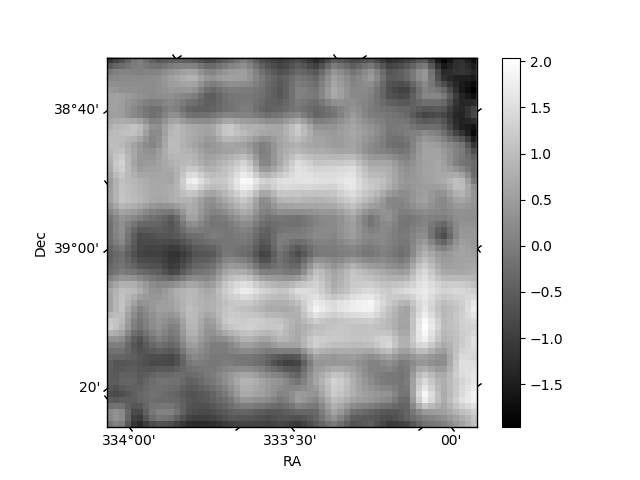
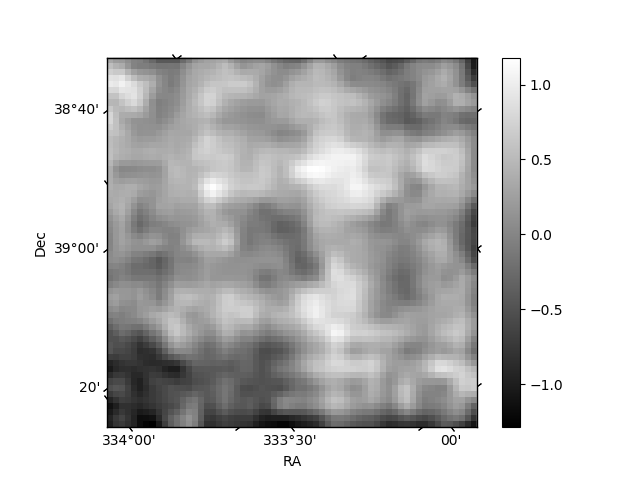
Histogram calculated using DETX and DETY for each event in the final _common_clean file
| Quadrant A | 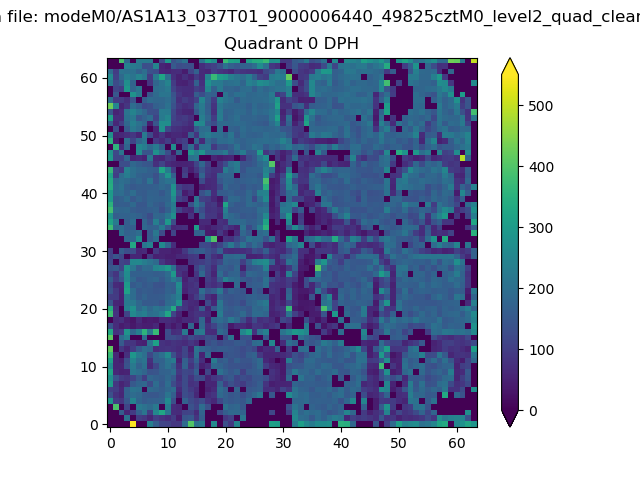 |
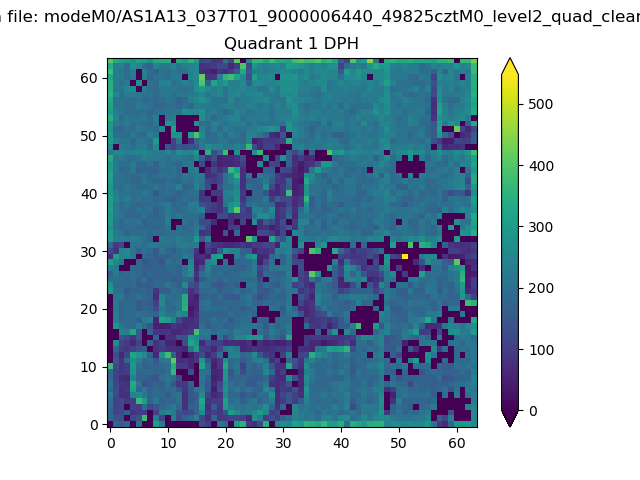 |
Quadrant B |
|---|---|---|---|
| Quadrant D | 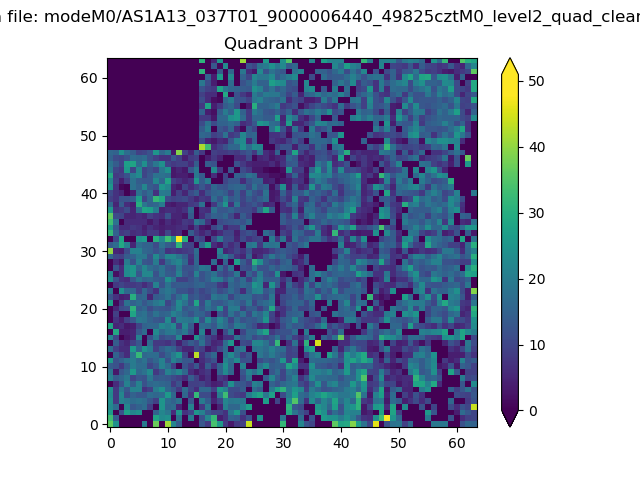 |
 |
Quadrant C |
| Plot type | Count rate plots | Images |
|---|---|---|
| Comparison with Poisson distribution Blue bars denote a histogram of data divided into 1 sec bins. Red curve is a Poisson curve with rate = median count rate of data. |
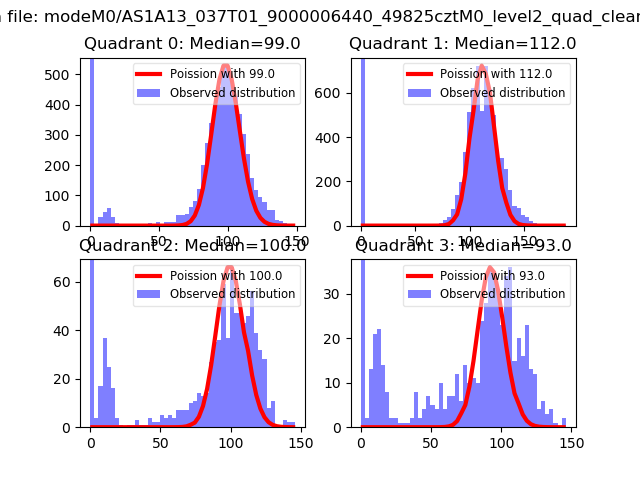 |
 |
| Quadrant-wise count rates Data is divided into 100 sec bins |
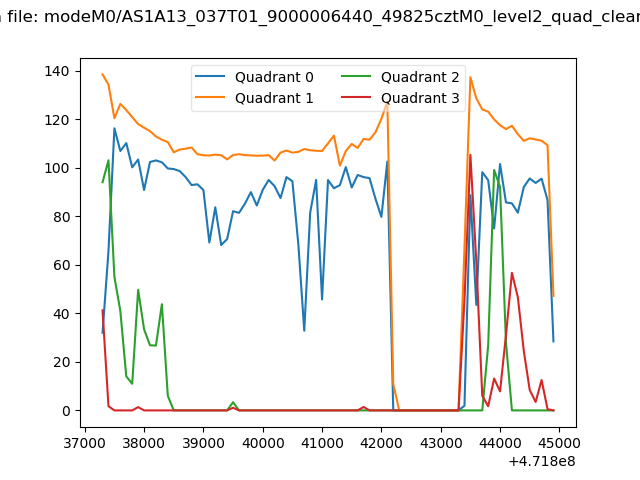 |
|
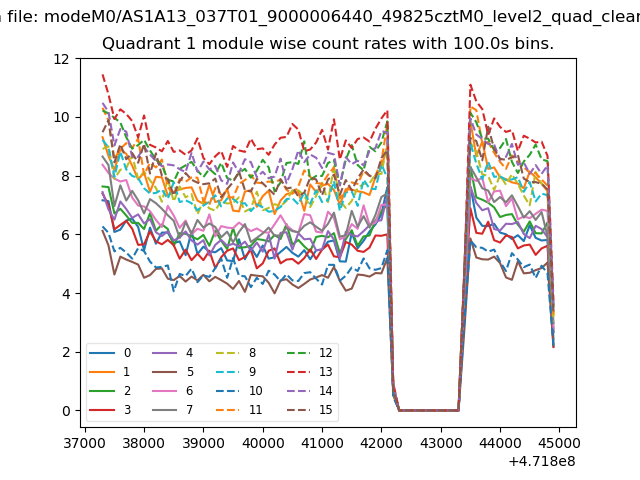
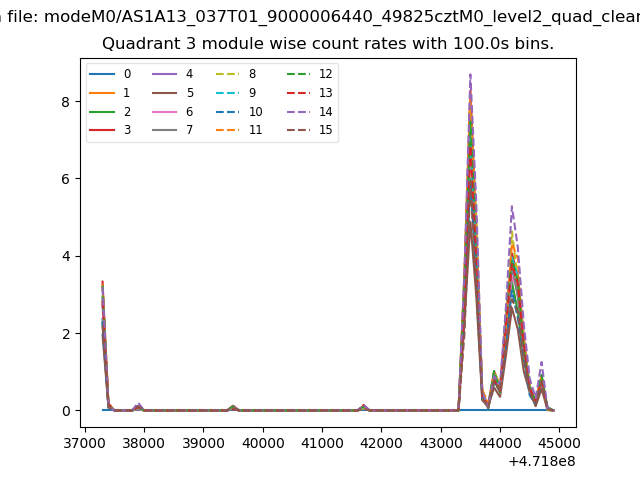
| Module-wise count rates for Quadrant A Data is divided into 100 sec bins |
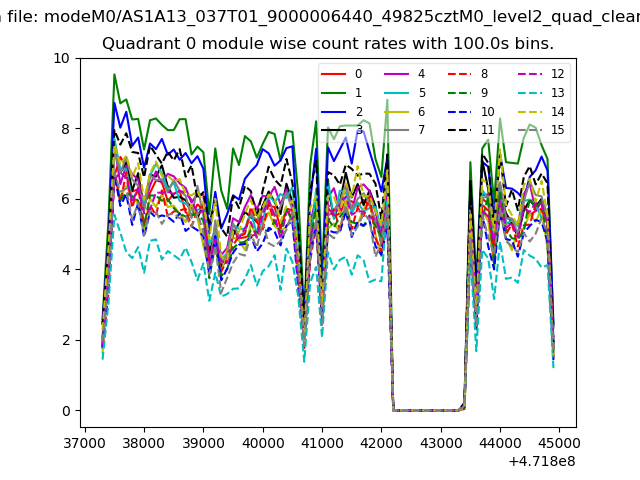 |
 |
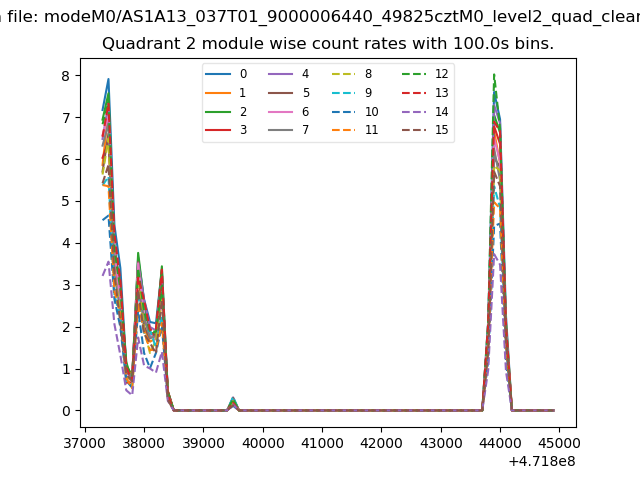
| Module-wise count rates for Quadrant B Data is divided into 100 sec bins |
 |
 |
| Module-wise count rates for Quadrant C Data is divided into 100 sec bins |
 |
 |
| Module-wise count rates for Quadrant D Data is divided into 100 sec bins |
 |
 |
| Parameter | Plot |
|---|---|
| CZT HV Monitor | 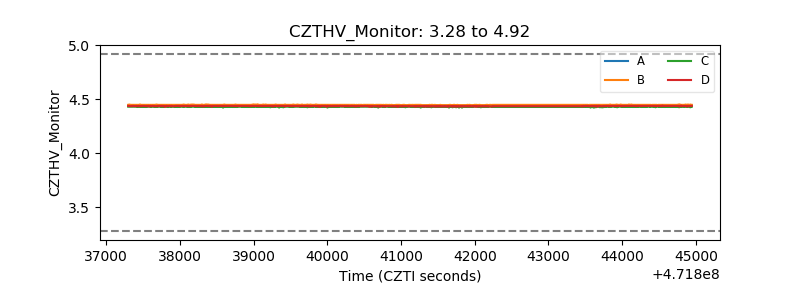 |
| D_VDD | 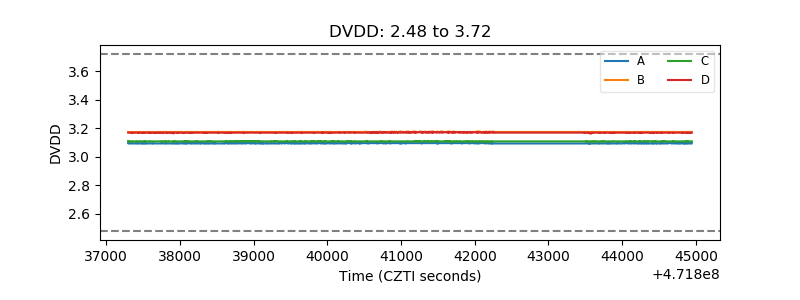 |
| Temperature 1 | 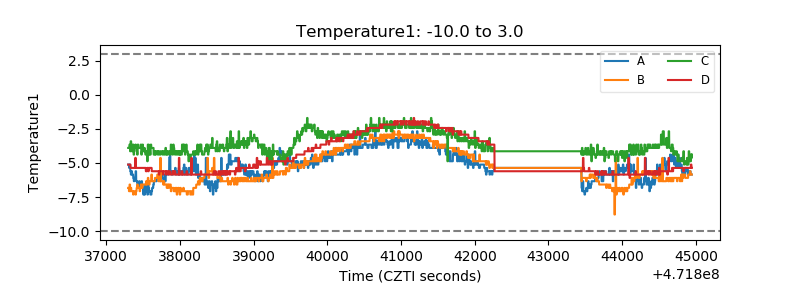 |
| Veto HV Monitor | 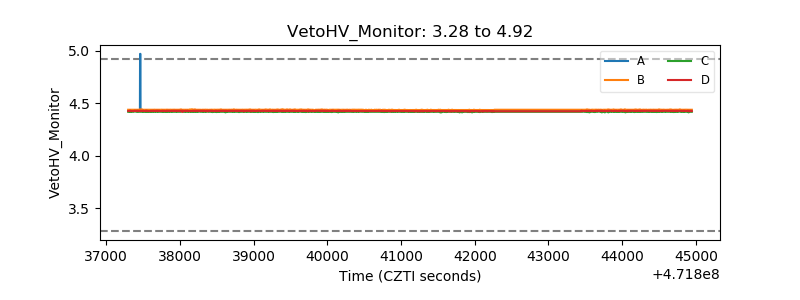 |
| Veto LLD | 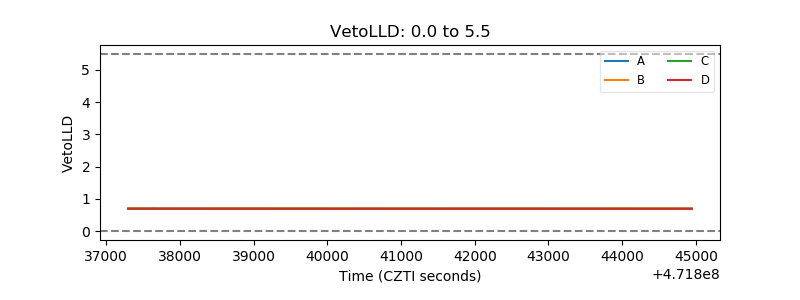 |
| Alpha Counter | 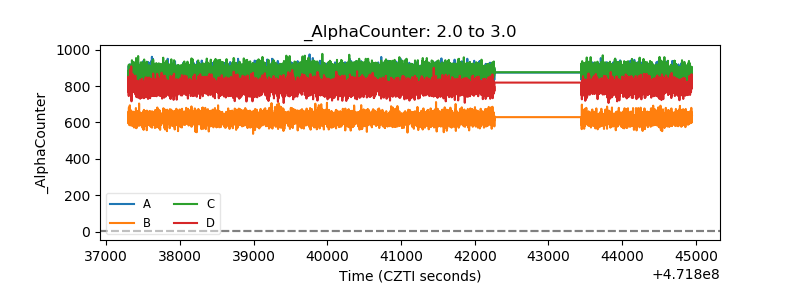 |
| _CPM_Rate | 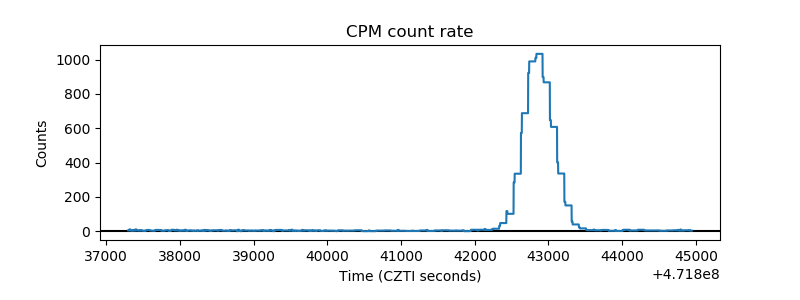 |
| CZT Counter | 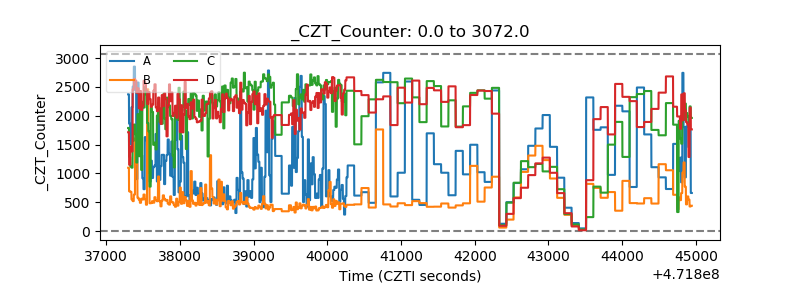 |
| +2.5 Volts monitor | 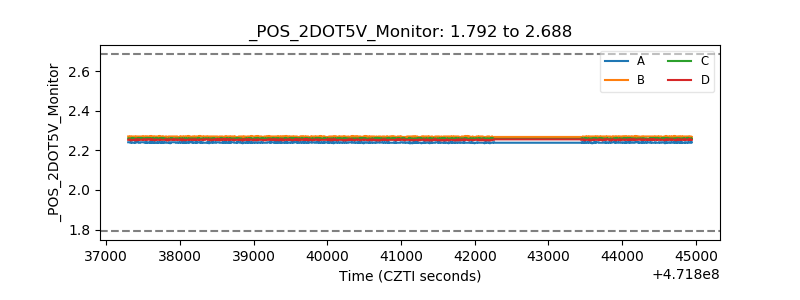 |
| +5 Volts monitor | 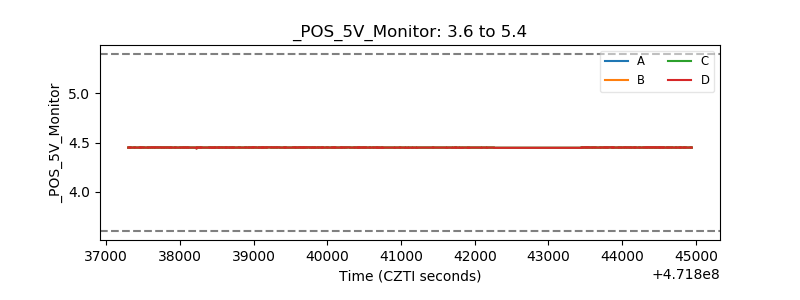 |
| _ROLL_ROT | 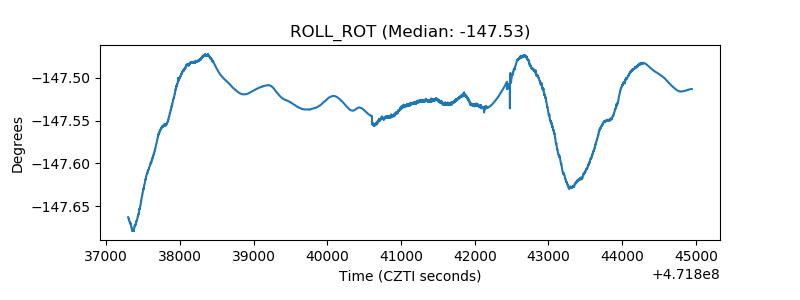 |
| _Roll_DEC | 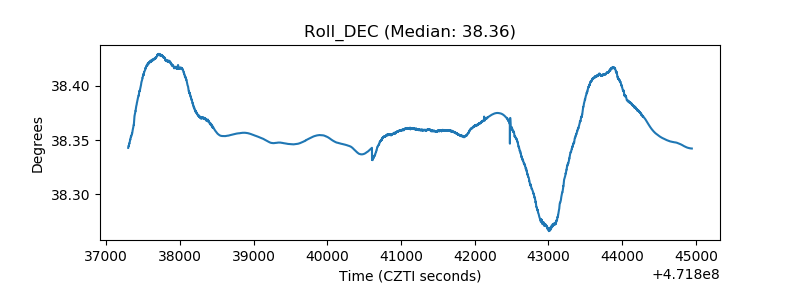 |
| _Roll_RA | 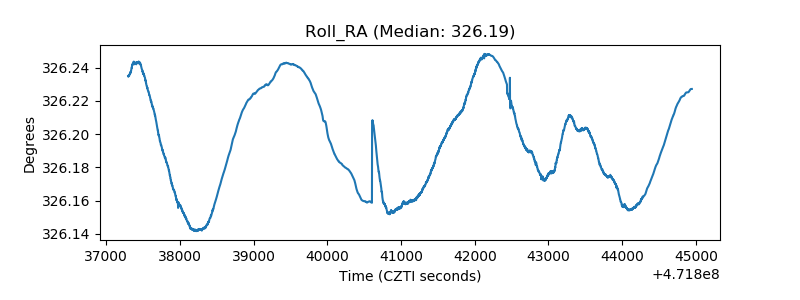 |
| Veto Counter | 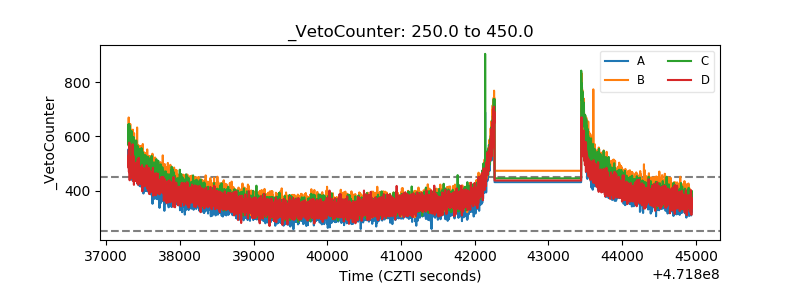 |