| Param | Original file | Final file |
|---|---|---|
| Filename | modeM0/AS1A13_037T01_9000006440_49826cztM0_level2.fits | modeM0/AS1A13_037T01_9000006440_49826cztM0_level2_quad_clean.evt |
| Size (bytes) | 1,214,164,800 | 51,552,000 |
| Size | 1.1 GB | 49.2 MB |
| Events in quadrant A | 13,800,197 | 204,594 |
| Events in quadrant B | 4,213,540 | 687,501 |
| Events in quadrant C | 12,439,390 | 110,951 |
| Events in quadrant D | 14,002,262 | 115,157 |
| Mode M9 | |||
|---|---|---|---|
| Quadrant | BADHDUFLAG | Total packets | Discarded packets |
| A | 0 | 11 | 0 |
| B | 0 | 11 | 0 |
| C | 0 | 11 | 0 |
| D | 0 | 11 | 0 |
| Mode SS | |||
|---|---|---|---|
| Quadrant | BADHDUFLAG | Total packets | Discarded packets |
| A | 0 | 128 | 0 |
| B | 0 | 128 | 0 |
| C | 0 | 128 | 0 |
| D | 0 | 128 | 0 |
| Mode M0 | |||
|---|---|---|---|
| Quadrant | BADHDUFLAG | Total packets | Discarded packets |
| A | 0 | 45353 | 1 |
| B | 0 | 16831 | 1 |
| C | 0 | 41330 | 2 |
| D | 0 | 45916 | 1 |
| Quadrant | Total seconds | Saturated seconds | Saturation percentage |
|---|---|---|---|
| A | 6342 | 4588 | 72.343109% |
| B | 6343 | 287 | 4.524673% |
| C | 6342 | 5361 | 84.531693% |
| D | 6342 | 5368 | 84.642069% |
Noise dominated data is calculated using 1-second bins in cleaned event files. If a bin has >2000 counts, and if more than 50% of those come from <1% of pixels, then it is considered to be noise-dominated and hence unusable.
| Quadrant | # 1 sec bins | Bins with >0 counts | Bins with >2000 counts | High rate bins dominated by noise | Noise dominated (total time) | Noise dominated (detector-on time) | Marked lightcurve |
|---|---|---|---|---|---|---|---|
| A | 7477 | 6343 | 4398 | 4398 | 58.82% | 69.34% | 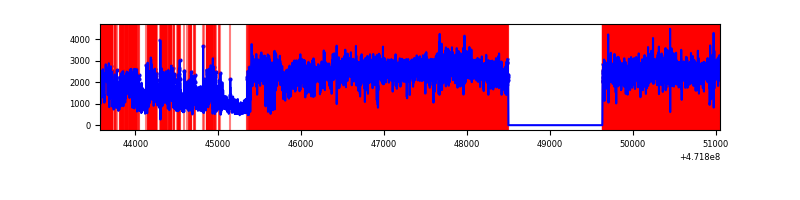 |
| B | 7478 | 6344 | 96 | 96 | 1.28% | 1.51% | 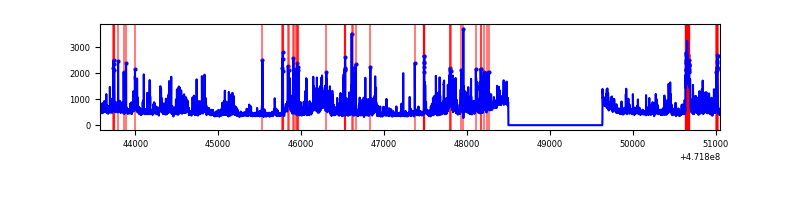 |
| C | 7477 | 6343 | 3087 | 3087 | 41.29% | 48.67% | 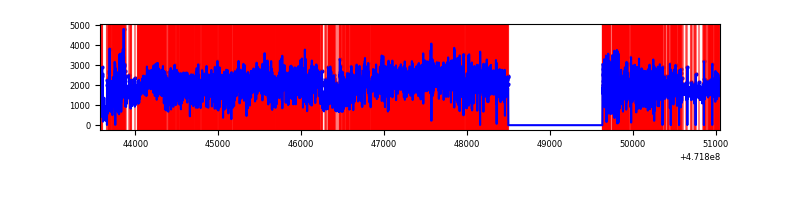 |
| D | 7477 | 6343 | 4335 | 4335 | 57.98% | 68.34% | 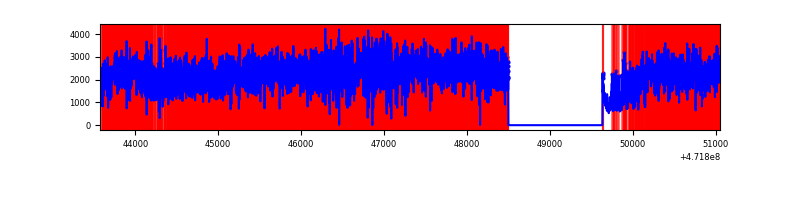 |
Top three noisy pixels from each quadrant. If the there are fewer than three noisy pixels in the level2.evt file, extra rows are filled as -1
| Pixel properties | Quadrant properties | ||||||
|---|---|---|---|---|---|---|---|
| Quadrant | DetID | PixID | Counts | Sigma | Mean | Median | Sigma |
| A | 4 | 4 | 9468965 | 72528.37 | 486 | 473 | 130.5 |
| A | 4 | 13 | 572173 | 4379.21 | 486 | 473 | 130.5 |
| A | 3 | 84 | 194175 | 1483.75 | 486 | 473 | 130.5 |
| B | 10 | 28 | 487823 | 3227.91 | 715 | 692 | 150.9 |
| B | 10 | 44 | 222293 | 1468.41 | 715 | 692 | 150.9 |
| B | 4 | 206 | 199302 | 1316.06 | 715 | 692 | 150.9 |
| C | 15 | 197 | 2775460 | 32703.25 | 280 | 277 | 84.9 |
| C | 15 | 147 | 1961033 | 23105.9 | 280 | 277 | 84.9 |
| C | 15 | 196 | 1119937 | 13194.27 | 280 | 277 | 84.9 |
| D | 7 | 61 | 3948494 | 33270.99 | 378 | 363 | 118.7 |
| D | 7 | 126 | 2068556 | 17428.71 | 378 | 363 | 118.7 |
| D | 15 | 184 | 1962415 | 16534.26 | 378 | 363 | 118.7 |
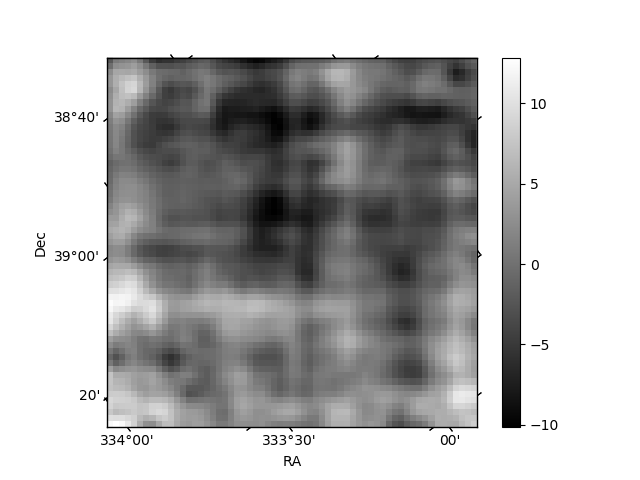
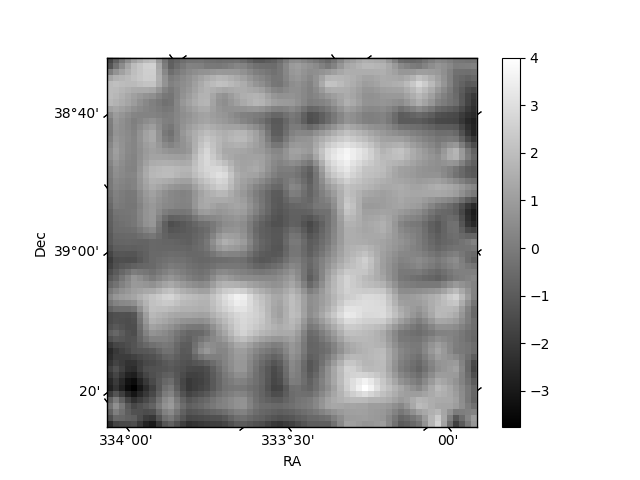
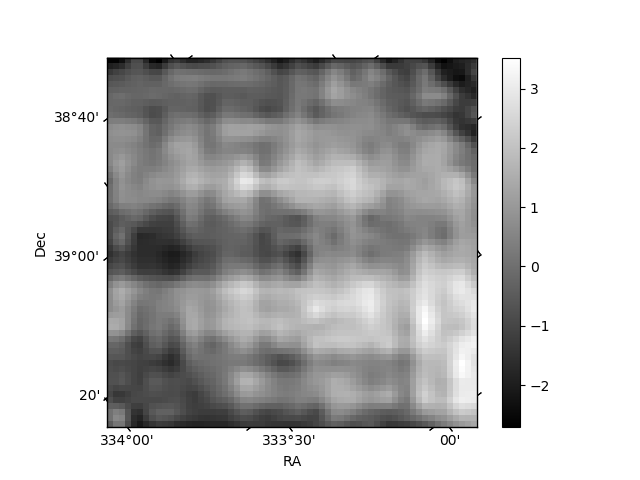
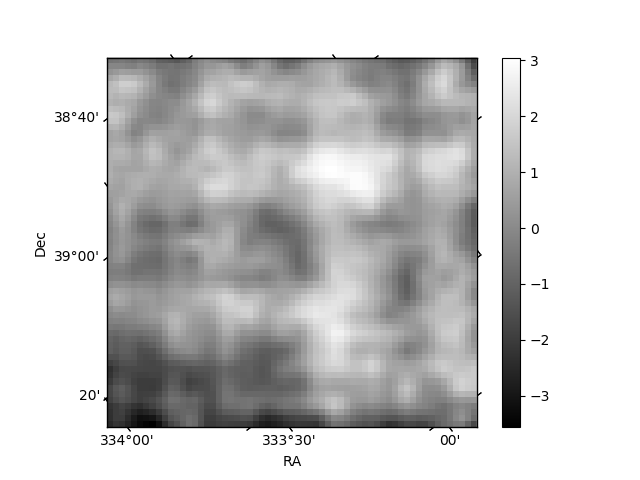
Histogram calculated using DETX and DETY for each event in the final _common_clean file
| Quadrant A | 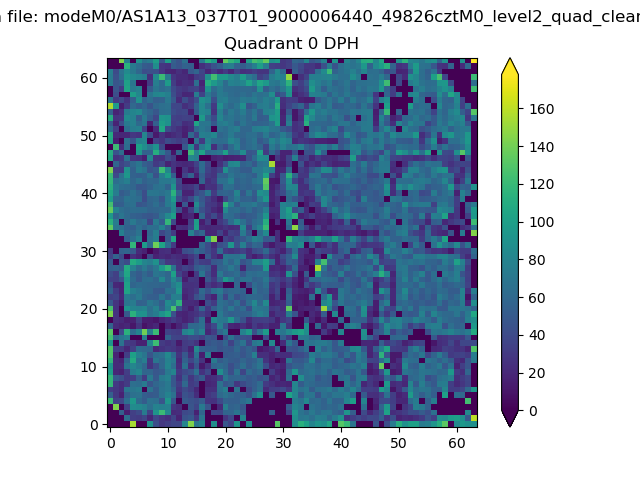 |
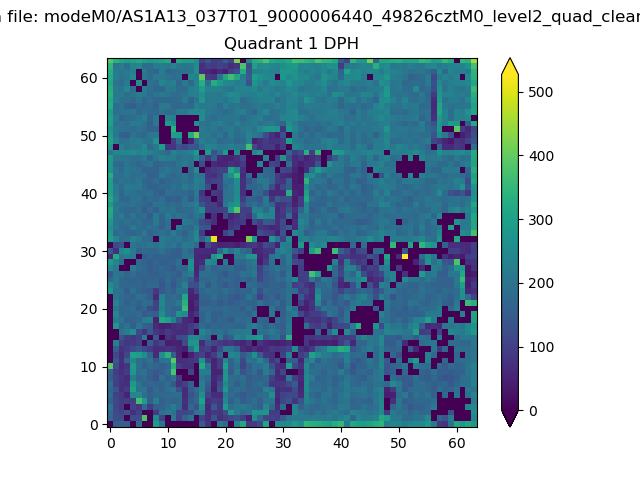 |
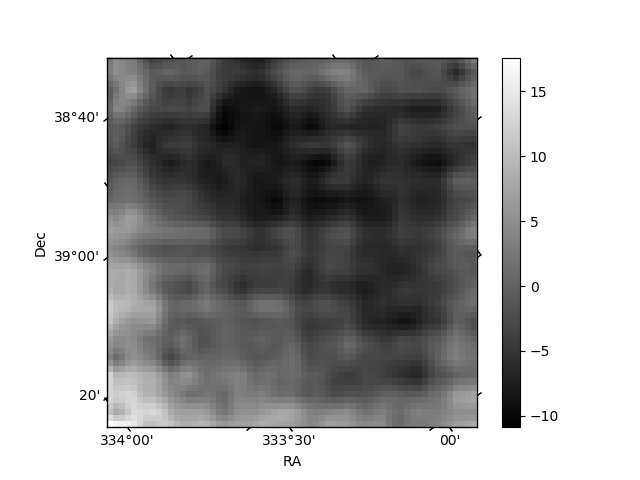
Quadrant B |
|---|---|---|---|
| Quadrant D | 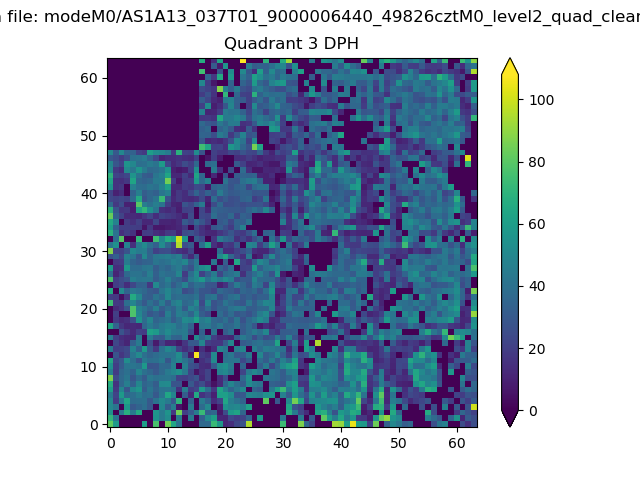 |
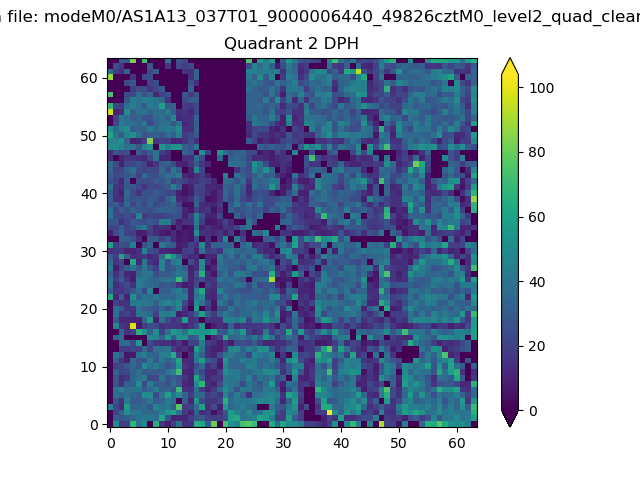 |
Quadrant C |
| Plot type | Count rate plots | Images |
|---|---|---|
| Comparison with Poisson distribution Blue bars denote a histogram of data divided into 1 sec bins. Red curve is a Poisson curve with rate = median count rate of data. |
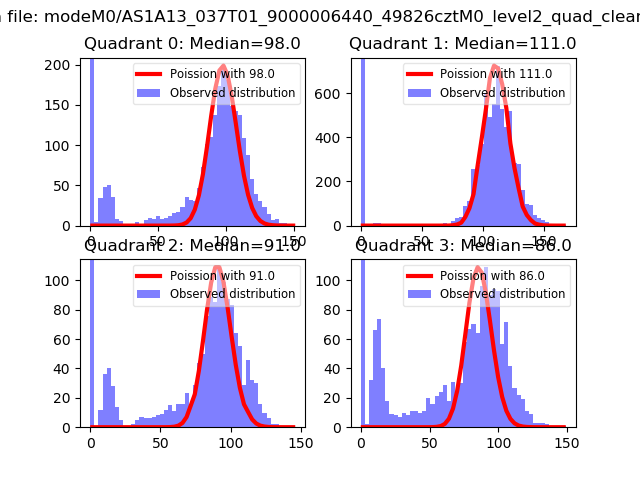 |
 |
| Quadrant-wise count rates Data is divided into 100 sec bins |
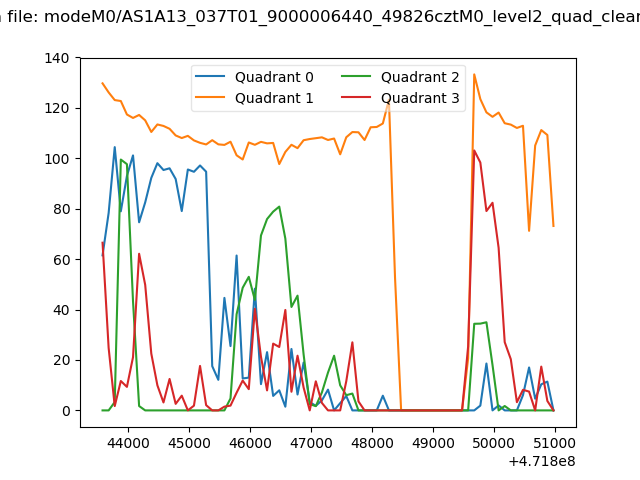 |
|
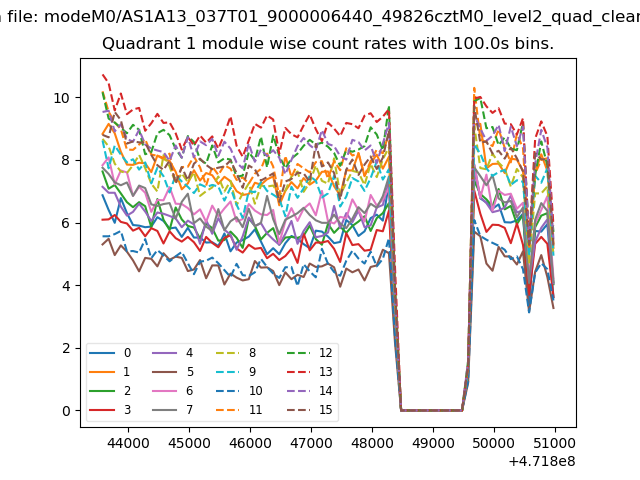
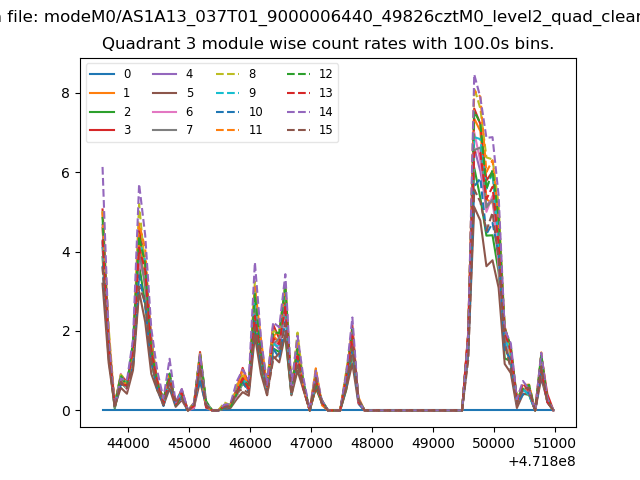
| Module-wise count rates for Quadrant A Data is divided into 100 sec bins |
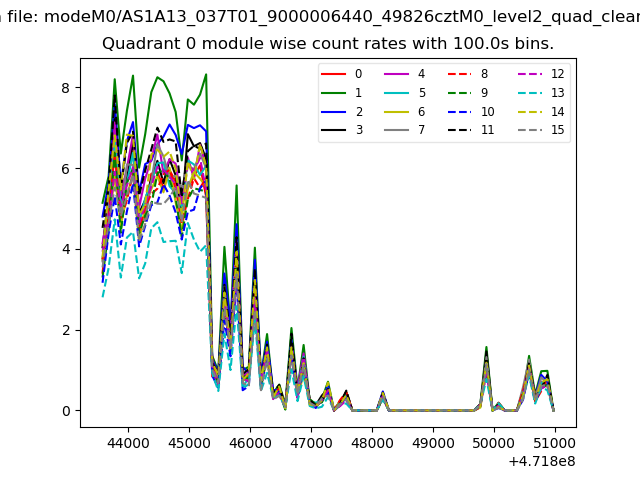 |
 |
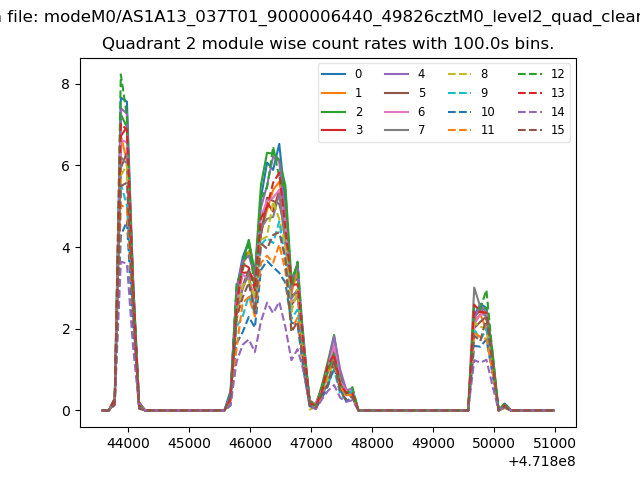
| Module-wise count rates for Quadrant B Data is divided into 100 sec bins |
 |
 |
| Module-wise count rates for Quadrant C Data is divided into 100 sec bins |
 |
 |
| Module-wise count rates for Quadrant D Data is divided into 100 sec bins |
 |
 |
| Parameter | Plot |
|---|---|
| CZT HV Monitor | 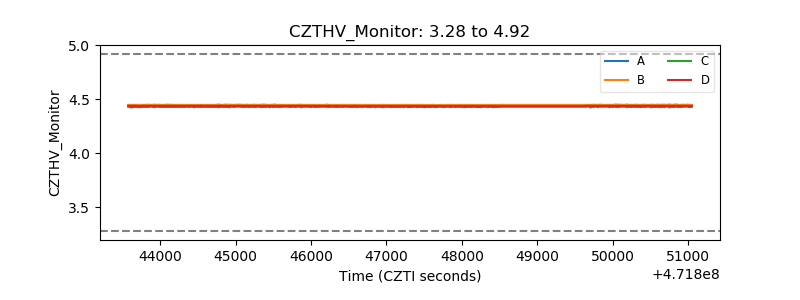 |
| D_VDD | 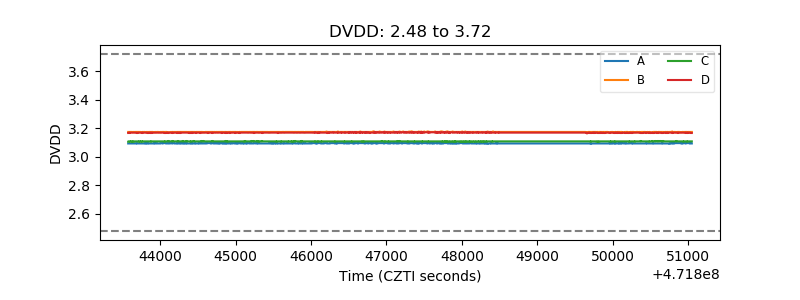 |
| Temperature 1 | 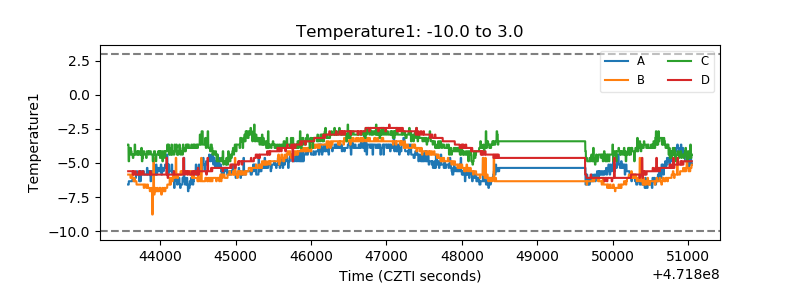 |
| Veto HV Monitor | 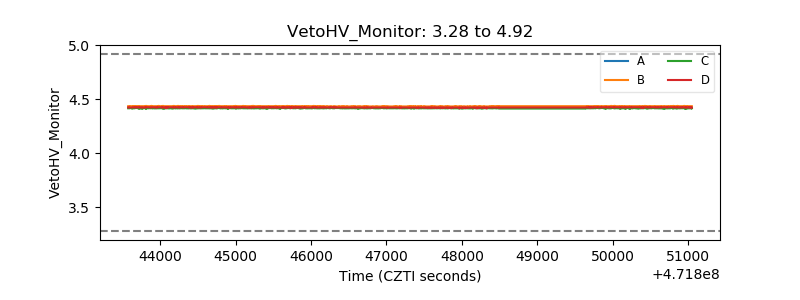 |
| Veto LLD | 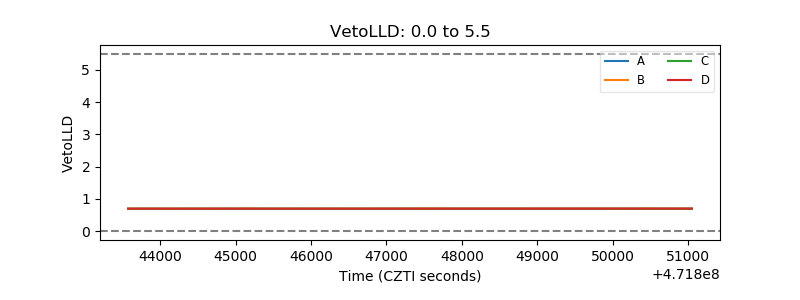 |
| Alpha Counter | 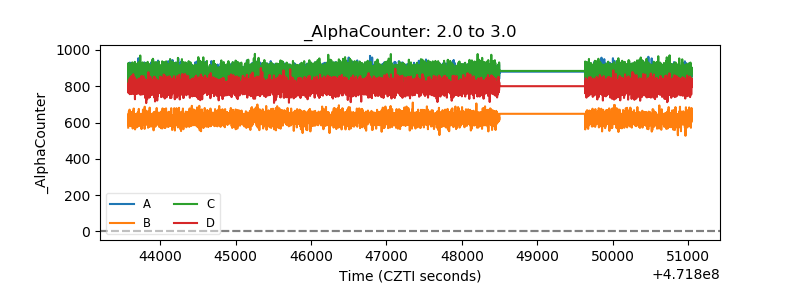 |
| _CPM_Rate | 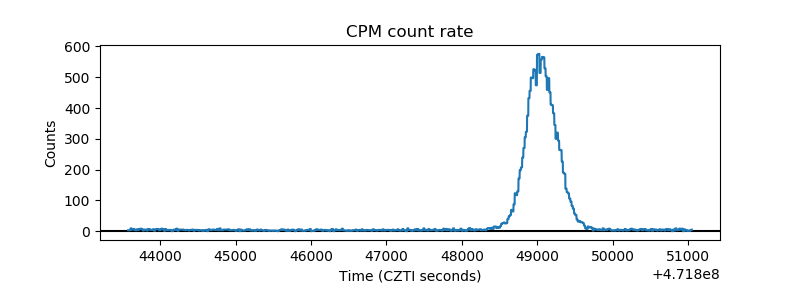 |
| CZT Counter | 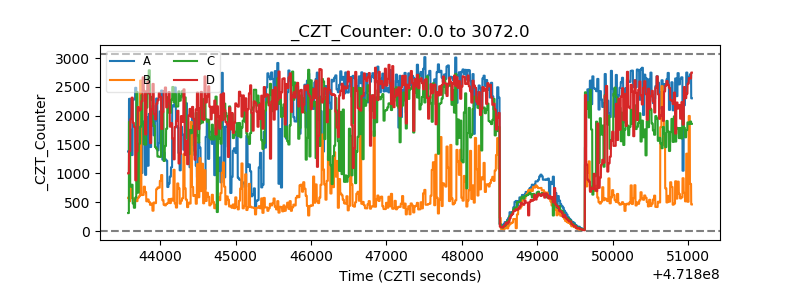 |
| +2.5 Volts monitor | 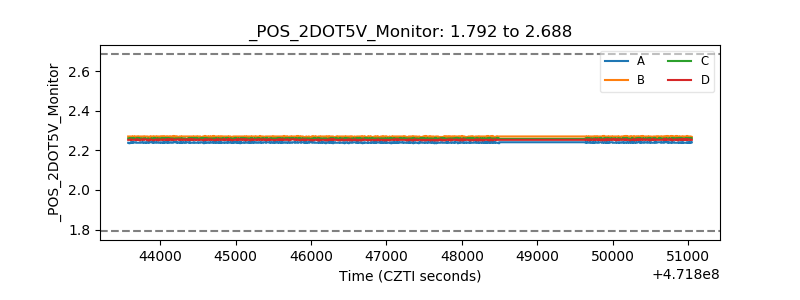 |
| +5 Volts monitor | 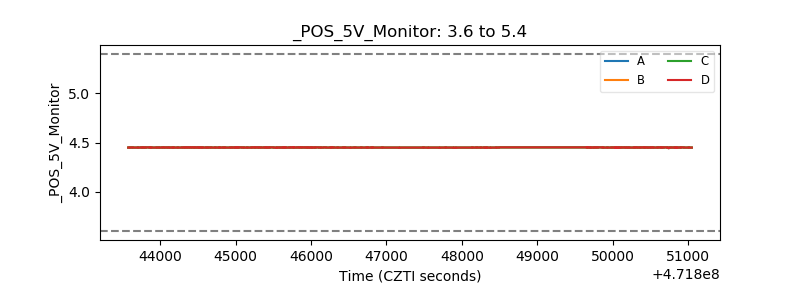 |
| _ROLL_ROT | 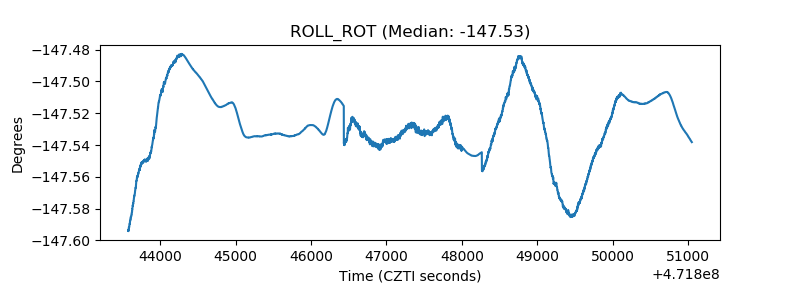 |
| _Roll_DEC | 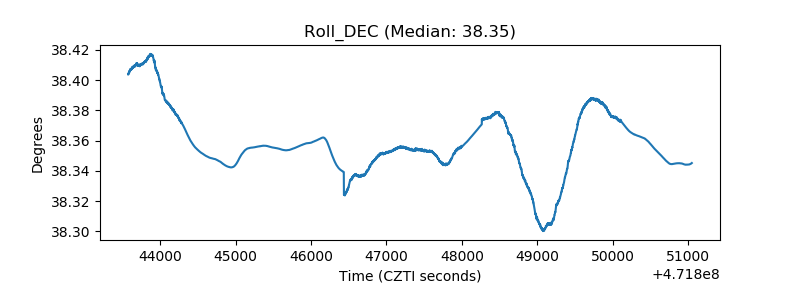 |
| _Roll_RA | 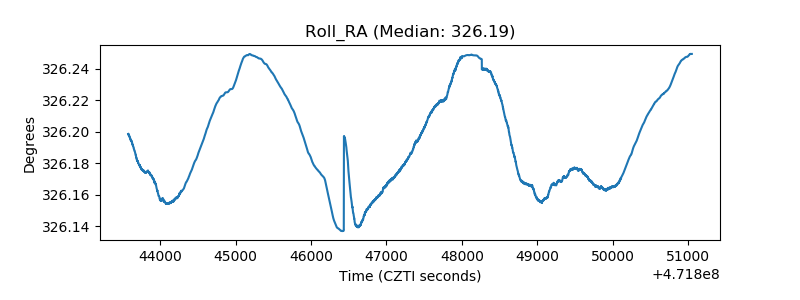 |
| Veto Counter | 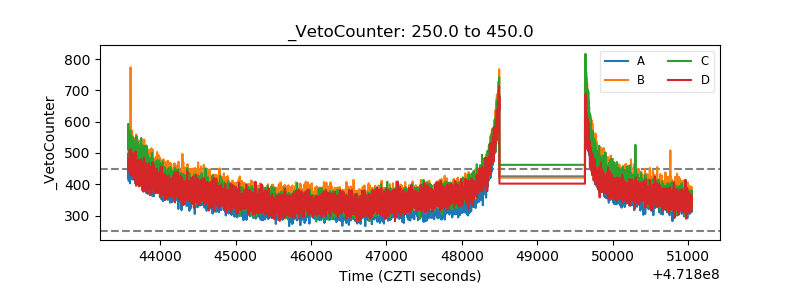 |