| Param | Original file | Final file |
|---|---|---|
| Filename | modeM0/AS1A13_037T01_9000006440_49827cztM0_level2.fits | modeM0/AS1A13_037T01_9000006440_49827cztM0_level2_quad_clean.evt |
| Size (bytes) | 1,174,279,680 | 44,176,320 |
| Size | 1.1 GB | 42.1 MB |
| Events in quadrant A | 13,982,665 | 135,483 |
| Events in quadrant B | 3,877,415 | 631,598 |
| Events in quadrant C | 11,586,193 | 37,580 |
| Events in quadrant D | 13,556,038 | 110,756 |
| Mode M9 | |||
|---|---|---|---|
| Quadrant | BADHDUFLAG | Total packets | Discarded packets |
| A | 0 | 10 | 0 |
| B | 0 | 10 | 0 |
| C | 0 | 10 | 0 |
| D | 0 | 10 | 0 |
| Mode SS | |||
|---|---|---|---|
| Quadrant | BADHDUFLAG | Total packets | Discarded packets |
| A | 0 | 124 | 0 |
| B | 0 | 124 | 0 |
| C | 0 | 124 | 0 |
| D | 0 | 124 | 0 |
| Mode M0 | |||
|---|---|---|---|
| Quadrant | BADHDUFLAG | Total packets | Discarded packets |
| A | 0 | 45634 | 1 |
| B | 0 | 15610 | 1 |
| C | 0 | 38587 | 8 |
| D | 0 | 44392 | 1 |
| Quadrant | Total seconds | Saturated seconds | Saturation percentage |
|---|---|---|---|
| A | 6034 | 4931 | 81.720252% |
| B | 6035 | 242 | 4.009942% |
| C | 6034 | 5729 | 94.945310% |
| D | 6034 | 5031 | 83.377527% |
Noise dominated data is calculated using 1-second bins in cleaned event files. If a bin has >2000 counts, and if more than 50% of those come from <1% of pixels, then it is considered to be noise-dominated and hence unusable.
| Quadrant | # 1 sec bins | Bins with >0 counts | Bins with >2000 counts | High rate bins dominated by noise | Noise dominated (total time) | Noise dominated (detector-on time) | Marked lightcurve |
|---|---|---|---|---|---|---|---|
| A | 7049 | 6036 | 4421 | 4421 | 62.72% | 73.24% | 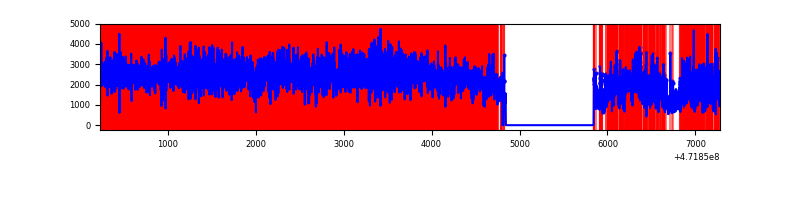 |
| B | 7050 | 6037 | 93 | 93 | 1.32% | 1.54% | 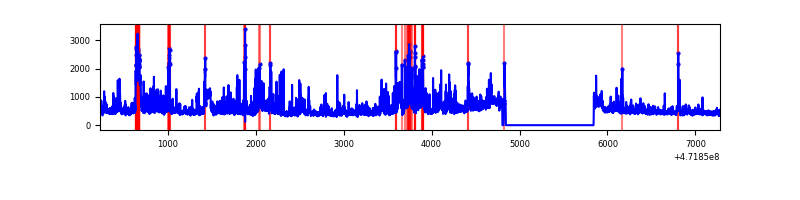 |
| C | 7049 | 6035 | 3062 | 3062 | 43.44% | 50.74% | 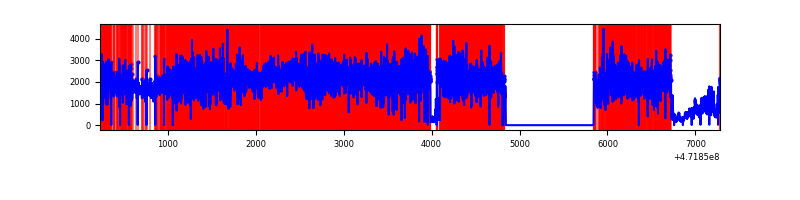 |
| D | 7049 | 6036 | 4398 | 4398 | 62.39% | 72.86% | 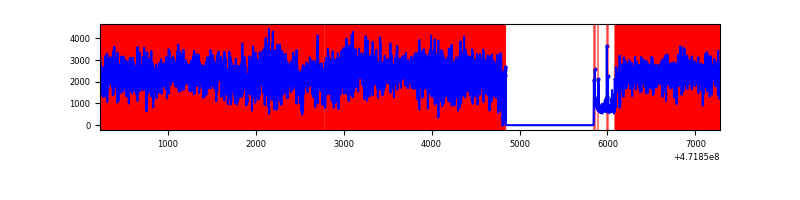 |
Top three noisy pixels from each quadrant. If the there are fewer than three noisy pixels in the level2.evt file, extra rows are filled as -1
| Pixel properties | Quadrant properties | ||||||
|---|---|---|---|---|---|---|---|
| Quadrant | DetID | PixID | Counts | Sigma | Mean | Median | Sigma |
| A | 4 | 4 | 9006995 | 82170.56 | 424 | 413 | 109.6 |
| A | 3 | 130 | 1065841 | 9720.32 | 424 | 413 | 109.6 |
| A | 3 | 84 | 538243 | 4906.83 | 424 | 413 | 109.6 |
| B | 10 | 28 | 413769 | 2899.68 | 665 | 644 | 142.5 |
| B | 5 | 49 | 233933 | 1637.43 | 665 | 644 | 142.5 |
| B | 0 | 229 | 227794 | 1594.34 | 665 | 644 | 142.5 |
| C | 15 | 197 | 3238100 | 38387.17 | 207 | 201 | 84.3 |
| C | 15 | 147 | 1513410 | 17939.97 | 207 | 201 | 84.3 |
| C | 1 | 44 | 1298288 | 15389.57 | 207 | 201 | 84.3 |
| D | 7 | 61 | 4139165 | 37557.92 | 372 | 359 | 110.2 |
| D | 7 | 126 | 2289376 | 20771.87 | 372 | 359 | 110.2 |
| D | 14 | 66 | 886800 | 8044.08 | 372 | 359 | 110.2 |
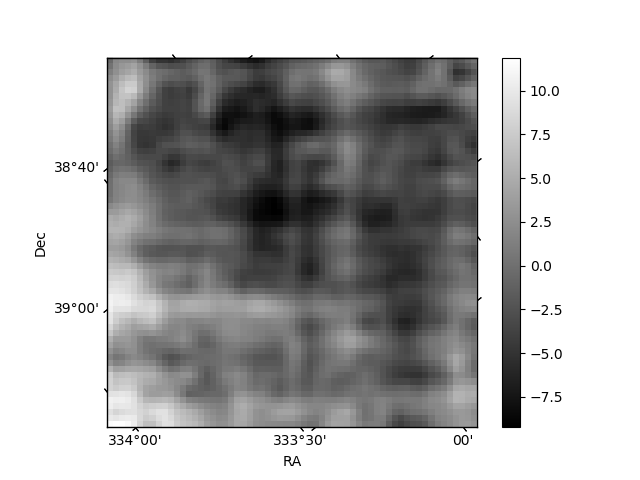
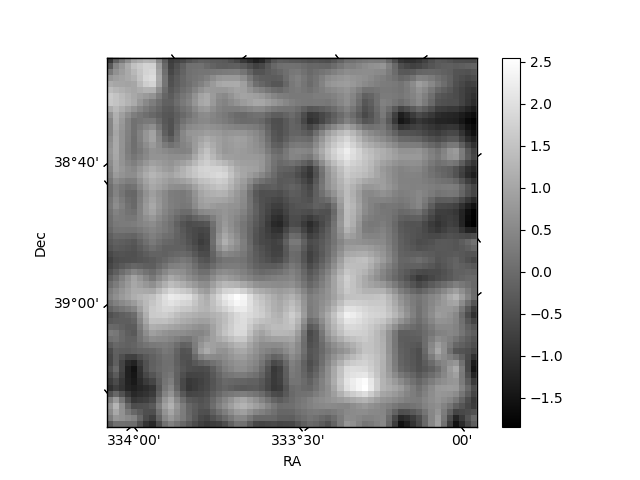
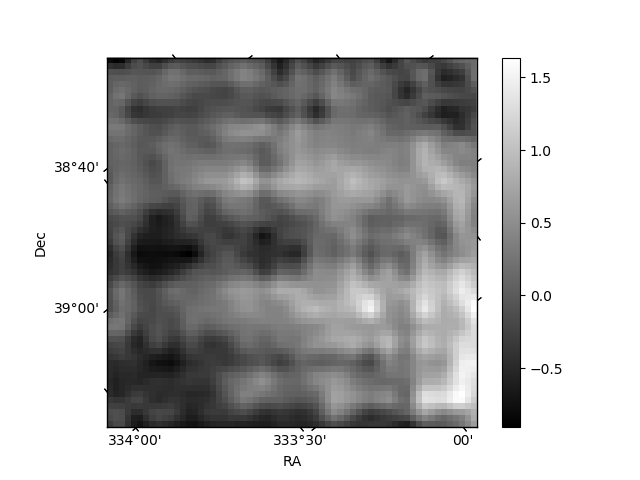
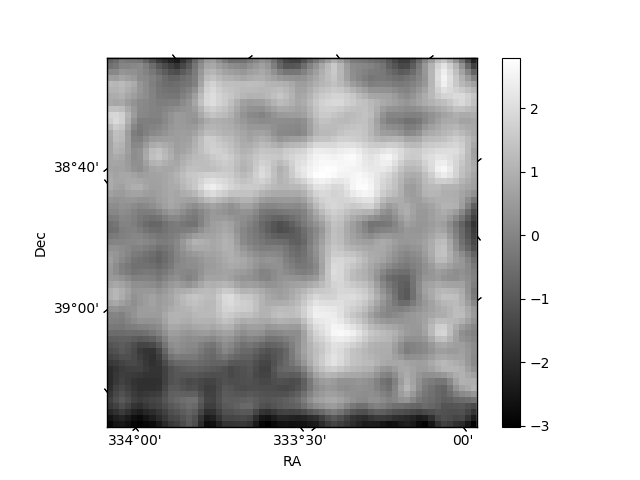
Histogram calculated using DETX and DETY for each event in the final _common_clean file
| Quadrant A | 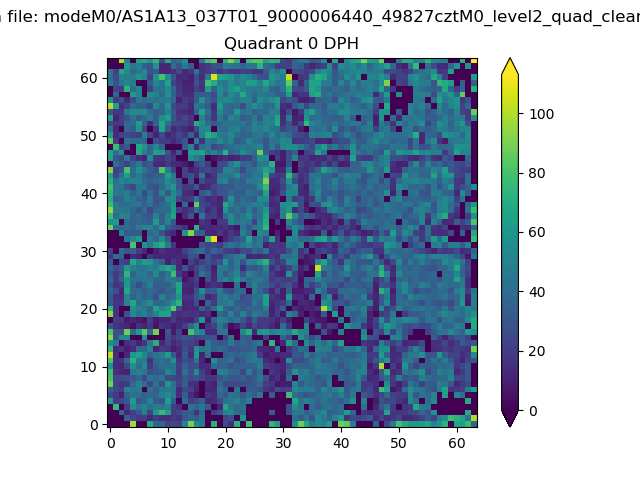 |
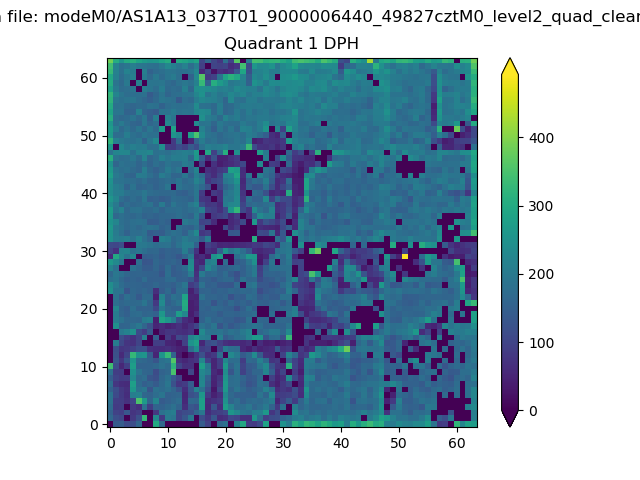 |
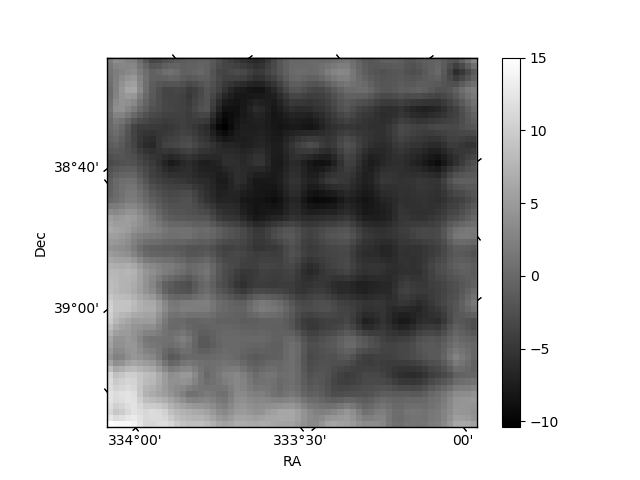
Quadrant B |
|---|---|---|---|
| Quadrant D | 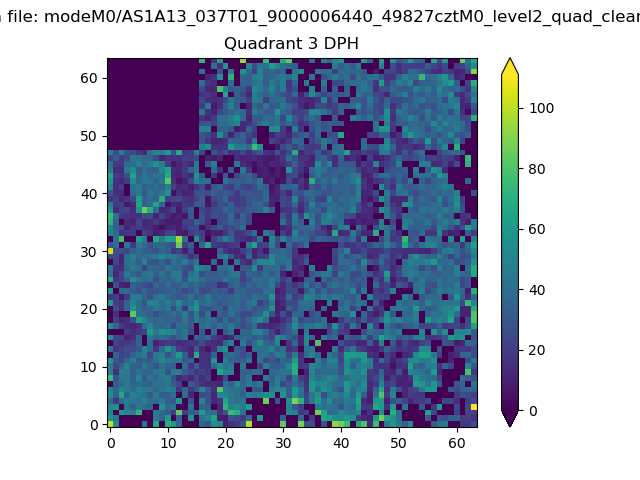 |
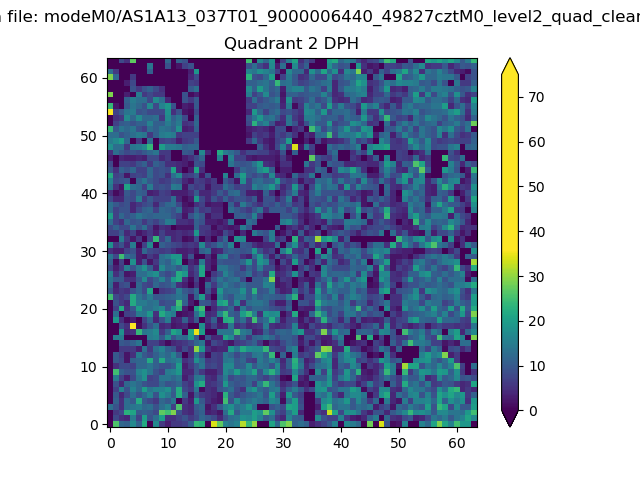 |
Quadrant C |
| Plot type | Count rate plots | Images |
|---|---|---|
| Comparison with Poisson distribution Blue bars denote a histogram of data divided into 1 sec bins. Red curve is a Poisson curve with rate = median count rate of data. |
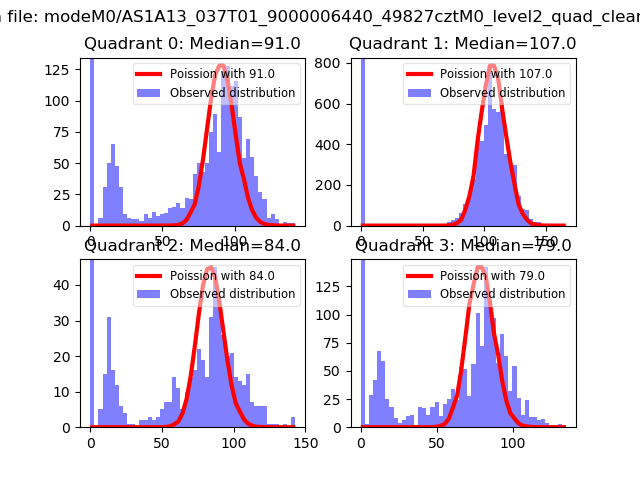 |
 |
| Quadrant-wise count rates Data is divided into 100 sec bins |
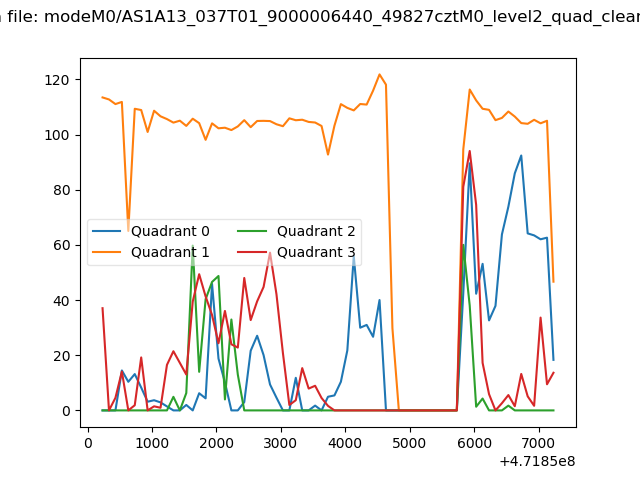 |
|
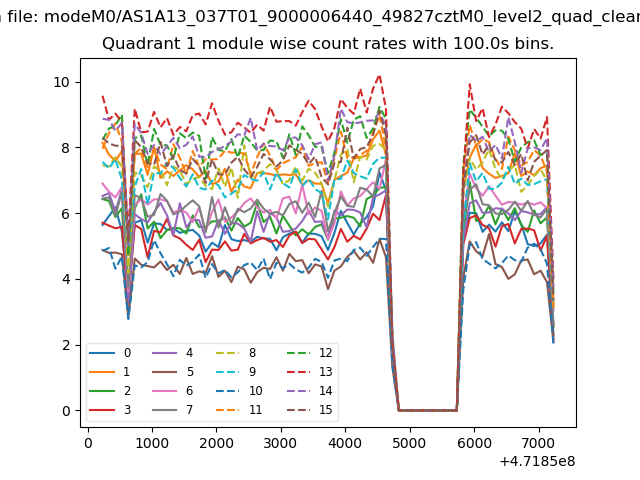
| Module-wise count rates for Quadrant A Data is divided into 100 sec bins |
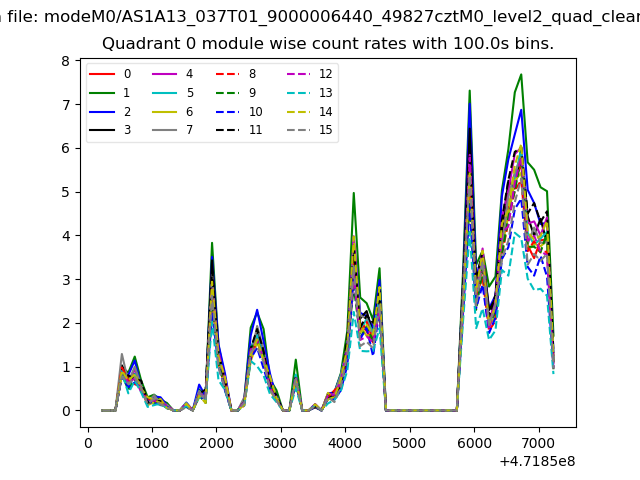 |
 |
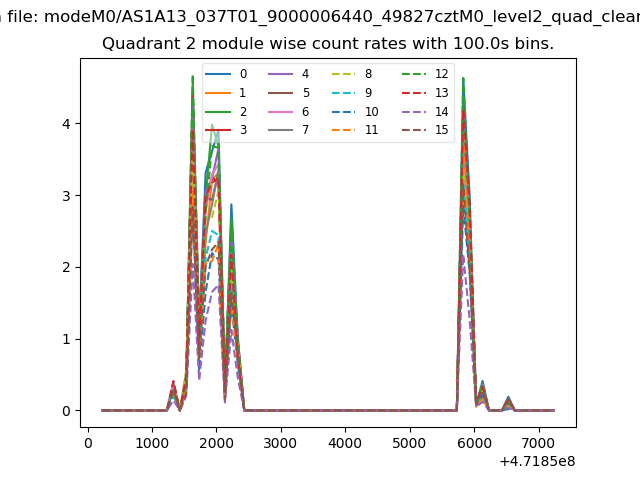
| Module-wise count rates for Quadrant B Data is divided into 100 sec bins |
 |
 |
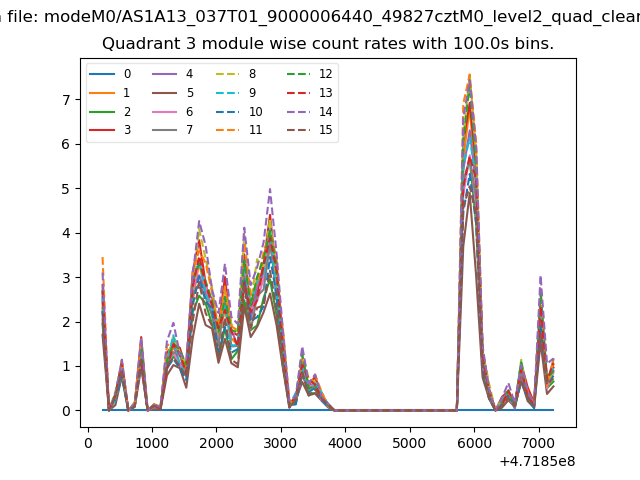
| Module-wise count rates for Quadrant C Data is divided into 100 sec bins |
 |
 |
| Module-wise count rates for Quadrant D Data is divided into 100 sec bins |
 |
 |
| Parameter | Plot |
|---|---|
| CZT HV Monitor | 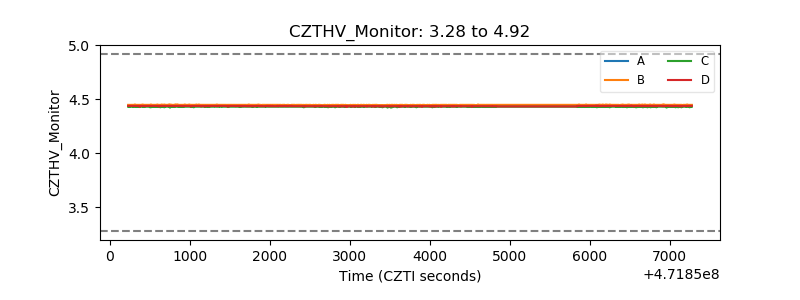 |
| D_VDD |  |
| Temperature 1 | 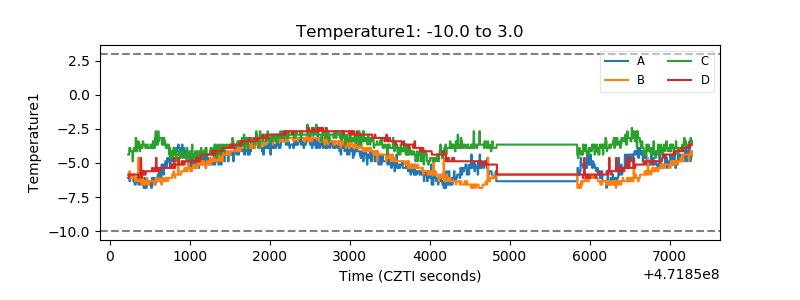 |
| Veto HV Monitor | 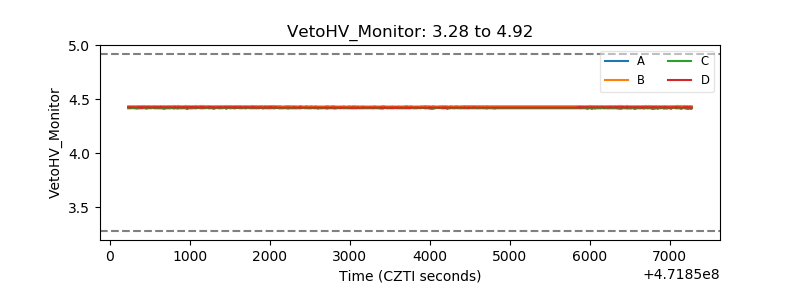 |
| Veto LLD | 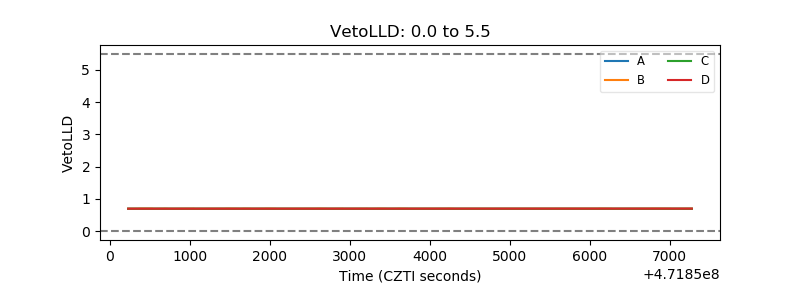 |
| Alpha Counter | 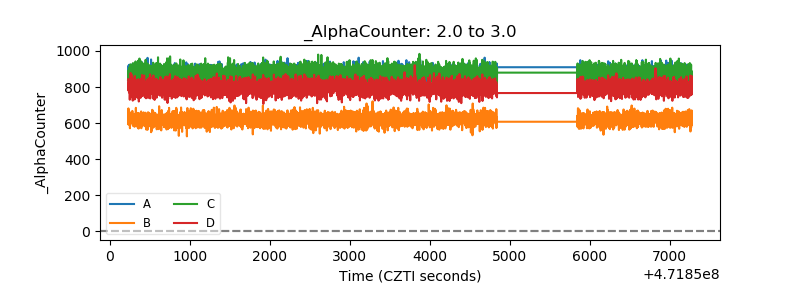 |
| _CPM_Rate | 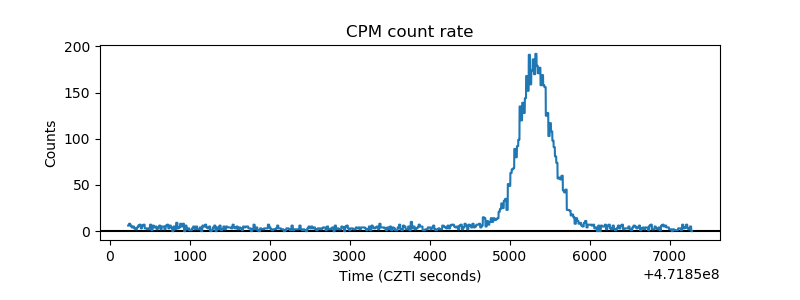 |
| CZT Counter | 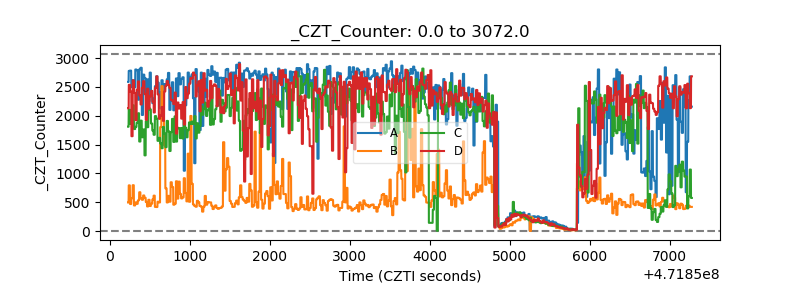 |
| +2.5 Volts monitor | 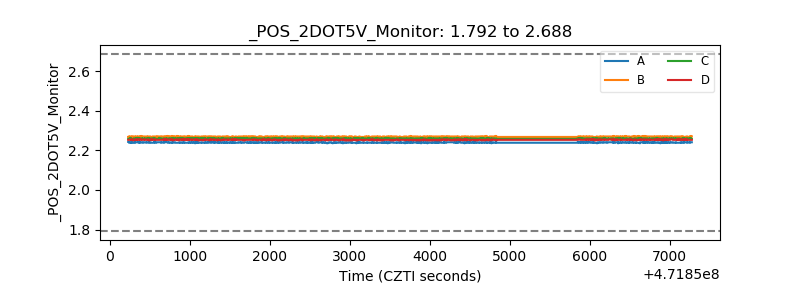 |
| +5 Volts monitor | 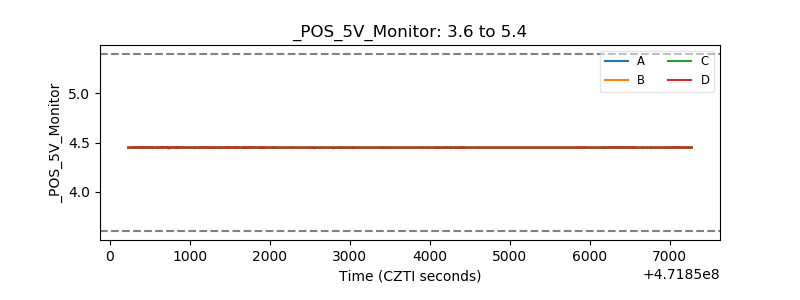 |
| _ROLL_ROT | 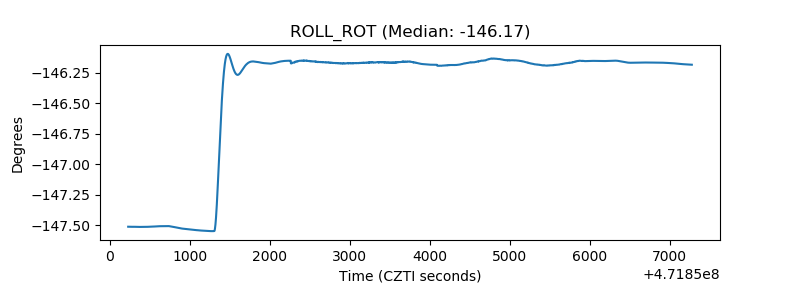 |
| _Roll_DEC | 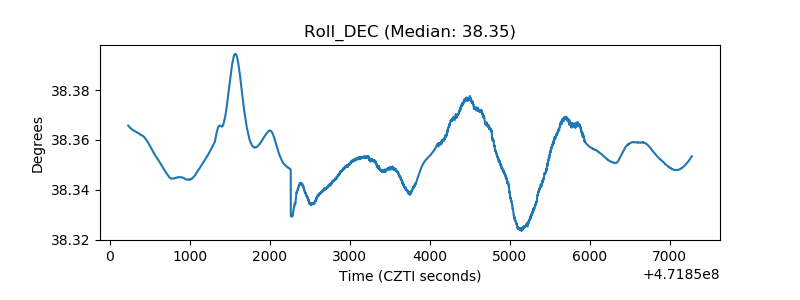 |
| _Roll_RA | 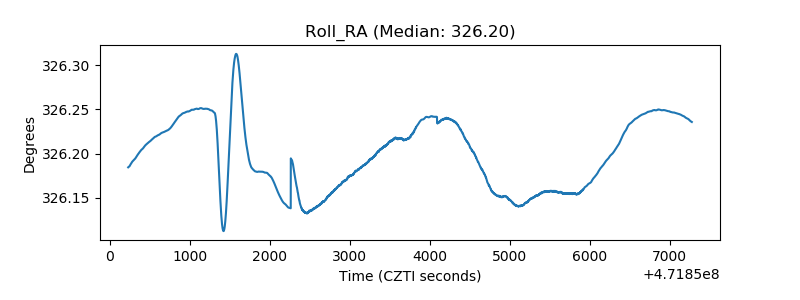 |
| Veto Counter | 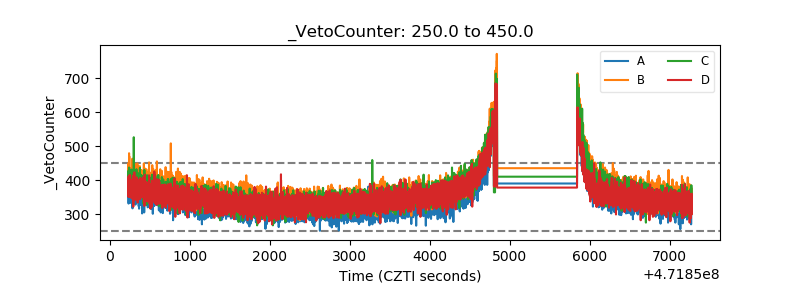 |