| Param | Original file | Final file |
|---|---|---|
| Filename | modeM0/AS1A13_037T01_9000006440_49828cztM0_level2.fits | modeM0/AS1A13_037T01_9000006440_49828cztM0_level2_quad_clean.evt |
| Size (bytes) | 1,370,188,800 | 48,651,840 |
| Size | 1.3 GB | 46.4 MB |
| Events in quadrant A | 16,248,099 | 151,816 |
| Events in quadrant B | 4,261,423 | 709,552 |
| Events in quadrant C | 13,722,928 | 24,925 |
| Events in quadrant D | 15,949,422 | 100,222 |
| Mode M9 | |||
|---|---|---|---|
| Quadrant | BADHDUFLAG | Total packets | Discarded packets |
| A | 0 | 7 | 0 |
| B | 0 | 7 | 0 |
| C | 0 | 7 | 0 |
| D | 0 | 7 | 0 |
| Mode SS | |||
|---|---|---|---|
| Quadrant | BADHDUFLAG | Total packets | Discarded packets |
| A | 0 | 142 | 0 |
| B | 0 | 142 | 0 |
| C | 0 | 142 | 0 |
| D | 0 | 142 | 0 |
| Mode M0 | |||
|---|---|---|---|
| Quadrant | BADHDUFLAG | Total packets | Discarded packets |
| A | 0 | 53029 | 1 |
| B | 0 | 17498 | 1 |
| C | 0 | 45556 | 1 |
| D | 0 | 52154 | 2 |
| Quadrant | Total seconds | Saturated seconds | Saturation percentage |
|---|---|---|---|
| A | 6979 | 5645 | 80.885514% |
| B | 6979 | 302 | 4.327268% |
| C | 6979 | 6767 | 96.962316% |
| D | 6978 | 6036 | 86.500430% |
Noise dominated data is calculated using 1-second bins in cleaned event files. If a bin has >2000 counts, and if more than 50% of those come from <1% of pixels, then it is considered to be noise-dominated and hence unusable.
| Quadrant | # 1 sec bins | Bins with >0 counts | Bins with >2000 counts | High rate bins dominated by noise | Noise dominated (total time) | Noise dominated (detector-on time) | Marked lightcurve |
|---|---|---|---|---|---|---|---|
| A | 7674 | 6979 | 4835 | 4835 | 63.00% | 69.28% | 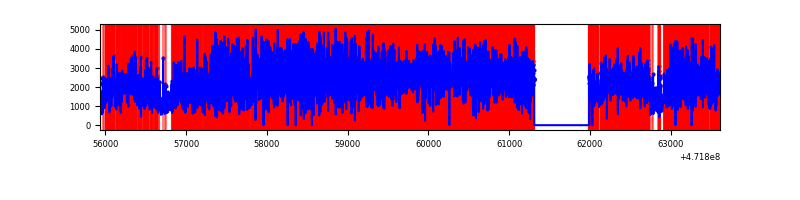 |
| B | 7674 | 6981 | 133 | 133 | 1.73% | 1.91% | 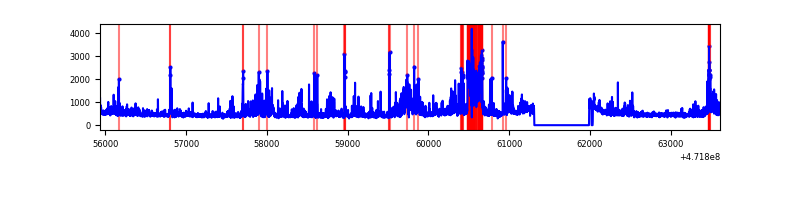 |
| C | 7674 | 6980 | 3668 | 3668 | 47.80% | 52.55% | 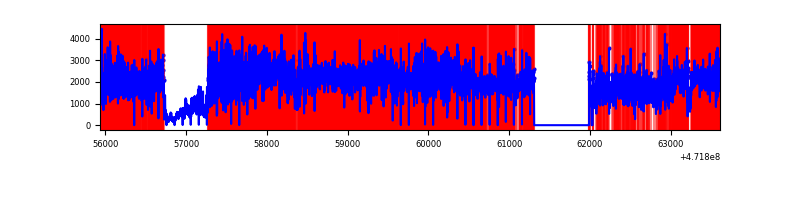 |
| D | 7673 | 6980 | 5087 | 5087 | 66.30% | 72.88% |  |
Top three noisy pixels from each quadrant. If the there are fewer than three noisy pixels in the level2.evt file, extra rows are filled as -1
| Pixel properties | Quadrant properties | ||||||
|---|---|---|---|---|---|---|---|
| Quadrant | DetID | PixID | Counts | Sigma | Mean | Median | Sigma |
| A | 3 | 84 | 6300091 | 59830.74 | 402 | 392 | 105.3 |
| A | 4 | 4 | 5712361 | 54248.83 | 402 | 392 | 105.3 |
| A | 3 | 130 | 447360 | 4245.03 | 402 | 392 | 105.3 |
| B | 4 | 171 | 294213 | 1840.74 | 753 | 728 | 159.4 |
| B | 0 | 229 | 292539 | 1830.24 | 753 | 728 | 159.4 |
| B | 4 | 206 | 216876 | 1355.68 | 753 | 728 | 159.4 |
| C | 15 | 197 | 4543434 | 60004.41 | 244 | 241 | 75.7 |
| C | 1 | 44 | 2039926 | 26939.23 | 244 | 241 | 75.7 |
| C | 15 | 147 | 1714606 | 22642.55 | 244 | 241 | 75.7 |
| D | 7 | 61 | 4399499 | 39488.96 | 369 | 355 | 111.4 |
| D | 8 | 48 | 2428030 | 21792.05 | 369 | 355 | 111.4 |
| D | 7 | 126 | 1474652 | 13234.04 | 369 | 355 | 111.4 |
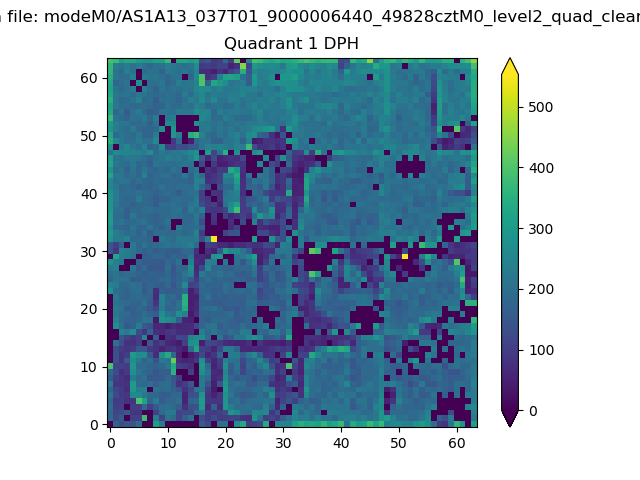
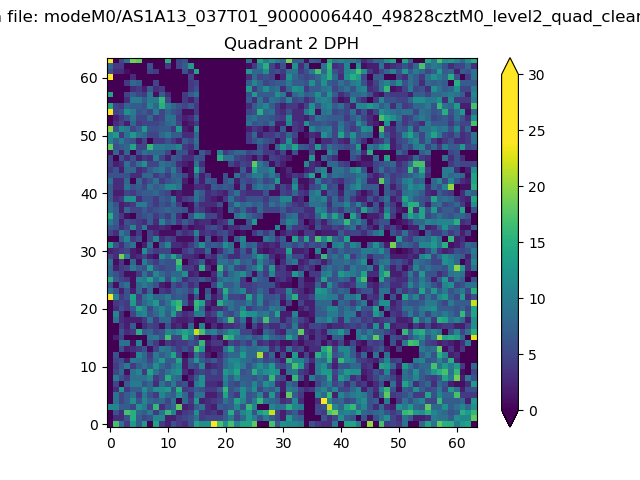
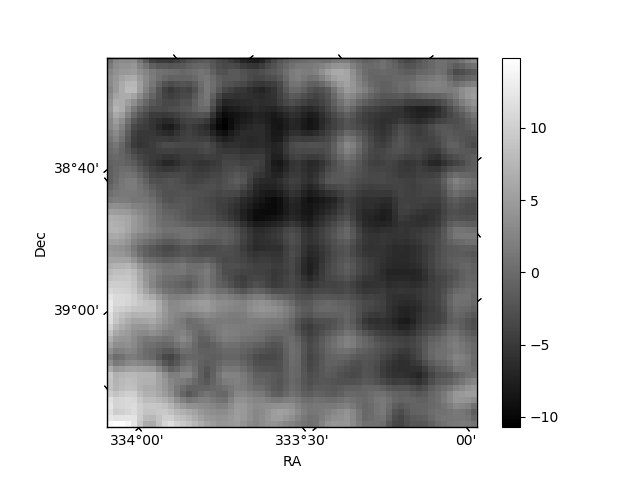
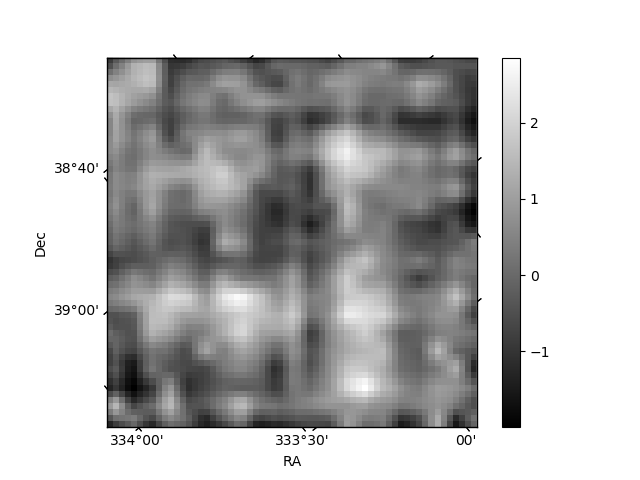
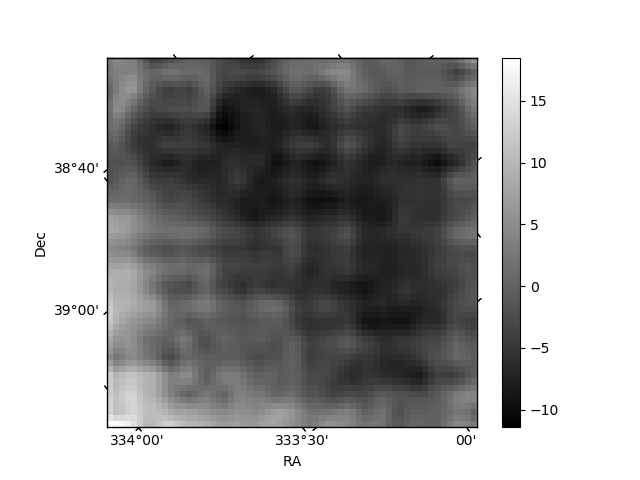
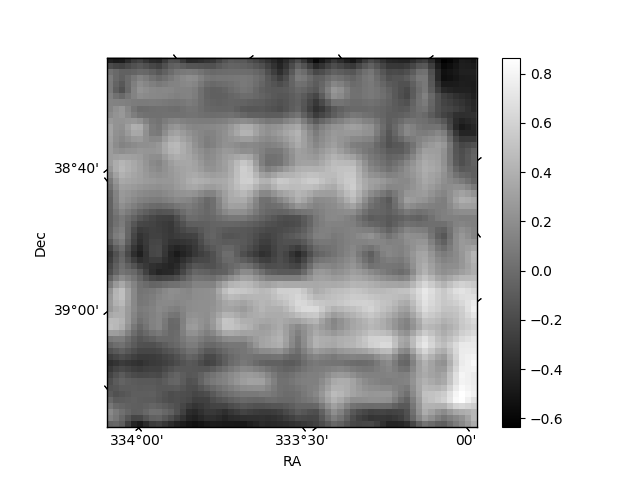
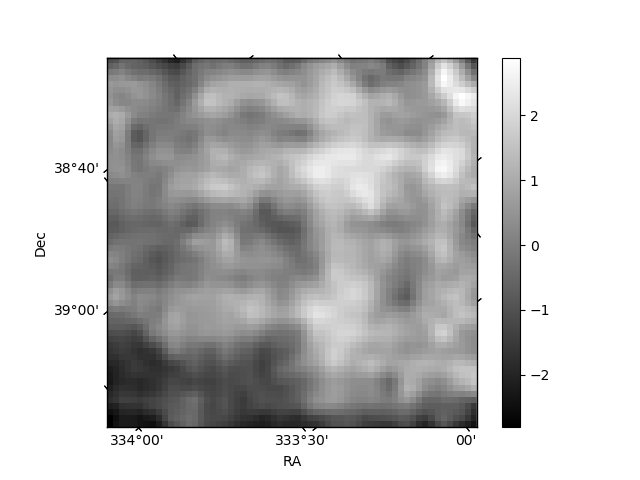
Histogram calculated using DETX and DETY for each event in the final _common_clean file
| Quadrant A | 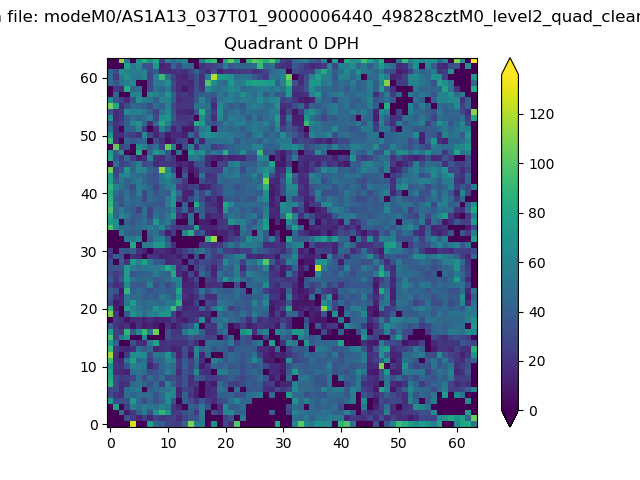 |
 |
Quadrant B |
|---|---|---|---|
| Quadrant D | 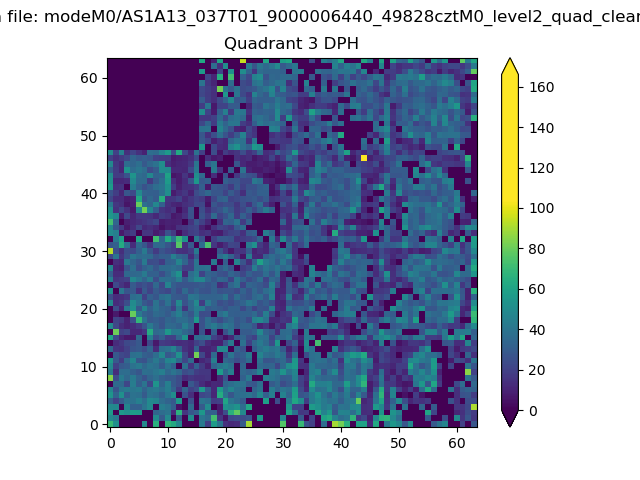 |
 |
Quadrant C |
| Plot type | Count rate plots | Images |
|---|---|---|
| Comparison with Poisson distribution Blue bars denote a histogram of data divided into 1 sec bins. Red curve is a Poisson curve with rate = median count rate of data. |
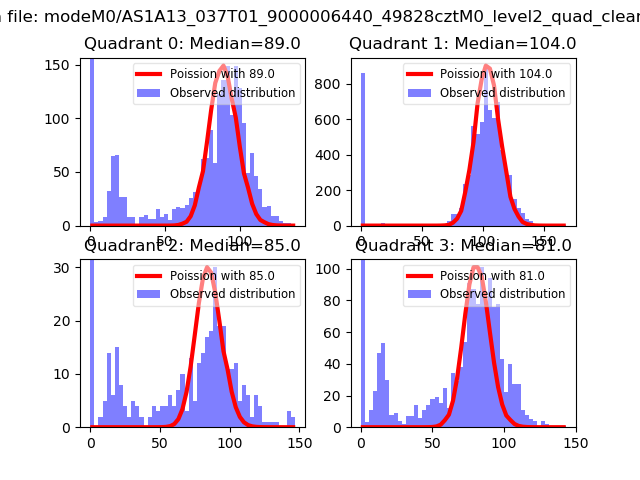 |
 |
| Quadrant-wise count rates Data is divided into 100 sec bins |
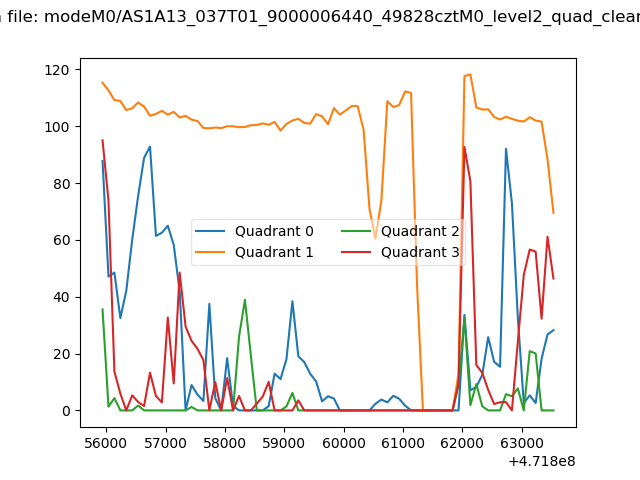 |
|
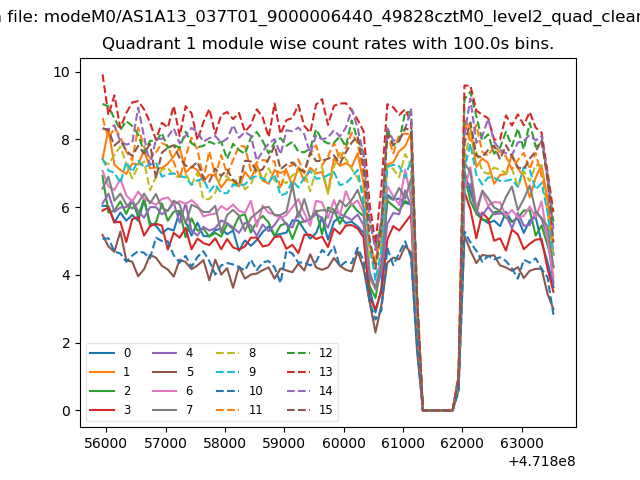
| Module-wise count rates for Quadrant A Data is divided into 100 sec bins |
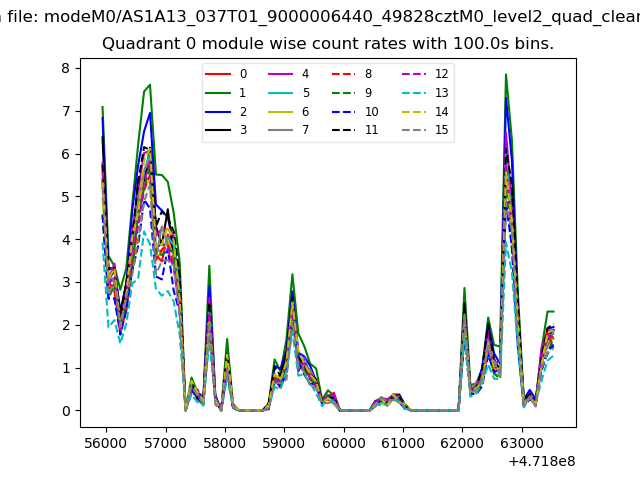 |
 |
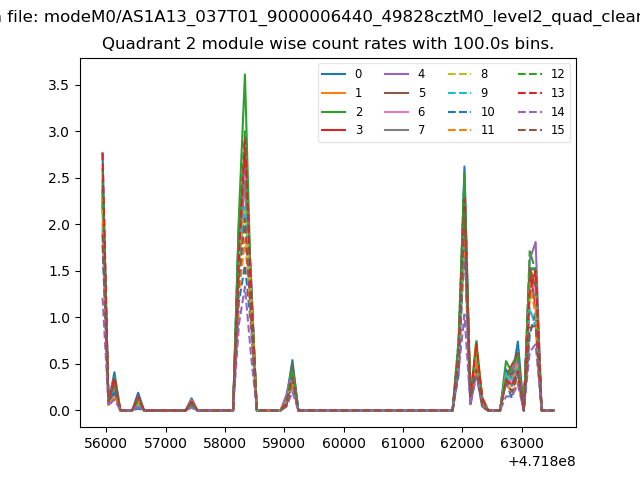
| Module-wise count rates for Quadrant B Data is divided into 100 sec bins |
 |
 |
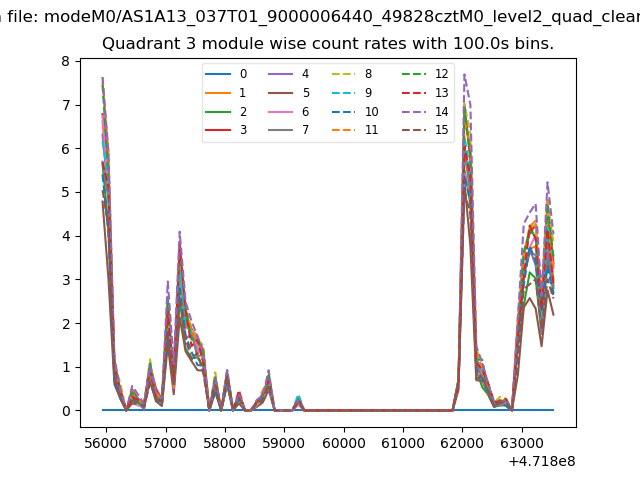
| Module-wise count rates for Quadrant C Data is divided into 100 sec bins |
 |
 |
| Module-wise count rates for Quadrant D Data is divided into 100 sec bins |
 |
 |
| Parameter | Plot |
|---|---|
| CZT HV Monitor | 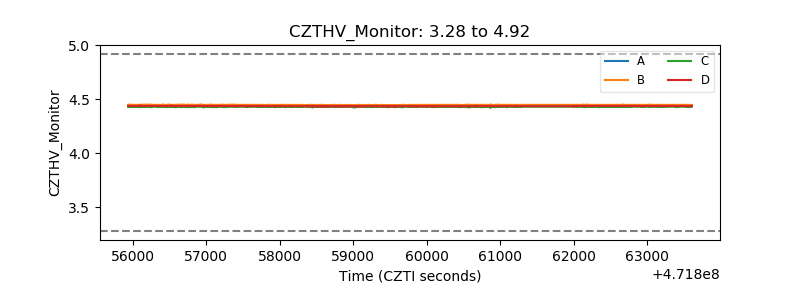 |
| D_VDD | 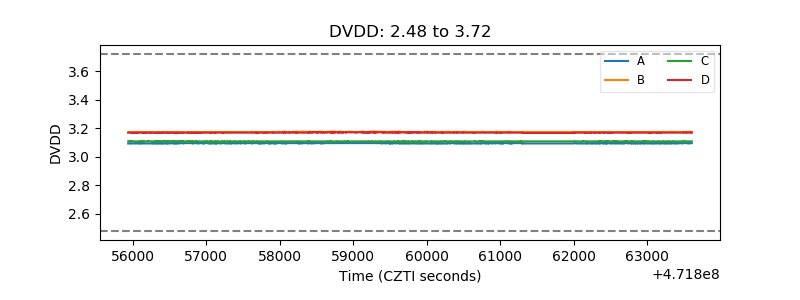 |
| Temperature 1 | 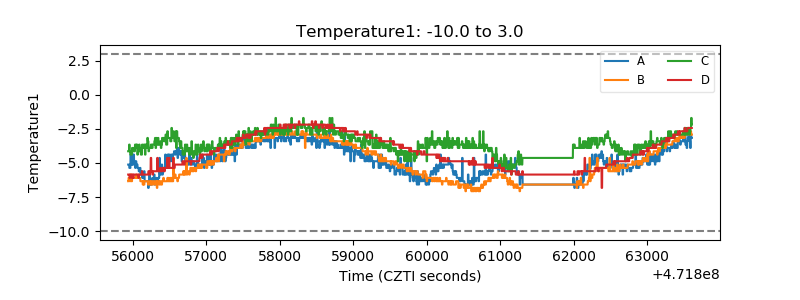 |
| Veto HV Monitor |  |
| Veto LLD |  |
| Alpha Counter | 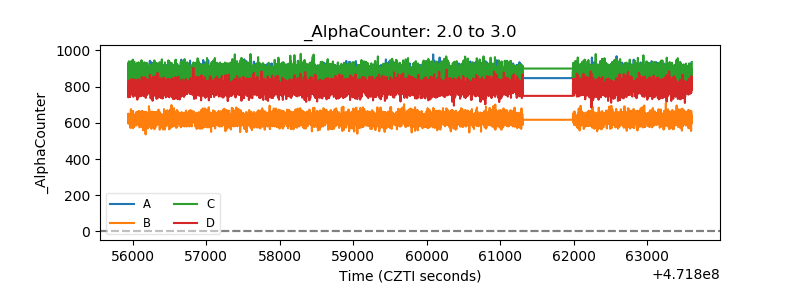 |
| _CPM_Rate | 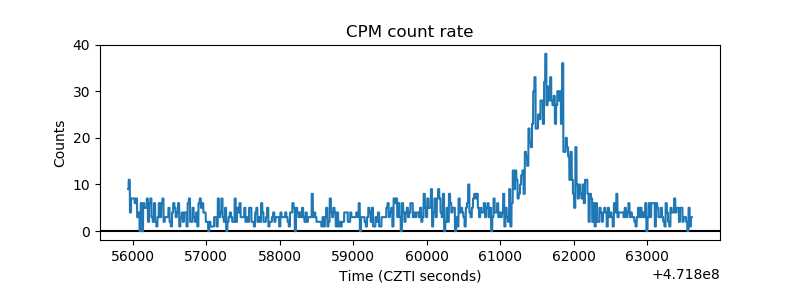 |
| CZT Counter | 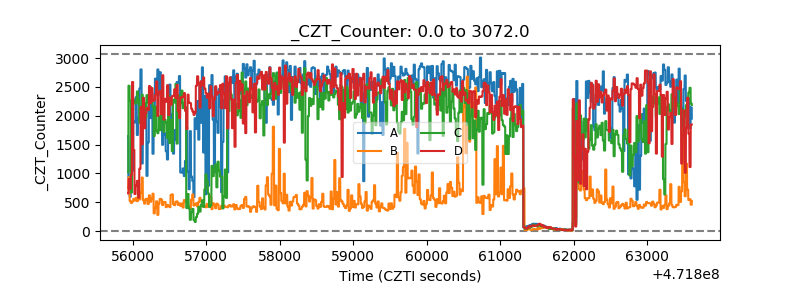 |
| +2.5 Volts monitor | 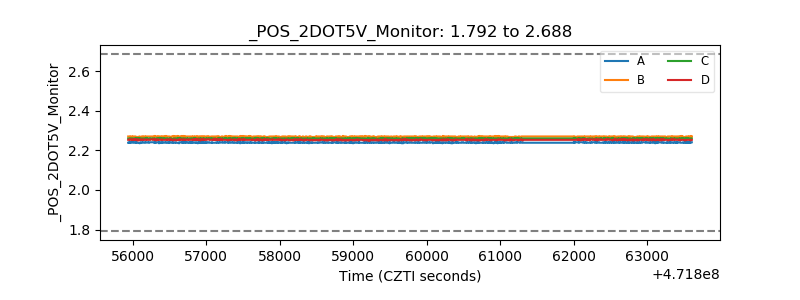 |
| +5 Volts monitor | 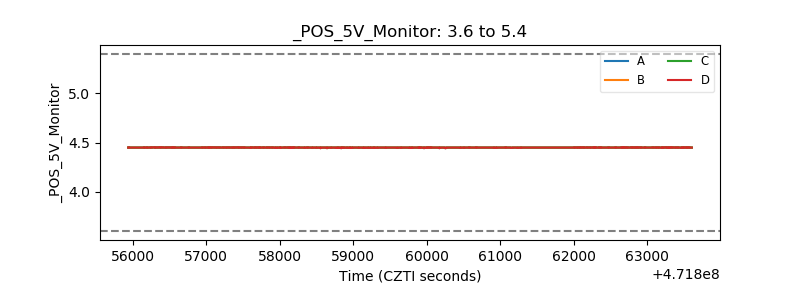 |
| _ROLL_ROT | 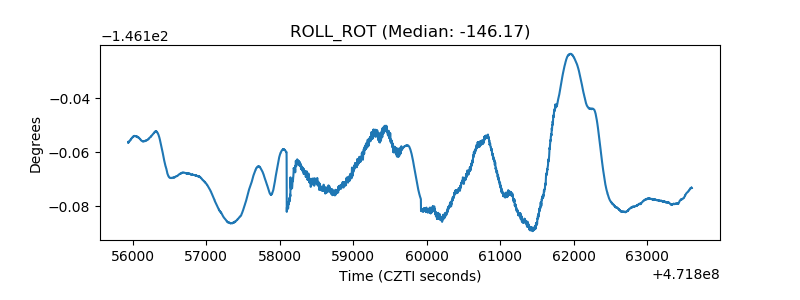 |
| _Roll_DEC | 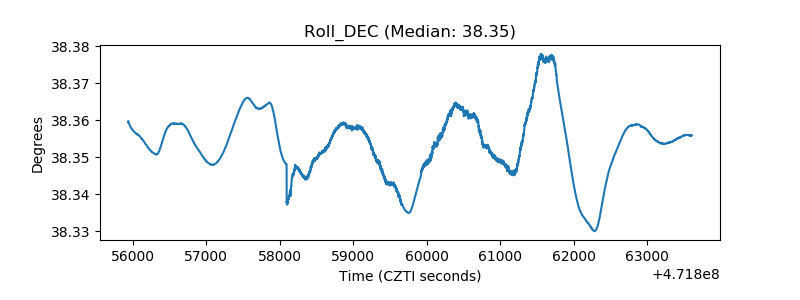 |
| _Roll_RA | 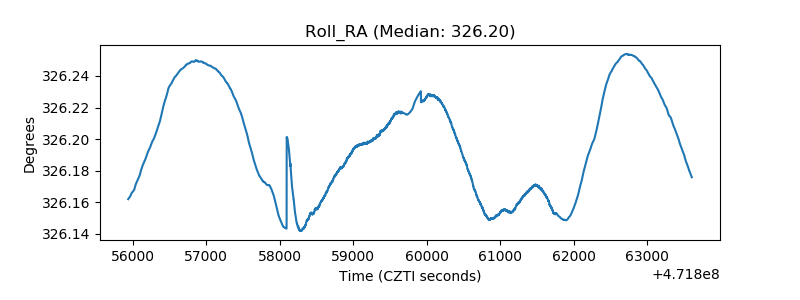 |
| Veto Counter | 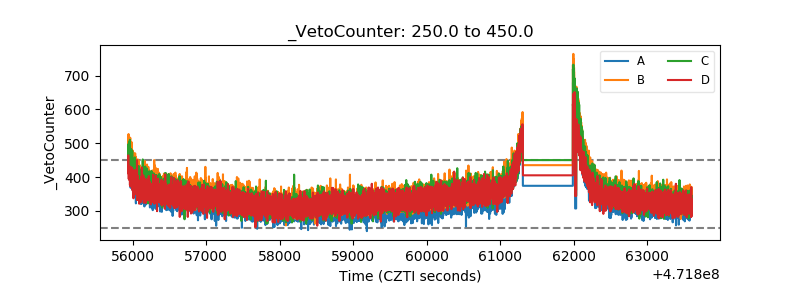 |