| Param | Original file | Final file |
|---|---|---|
| Filename | modeM0/AS1A13_037T01_9000006440_49829cztM0_level2.fits | modeM0/AS1A13_037T01_9000006440_49829cztM0_level2_quad_clean.evt |
| Size (bytes) | 1,403,199,360 | 44,835,840 |
| Size | 1.3 GB | 42.8 MB |
| Events in quadrant A | 16,970,953 | 85,640 |
| Events in quadrant B | 4,442,564 | 711,570 |
| Events in quadrant C | 14,097,941 | 8,609 |
| Events in quadrant D | 15,891,310 | 64,390 |
| Mode SS | |||
|---|---|---|---|
| Quadrant | BADHDUFLAG | Total packets | Discarded packets |
| A | 0 | 140 | 0 |
| B | 0 | 140 | 0 |
| C | 0 | 140 | 0 |
| D | 0 | 140 | 0 |
| Mode M0 | |||
|---|---|---|---|
| Quadrant | BADHDUFLAG | Total packets | Discarded packets |
| A | 0 | 55197 | 0 |
| B | 0 | 18040 | 0 |
| C | 0 | 46659 | 5 |
| D | 0 | 51953 | 0 |
| Quadrant | Total seconds | Saturated seconds | Saturation percentage |
|---|---|---|---|
| A | 6992 | 6245 | 89.316362% |
| B | 6992 | 262 | 3.747140% |
| C | 6991 | 6915 | 98.912888% |
| D | 6991 | 6323 | 90.444858% |
Noise dominated data is calculated using 1-second bins in cleaned event files. If a bin has >2000 counts, and if more than 50% of those come from <1% of pixels, then it is considered to be noise-dominated and hence unusable.
| Quadrant | # 1 sec bins | Bins with >0 counts | Bins with >2000 counts | High rate bins dominated by noise | Noise dominated (total time) | Noise dominated (detector-on time) | Marked lightcurve |
|---|---|---|---|---|---|---|---|
| A | 6992 | 6992 | 5404 | 5404 | 77.29% | 77.29% | 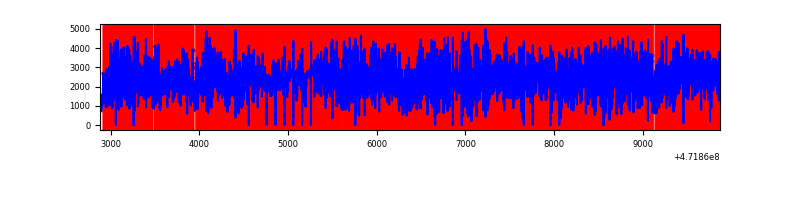 |
| B | 6992 | 6992 | 113 | 113 | 1.62% | 1.62% | 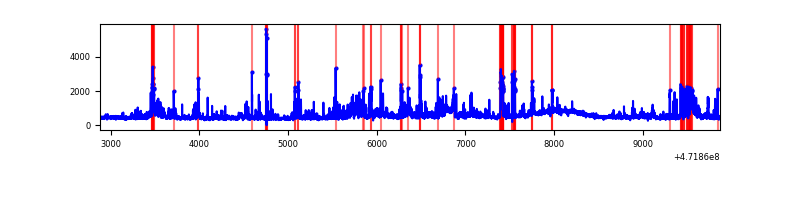 |
| C | 6990 | 6989 | 3616 | 3616 | 51.73% | 51.74% | 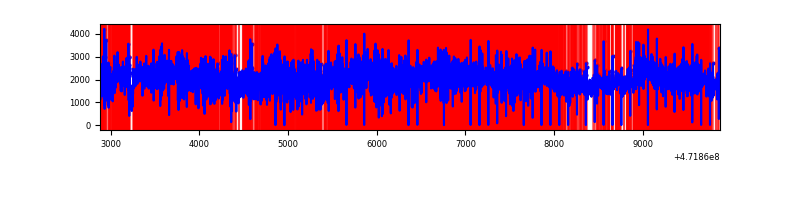 |
| D | 6991 | 6990 | 5027 | 5027 | 71.91% | 71.92% | 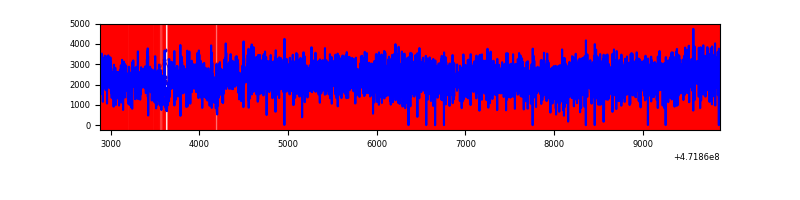 |
Top three noisy pixels from each quadrant. If the there are fewer than three noisy pixels in the level2.evt file, extra rows are filled as -1
| Pixel properties | Quadrant properties | ||||||
|---|---|---|---|---|---|---|---|
| Quadrant | DetID | PixID | Counts | Sigma | Mean | Median | Sigma |
| A | 3 | 84 | 6062281 | 71642.23 | 321 | 311 | 84.6 |
| A | 4 | 4 | 4252475 | 50253.38 | 321 | 311 | 84.6 |
| A | 0 | 98 | 1832507 | 21653.46 | 321 | 311 | 84.6 |
| B | 5 | 49 | 248406 | 1511.95 | 765 | 740 | 163.8 |
| B | 4 | 206 | 237034 | 1442.53 | 765 | 740 | 163.8 |
| B | 0 | 229 | 205706 | 1251.28 | 765 | 740 | 163.8 |
| C | 15 | 197 | 5762851 | 89896.55 | 201 | 198 | 64.1 |
| C | 1 | 44 | 2857679 | 44576.29 | 201 | 198 | 64.1 |
| C | 15 | 174 | 844197 | 13166.26 | 201 | 198 | 64.1 |
| D | 7 | 61 | 4595858 | 43945.29 | 287 | 272 | 104.6 |
| D | 7 | 126 | 1623170 | 15518.96 | 287 | 272 | 104.6 |
| D | 15 | 184 | 1359302 | 12995.72 | 287 | 272 | 104.6 |
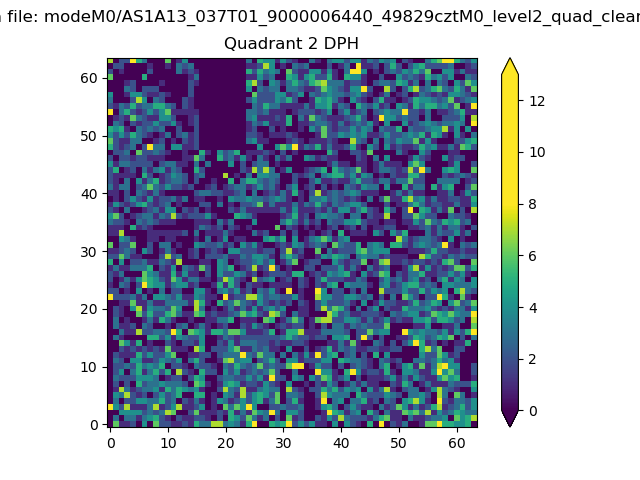
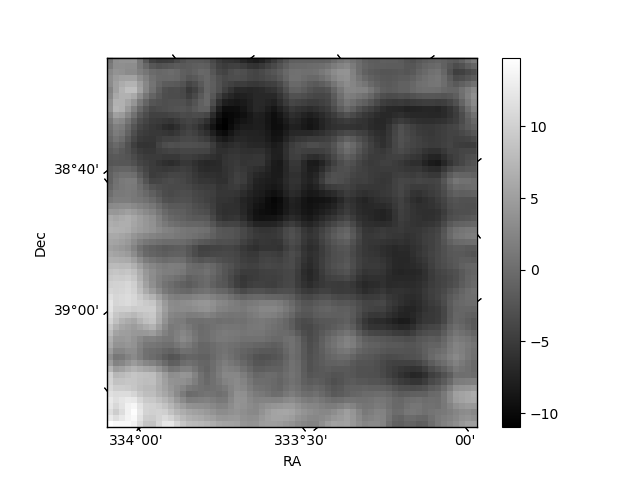
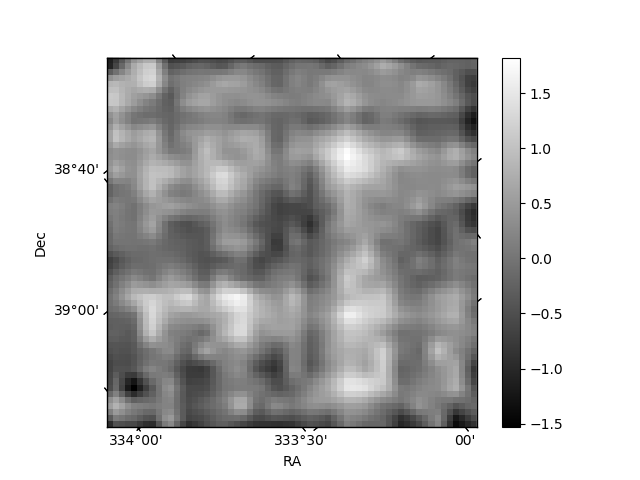
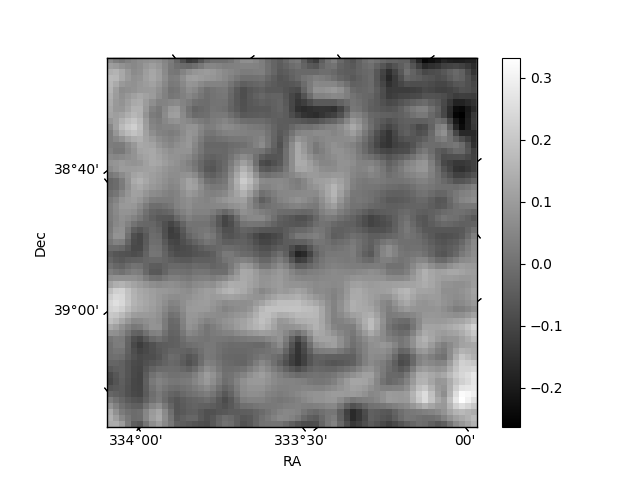
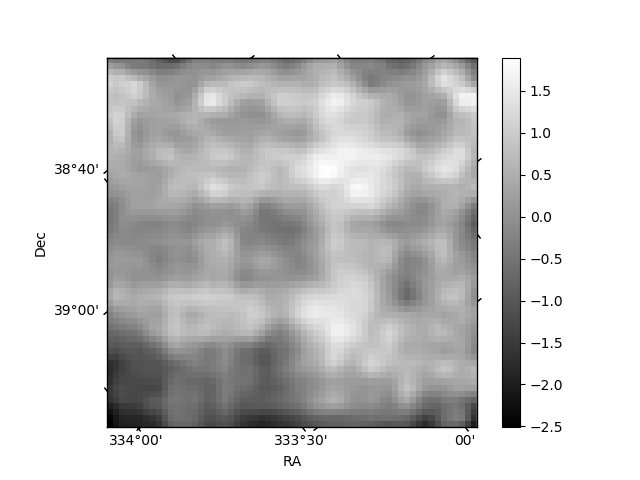
Histogram calculated using DETX and DETY for each event in the final _common_clean file
| Quadrant A | 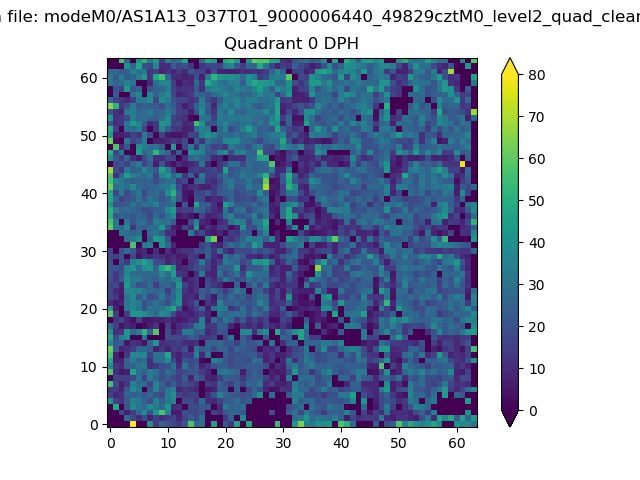 |
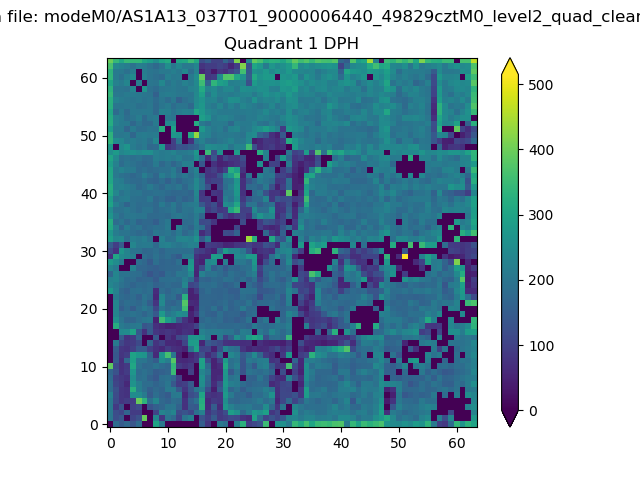 |
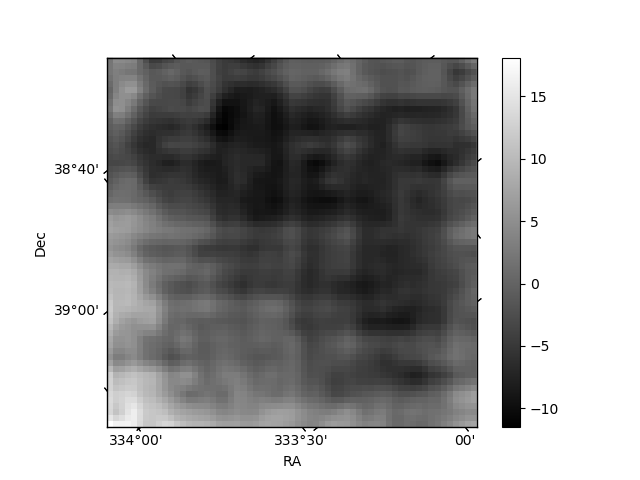
Quadrant B |
|---|---|---|---|
| Quadrant D | 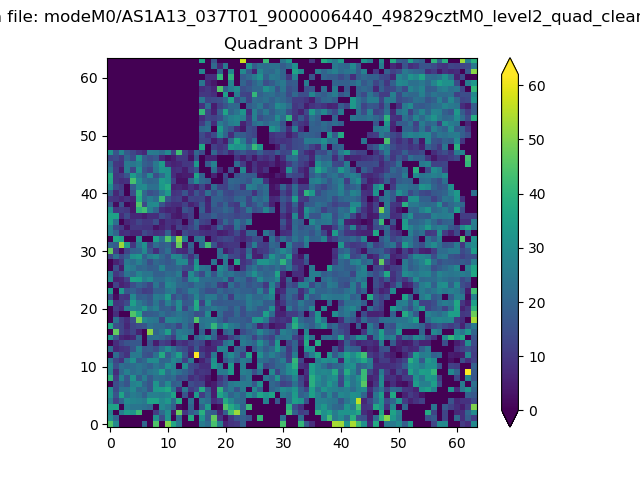 |
 |
Quadrant C |
| Plot type | Count rate plots | Images |
|---|---|---|
| Comparison with Poisson distribution Blue bars denote a histogram of data divided into 1 sec bins. Red curve is a Poisson curve with rate = median count rate of data. |
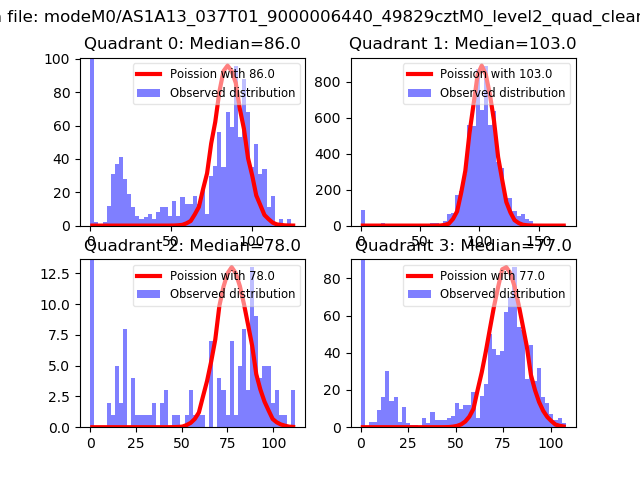 |
 |
| Quadrant-wise count rates Data is divided into 100 sec bins |
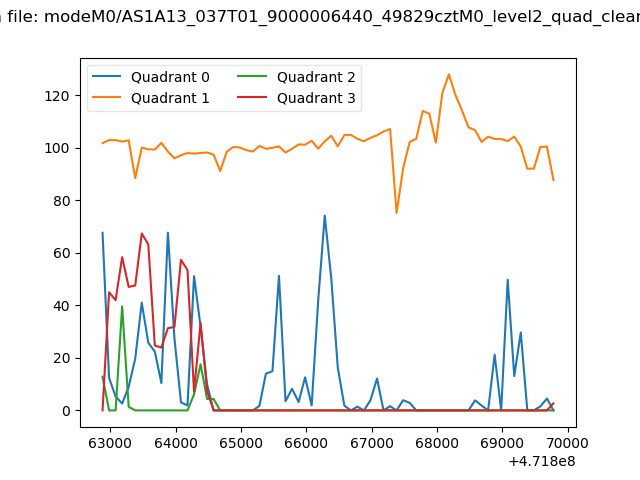 |
|
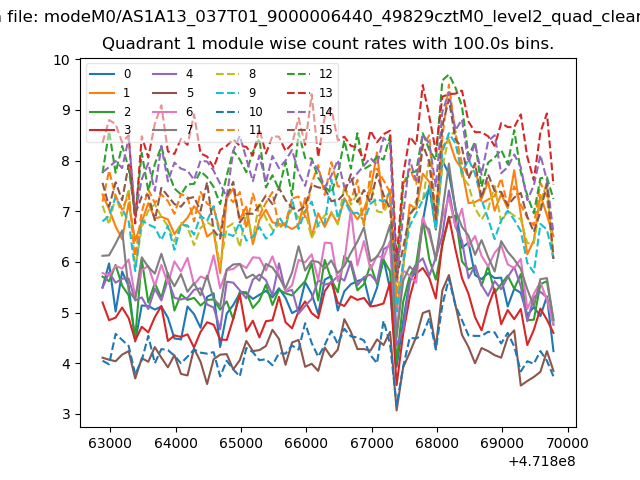
| Module-wise count rates for Quadrant A Data is divided into 100 sec bins |
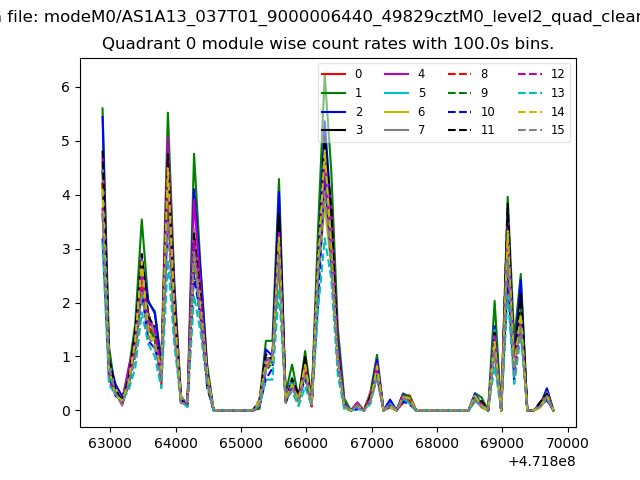 |
 |
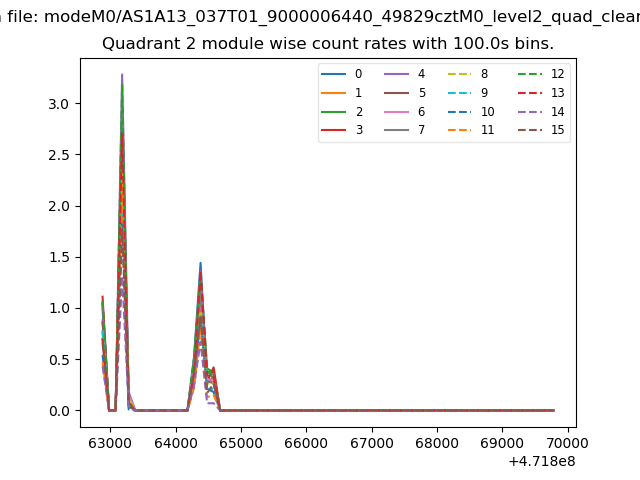
| Module-wise count rates for Quadrant B Data is divided into 100 sec bins |
 |
 |
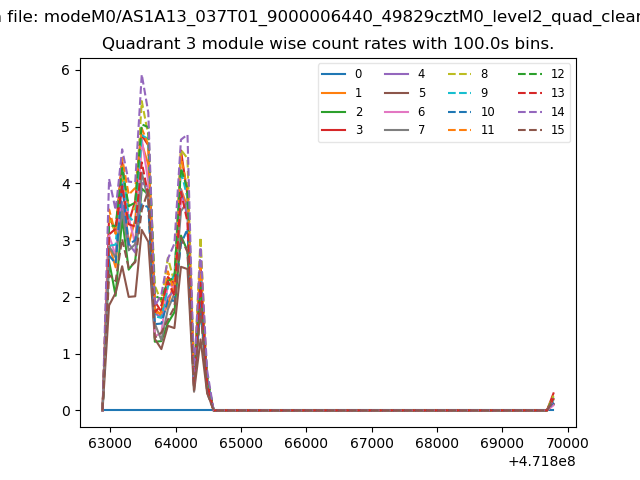
| Module-wise count rates for Quadrant C Data is divided into 100 sec bins |
 |
 |
| Module-wise count rates for Quadrant D Data is divided into 100 sec bins |
 |
 |
| Parameter | Plot |
|---|---|
| CZT HV Monitor | 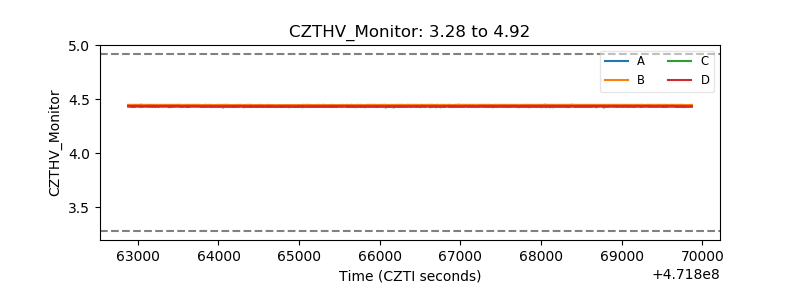 |
| D_VDD | 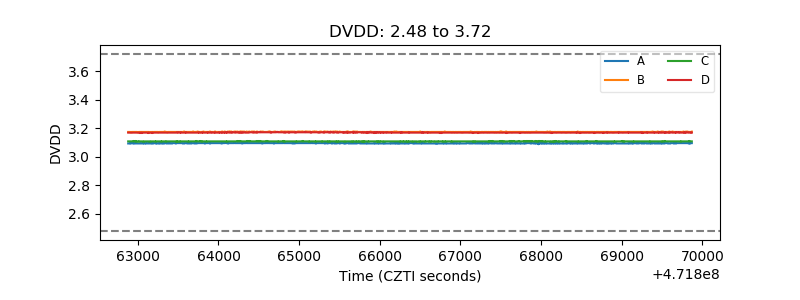 |
| Temperature 1 | 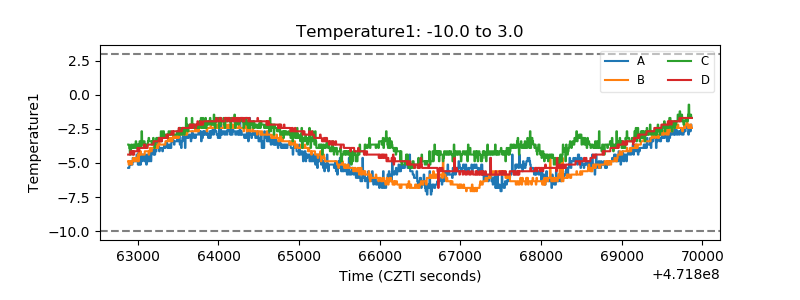 |
| Veto HV Monitor |  |
| Veto LLD |  |
| Alpha Counter | 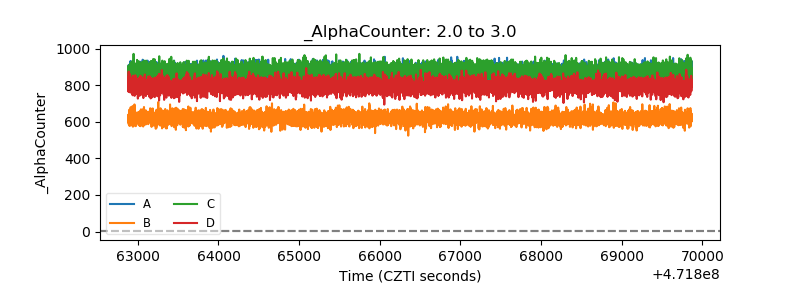 |
| _CPM_Rate | 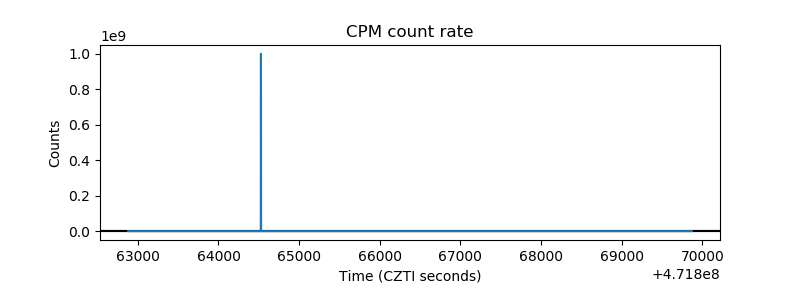 |
| CZT Counter | 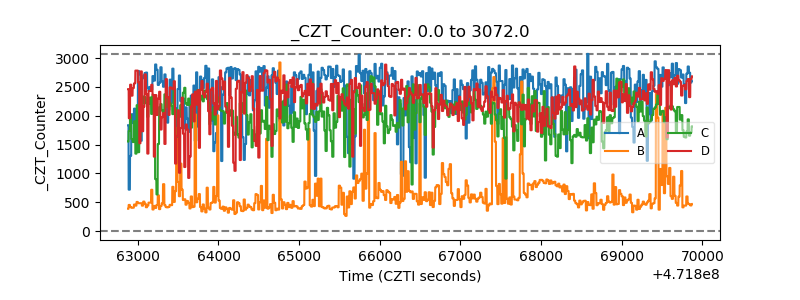 |
| +2.5 Volts monitor | 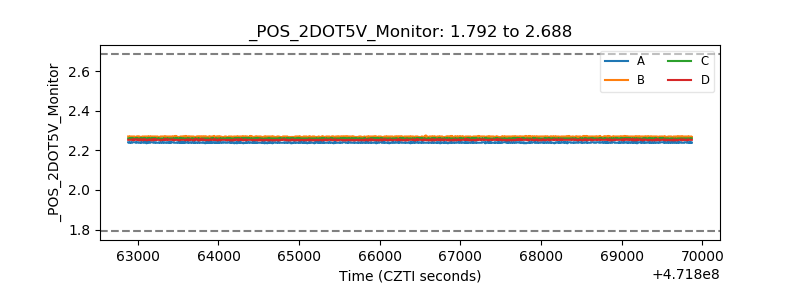 |
| +5 Volts monitor | 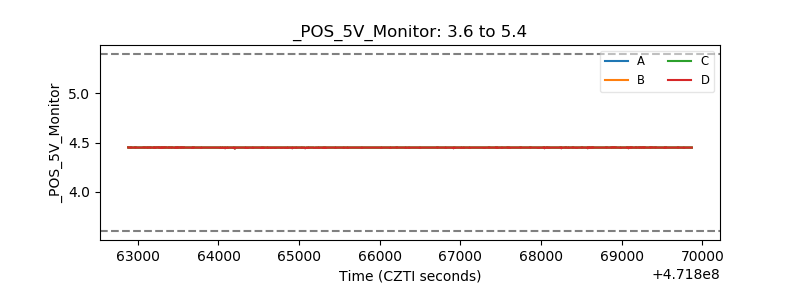 |
| _ROLL_ROT | 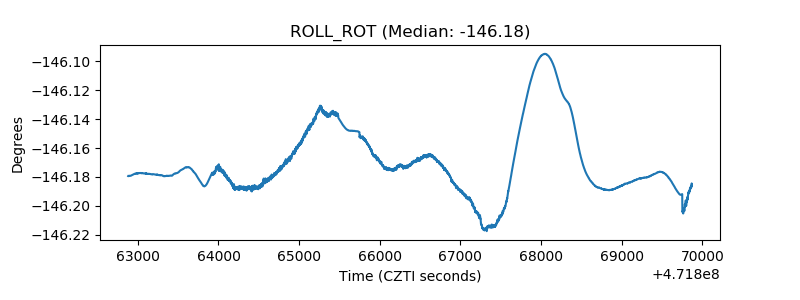 |
| _Roll_DEC | 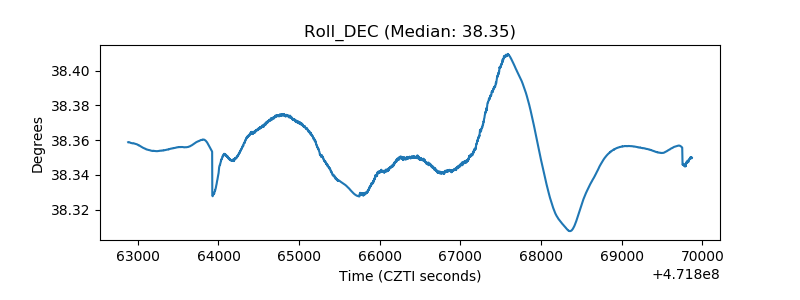 |
| _Roll_RA | 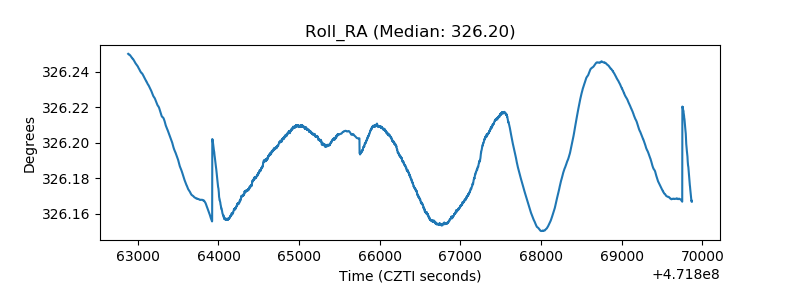 |
| Veto Counter | 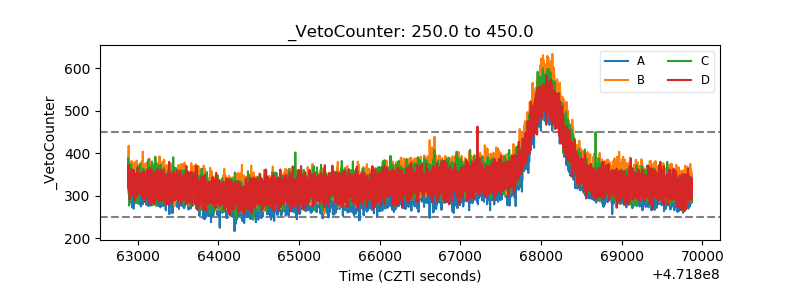 |