| Param | Original file | Final file |
|---|---|---|
| Filename | modeM0/AS1A13_037T01_9000006440_49830cztM0_level2.fits | modeM0/AS1A13_037T01_9000006440_49830cztM0_level2_quad_clean.evt |
| Size (bytes) | 1,455,943,680 | 53,668,800 |
| Size | 1.4 GB | 51.2 MB |
| Events in quadrant A | 19,196,996 | 167,446 |
| Events in quadrant B | 4,277,326 | 752,217 |
| Events in quadrant C | 12,757,631 | 52,534 |
| Events in quadrant D | 17,093,618 | 129,834 |
| Mode SS | |||
|---|---|---|---|
| Quadrant | BADHDUFLAG | Total packets | Discarded packets |
| A | 0 | 146 | 0 |
| B | 0 | 146 | 0 |
| C | 0 | 146 | 0 |
| D | 0 | 146 | 0 |
| Mode M0 | |||
|---|---|---|---|
| Quadrant | BADHDUFLAG | Total packets | Discarded packets |
| A | 0 | 61965 | 0 |
| B | 0 | 17740 | 0 |
| C | 0 | 42997 | 0 |
| D | 0 | 55787 | 0 |
| Quadrant | Total seconds | Saturated seconds | Saturation percentage |
|---|---|---|---|
| A | 7366 | 7195 | 97.678523% |
| B | 7366 | 126 | 1.710562% |
| C | 7367 | 7367 | 100.000000% |
| D | 7367 | 7361 | 99.918556% |
Noise dominated data is calculated using 1-second bins in cleaned event files. If a bin has >2000 counts, and if more than 50% of those come from <1% of pixels, then it is considered to be noise-dominated and hence unusable.
| Quadrant | # 1 sec bins | Bins with >0 counts | Bins with >2000 counts | High rate bins dominated by noise | Noise dominated (total time) | Noise dominated (detector-on time) | Marked lightcurve |
|---|---|---|---|---|---|---|---|
| A | 7366 | 7366 | 6606 | 6606 | 89.68% | 89.68% | 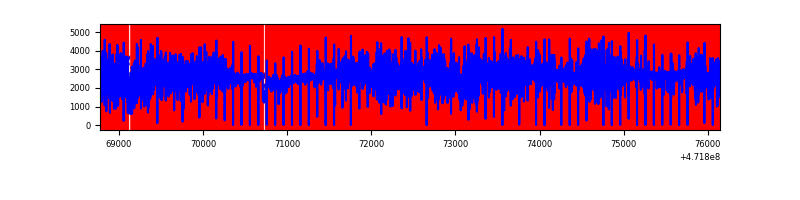 |
| B | 7366 | 7366 | 89 | 89 | 1.21% | 1.21% | 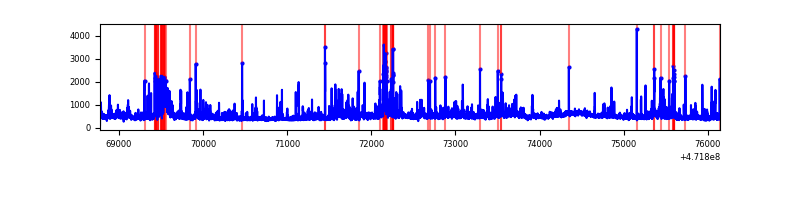 |
| C | 7366 | 7365 | 1746 | 1746 | 23.70% | 23.71% | 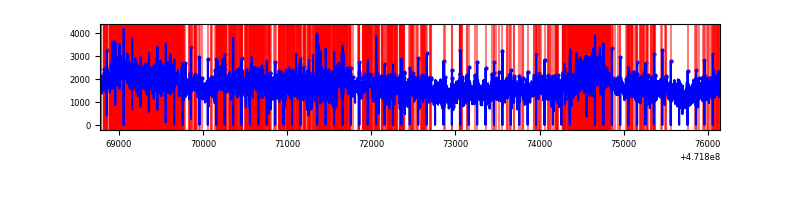 |
| D | 7366 | 7365 | 5508 | 5508 | 74.78% | 74.79% | 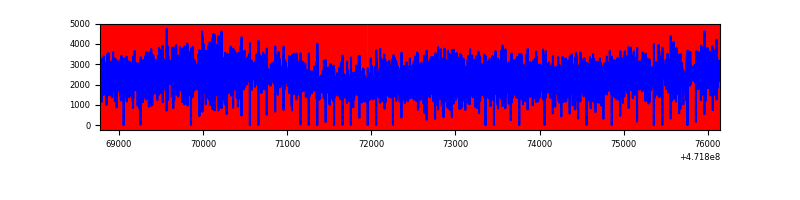 |
Top three noisy pixels from each quadrant. If the there are fewer than three noisy pixels in the level2.evt file, extra rows are filled as -1
| Pixel properties | Quadrant properties | ||||||
|---|---|---|---|---|---|---|---|
| Quadrant | DetID | PixID | Counts | Sigma | Mean | Median | Sigma |
| A | 0 | 98 | 7348834 | 123916.88 | 206 | 199 | 59.3 |
| A | 4 | 4 | 6436340 | 108529.88 | 206 | 199 | 59.3 |
| A | 3 | 84 | 1897119 | 31986.95 | 206 | 199 | 59.3 |
| B | 4 | 206 | 195911 | 1170.52 | 781 | 756 | 166.7 |
| B | 10 | 44 | 177780 | 1061.78 | 781 | 756 | 166.7 |
| B | 0 | 229 | 176159 | 1052.05 | 781 | 756 | 166.7 |
| C | 15 | 147 | 3463523 | 104343.75 | 76 | 73 | 33.2 |
| C | 15 | 197 | 2552522 | 76897.92 | 76 | 73 | 33.2 |
| C | 15 | 174 | 1063715 | 32044.46 | 76 | 73 | 33.2 |
| D | 7 | 61 | 5118897 | 64370.68 | 183 | 172 | 79.5 |
| D | 7 | 126 | 1635569 | 20565.98 | 183 | 172 | 79.5 |
| D | 14 | 66 | 1243867 | 15640.12 | 183 | 172 | 79.5 |
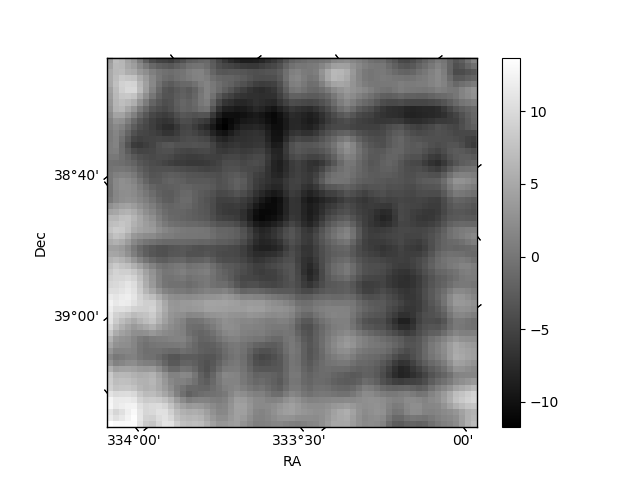
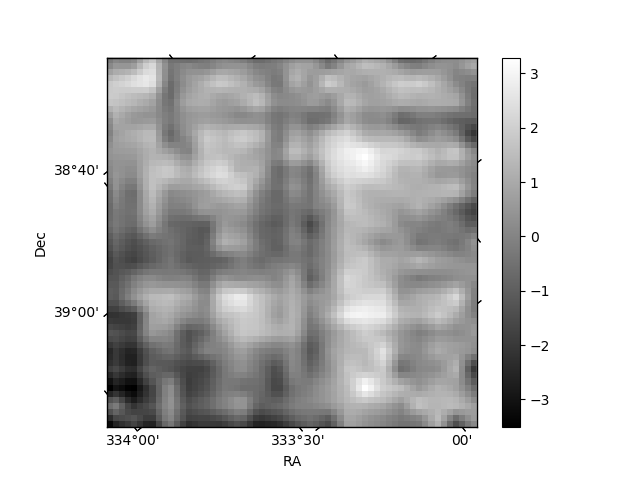
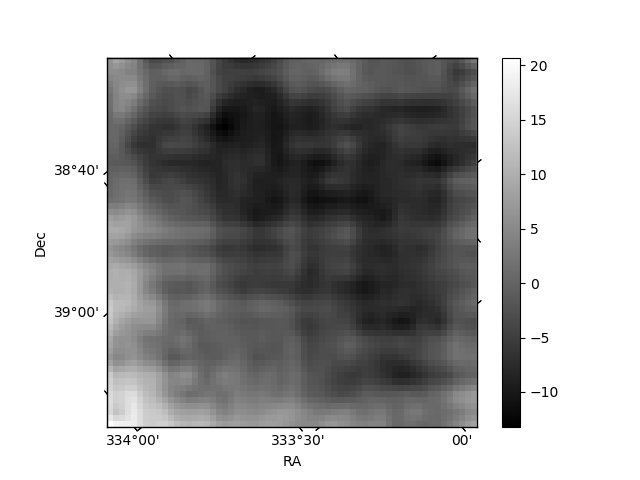
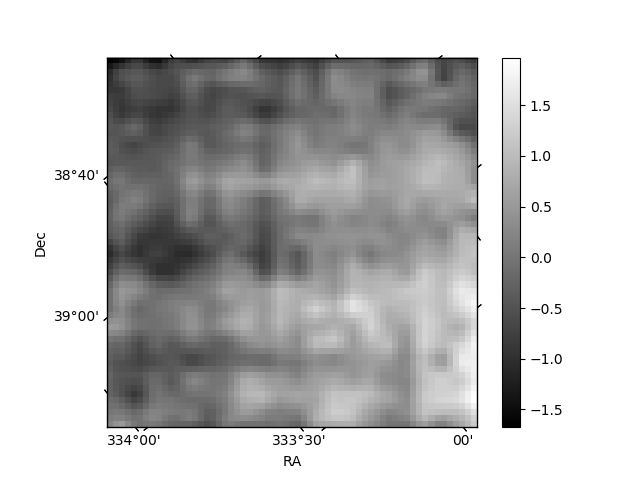
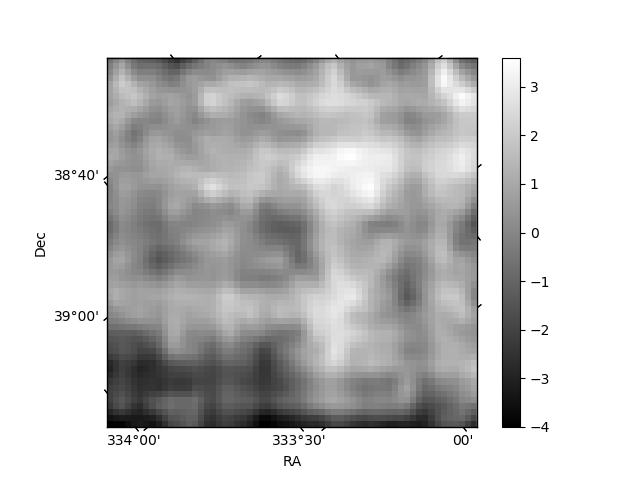
Histogram calculated using DETX and DETY for each event in the final _common_clean file
| Quadrant A | 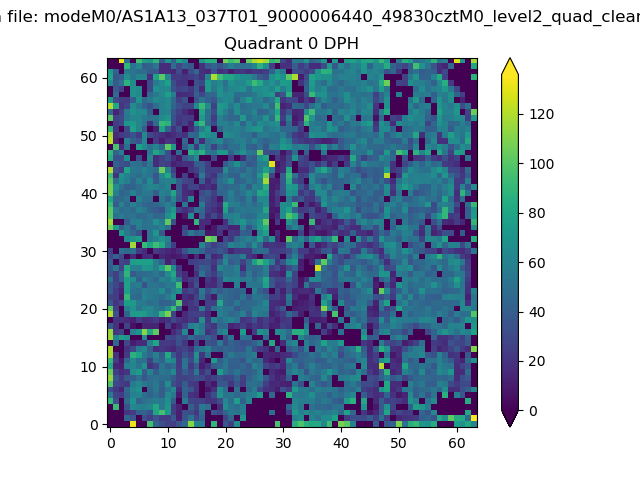 |
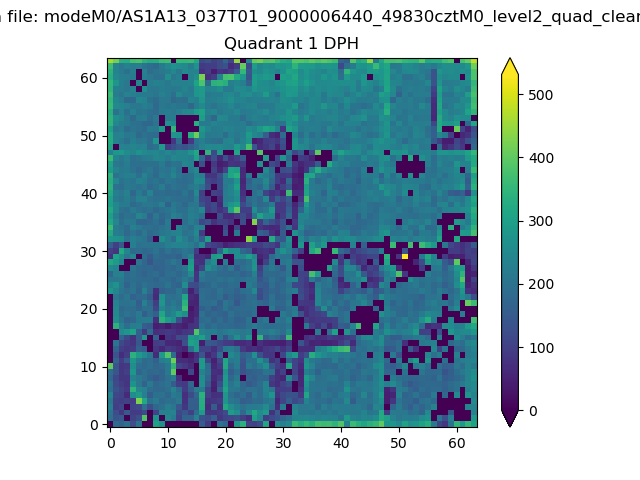 |
Quadrant B |
|---|---|---|---|
| Quadrant D | 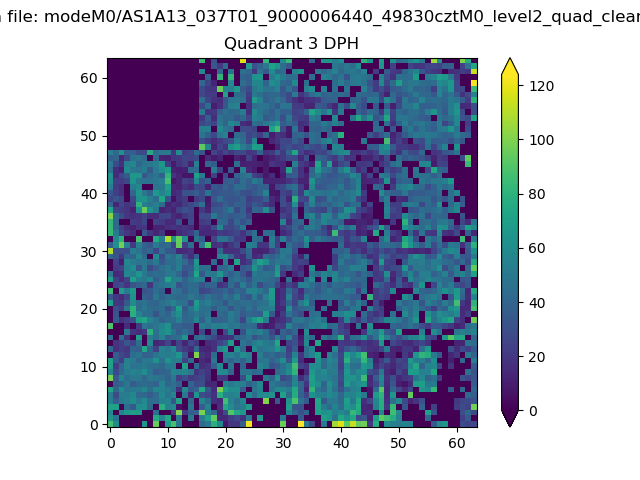 |
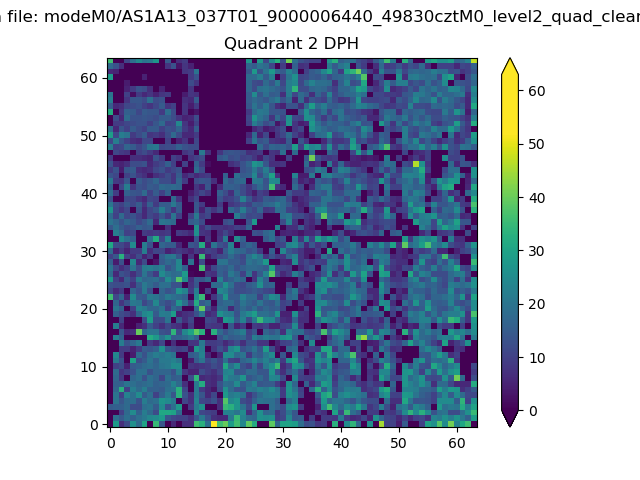 |
Quadrant C |
| Plot type | Count rate plots | Images |
|---|---|---|
| Comparison with Poisson distribution Blue bars denote a histogram of data divided into 1 sec bins. Red curve is a Poisson curve with rate = median count rate of data. |
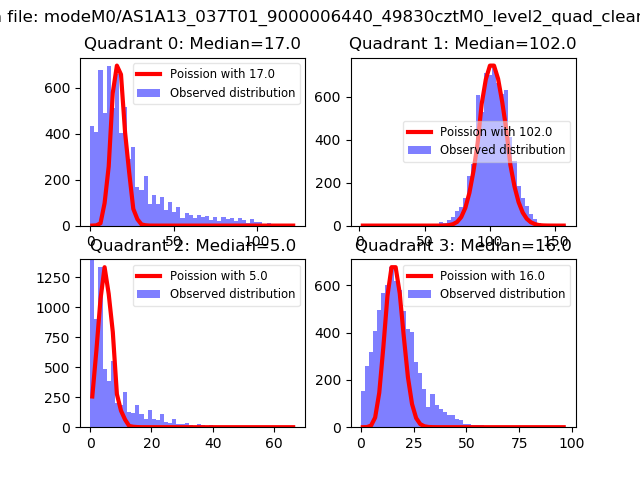 |
 |
| Quadrant-wise count rates Data is divided into 100 sec bins |
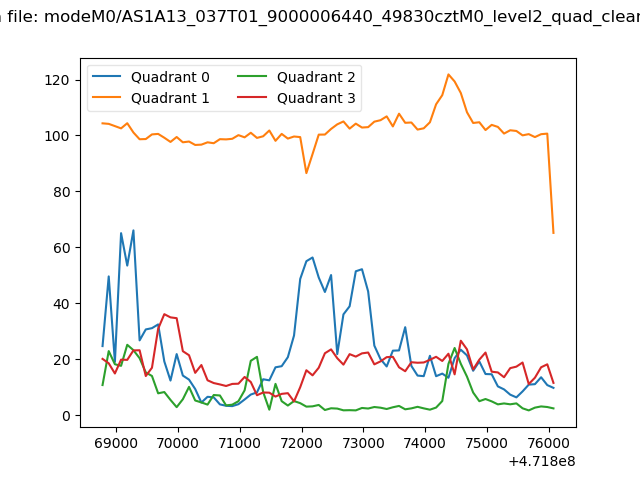 |
|
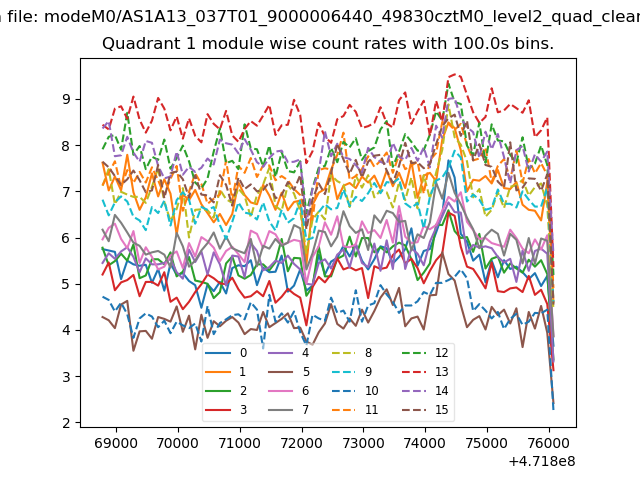
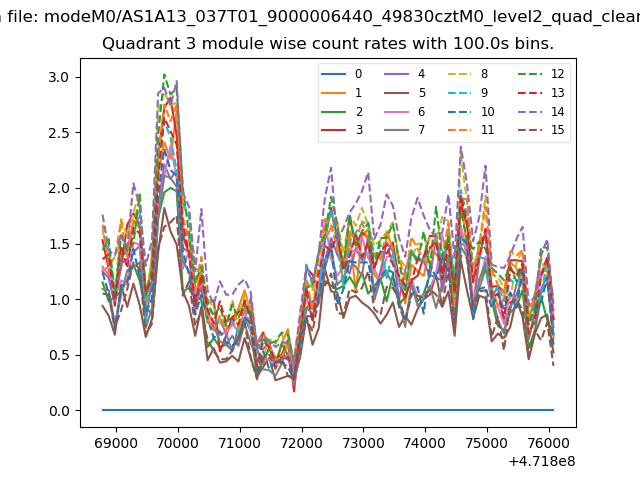
| Module-wise count rates for Quadrant A Data is divided into 100 sec bins |
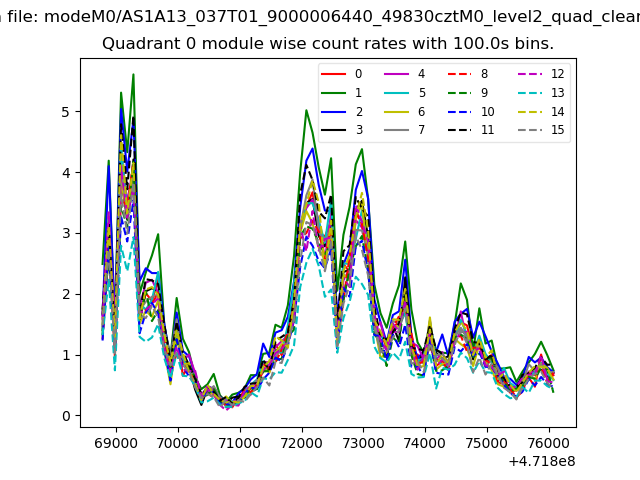 |
 |
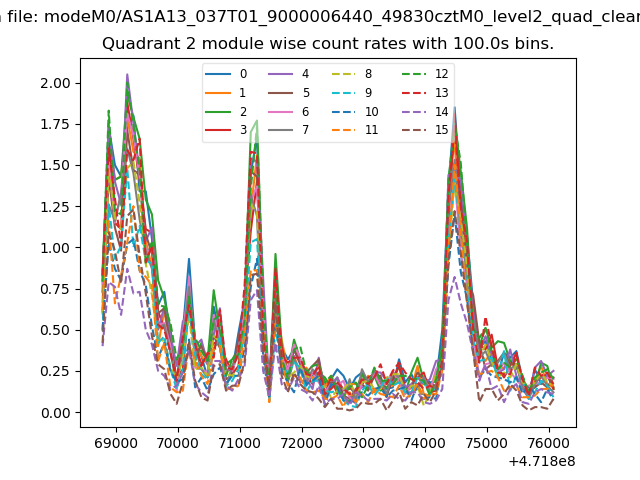
| Module-wise count rates for Quadrant B Data is divided into 100 sec bins |
 |
 |
| Module-wise count rates for Quadrant C Data is divided into 100 sec bins |
 |
 |
| Module-wise count rates for Quadrant D Data is divided into 100 sec bins |
 |
 |
| Parameter | Plot |
|---|---|
| CZT HV Monitor | 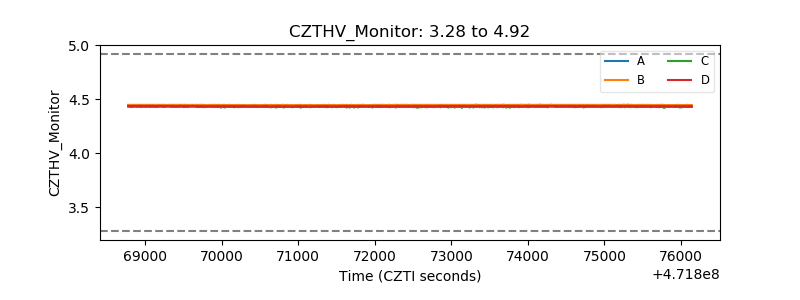 |
| D_VDD | 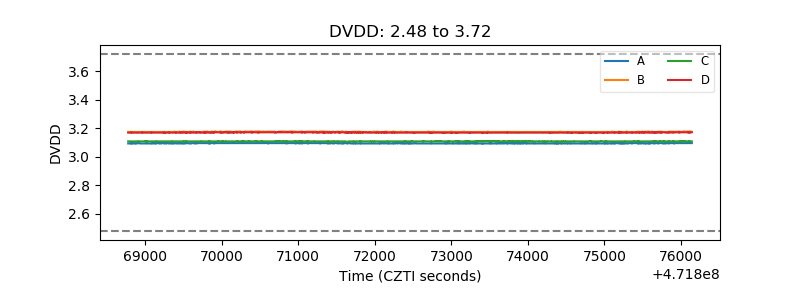 |
| Temperature 1 | 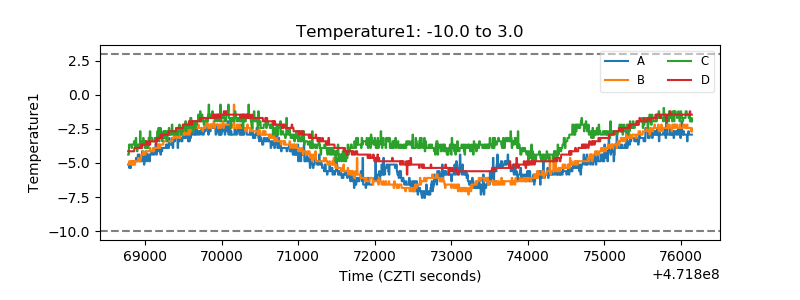 |
| Veto HV Monitor |  |
| Veto LLD |  |
| Alpha Counter | 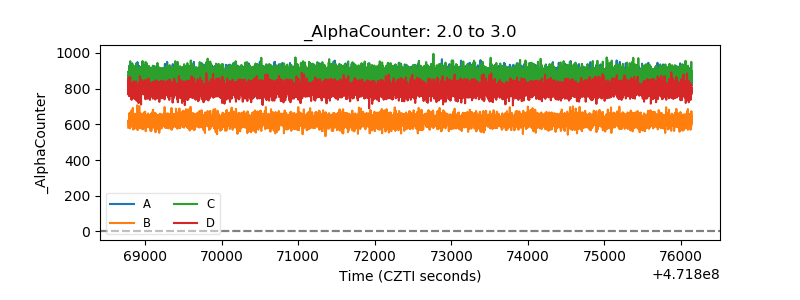 |
| _CPM_Rate | 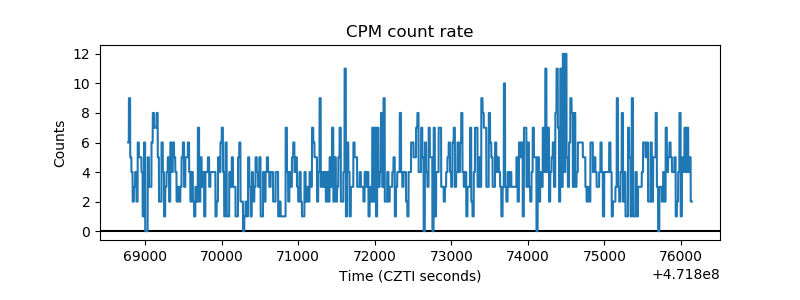 |
| CZT Counter | 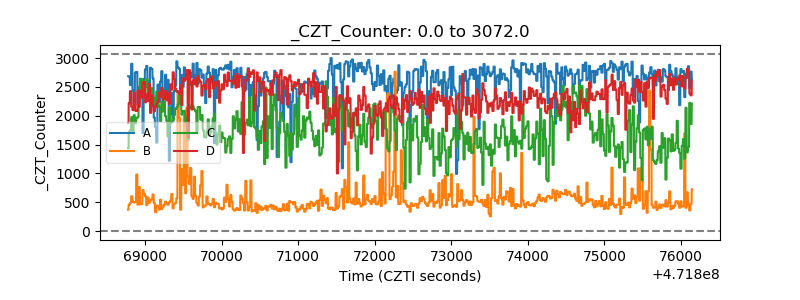 |
| +2.5 Volts monitor | 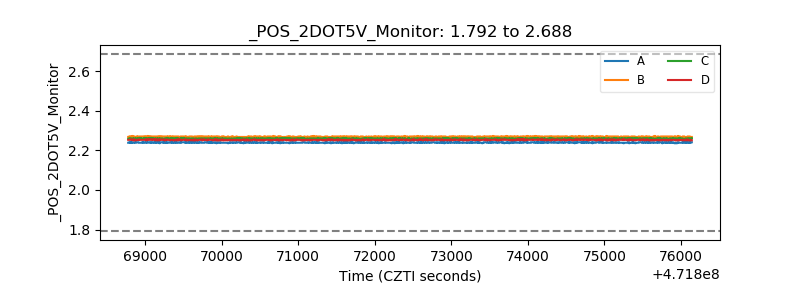 |
| +5 Volts monitor | 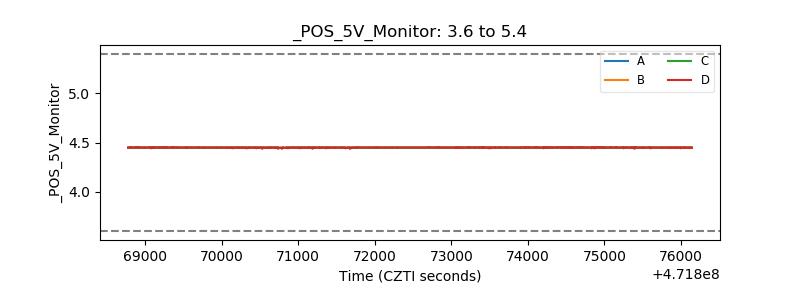 |
| _ROLL_ROT | 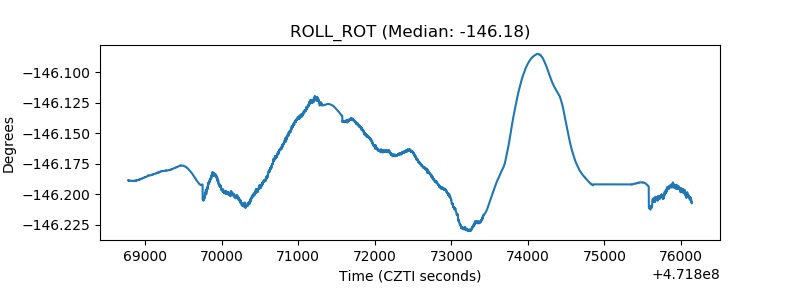 |
| _Roll_DEC | 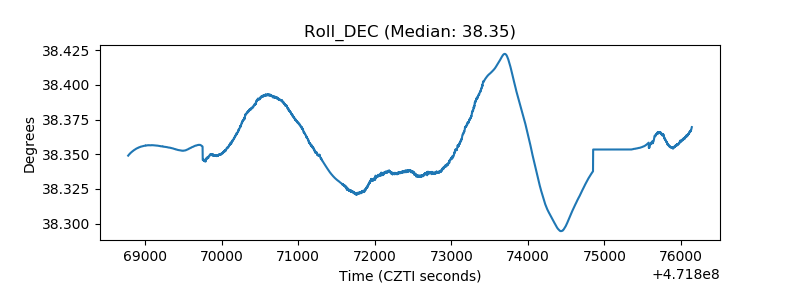 |
| _Roll_RA | 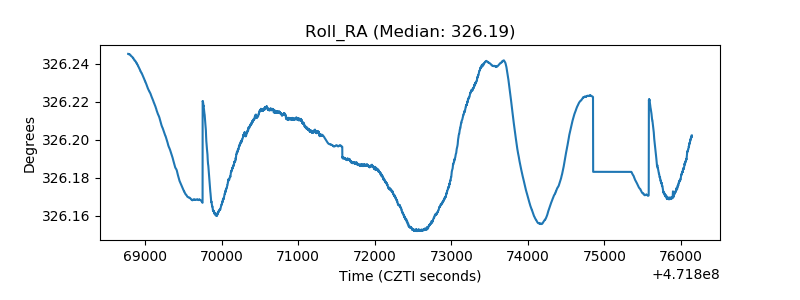 |
| Veto Counter | 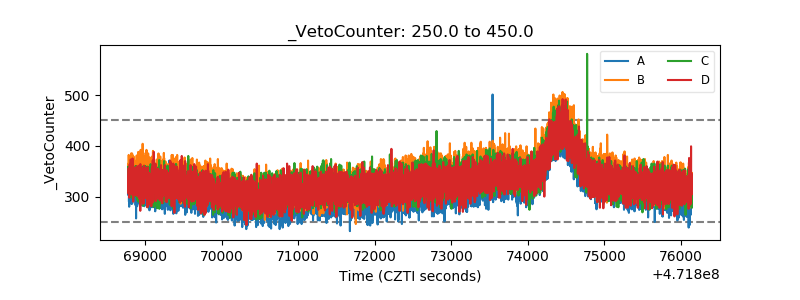 |