| Param | Original file | Final file |
|---|---|---|
| Filename | modeM0/AS1A13_037T01_9000006440_49831cztM0_level2.fits | modeM0/AS1A13_037T01_9000006440_49831cztM0_level2_quad_clean.evt |
| Size (bytes) | 1,320,289,920 | 48,850,560 |
| Size | 1.2 GB | 46.6 MB |
| Events in quadrant A | 18,637,440 | 142,849 |
| Events in quadrant B | 3,766,008 | 728,498 |
| Events in quadrant C | 10,032,536 | 5,439 |
| Events in quadrant D | 15,881,832 | 93,290 |
| Mode SS | |||
|---|---|---|---|
| Quadrant | BADHDUFLAG | Total packets | Discarded packets |
| A | 0 | 144 | 0 |
| B | 0 | 144 | 0 |
| C | 0 | 144 | 0 |
| D | 0 | 144 | 0 |
| Mode M0 | |||
|---|---|---|---|
| Quadrant | BADHDUFLAG | Total packets | Discarded packets |
| A | 0 | 60235 | 0 |
| B | 0 | 16140 | 0 |
| C | 0 | 34830 | 0 |
| D | 0 | 52103 | 0 |
| Quadrant | Total seconds | Saturated seconds | Saturation percentage |
|---|---|---|---|
| A | 7160 | 7089 | 99.008380% |
| B | 7160 | 75 | 1.047486% |
| C | 7161 | 7161 | 100.000000% |
| D | 7161 | 7161 | 100.000000% |
Noise dominated data is calculated using 1-second bins in cleaned event files. If a bin has >2000 counts, and if more than 50% of those come from <1% of pixels, then it is considered to be noise-dominated and hence unusable.
| Quadrant | # 1 sec bins | Bins with >0 counts | Bins with >2000 counts | High rate bins dominated by noise | Noise dominated (total time) | Noise dominated (detector-on time) | Marked lightcurve |
|---|---|---|---|---|---|---|---|
| A | 7159 | 7159 | 6408 | 6408 | 89.51% | 89.51% | 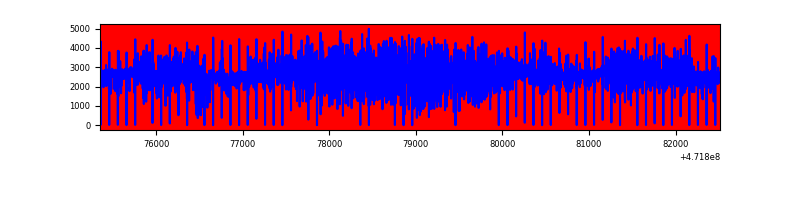 |
| B | 7160 | 7160 | 46 | 46 | 0.64% | 0.64% | 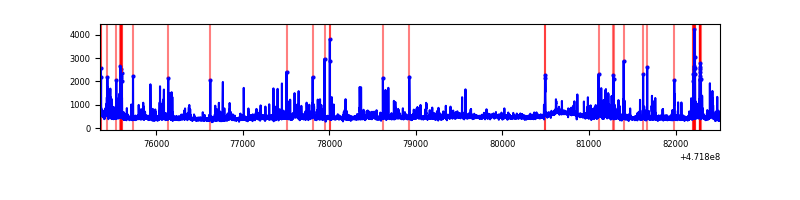 |
| C | 7160 | 7159 | 386 | 386 | 5.39% | 5.39% | 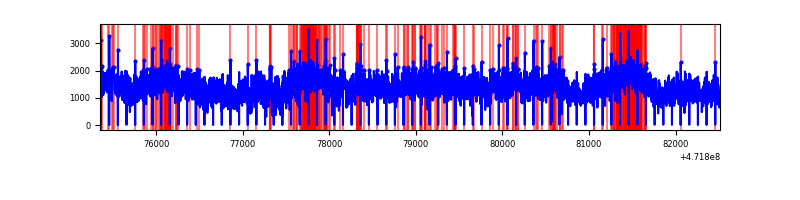 |
| D | 7160 | 7160 | 5082 | 5082 | 70.98% | 70.98% | 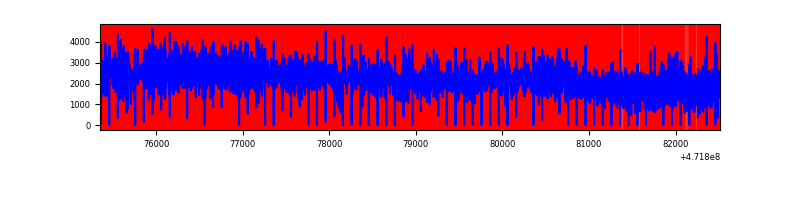 |
Top three noisy pixels from each quadrant. If the there are fewer than three noisy pixels in the level2.evt file, extra rows are filled as -1
| Pixel properties | Quadrant properties | ||||||
|---|---|---|---|---|---|---|---|
| Quadrant | DetID | PixID | Counts | Sigma | Mean | Median | Sigma |
| A | 0 | 98 | 6345575 | 114398.99 | 177 | 170 | 55.5 |
| A | 3 | 84 | 4679722 | 84365.94 | 177 | 170 | 55.5 |
| A | 4 | 4 | 3318665 | 59827.94 | 177 | 170 | 55.5 |
| B | 4 | 206 | 260661 | 1601.55 | 761 | 737 | 162.3 |
| B | 0 | 229 | 123264 | 754.96 | 761 | 737 | 162.3 |
| B | 9 | 218 | 90120 | 550.74 | 761 | 737 | 162.3 |
| C | 15 | 147 | 4616827 | 198914.77 | 30 | 27 | 23.2 |
| C | 15 | 197 | 984174 | 42401.96 | 30 | 27 | 23.2 |
| C | 15 | 230 | 736596 | 31735.07 | 30 | 27 | 23.2 |
| D | 7 | 61 | 3779623 | 46221.63 | 138 | 127 | 81.8 |
| D | 7 | 126 | 2500741 | 30581.45 | 138 | 127 | 81.8 |
| D | 7 | 159 | 1566710 | 19158.64 | 138 | 127 | 81.8 |
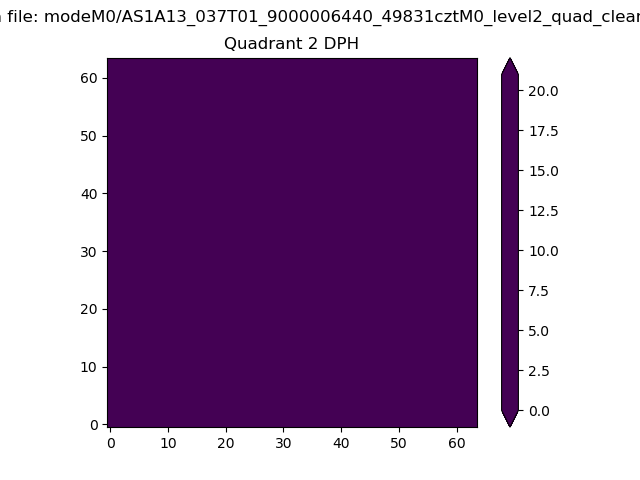
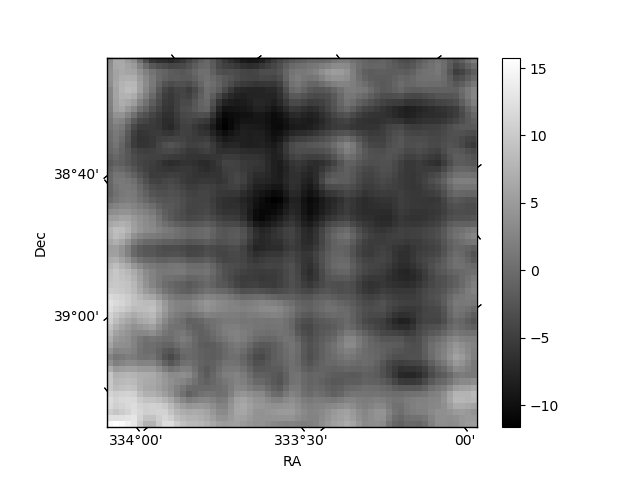
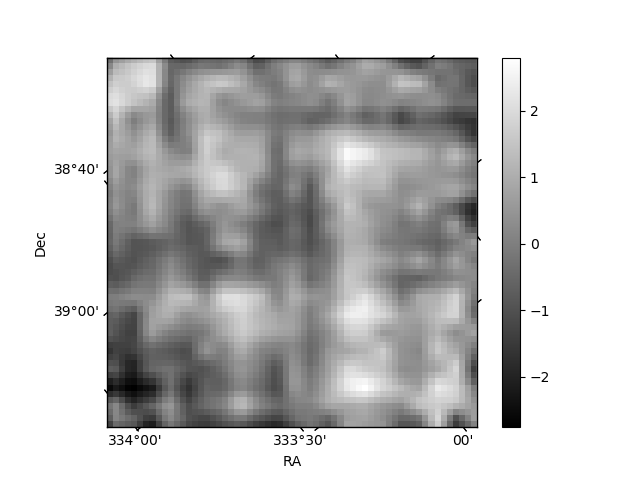
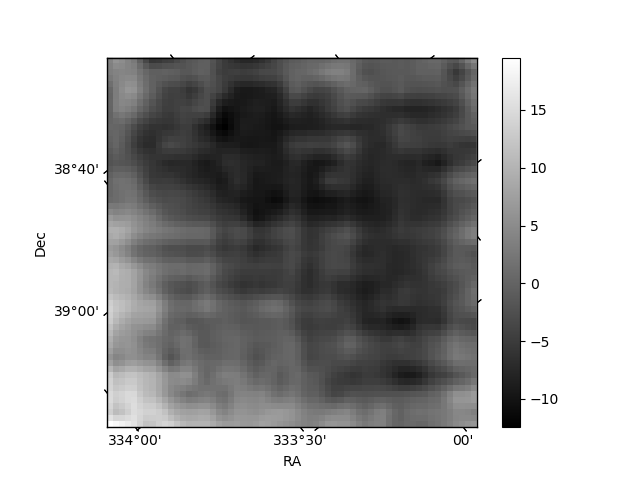
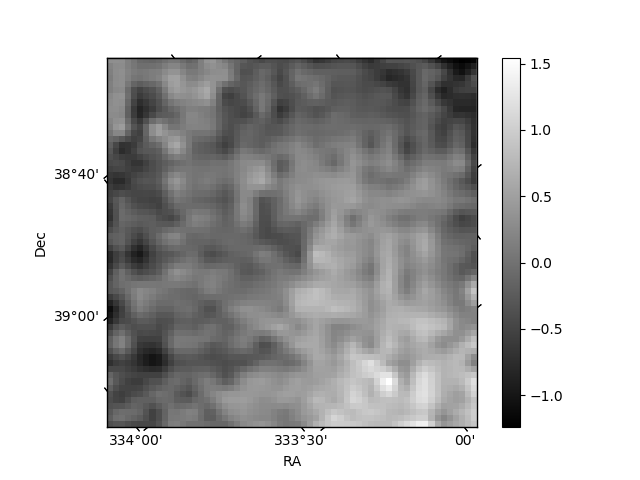
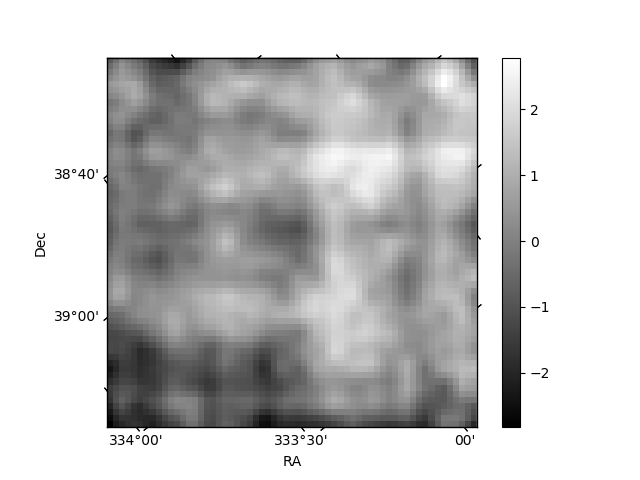
Histogram calculated using DETX and DETY for each event in the final _common_clean file
| Quadrant A | 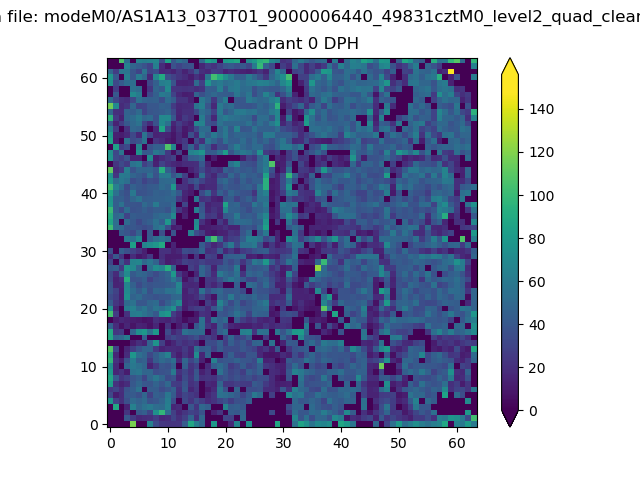 |
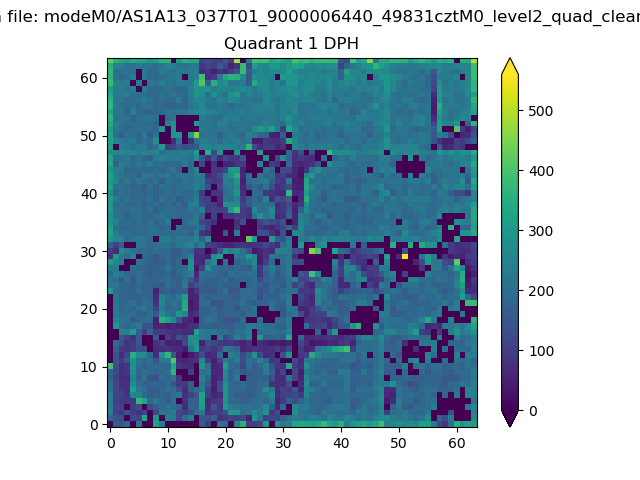 |
Quadrant B |
|---|---|---|---|
| Quadrant D | 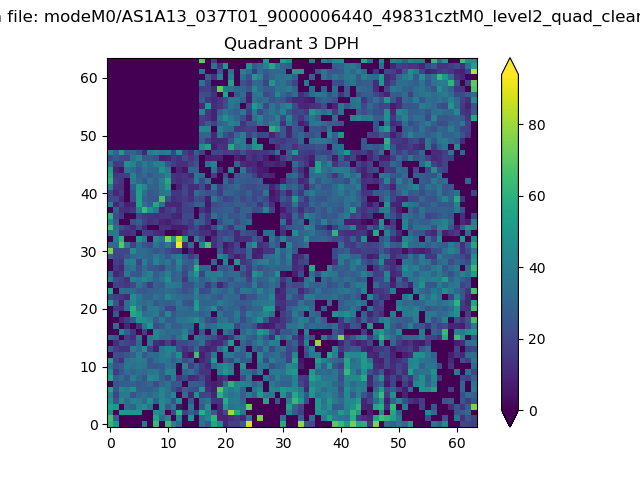 |
 |
Quadrant C |
| Plot type | Count rate plots | Images |
|---|---|---|
| Comparison with Poisson distribution Blue bars denote a histogram of data divided into 1 sec bins. Red curve is a Poisson curve with rate = median count rate of data. |
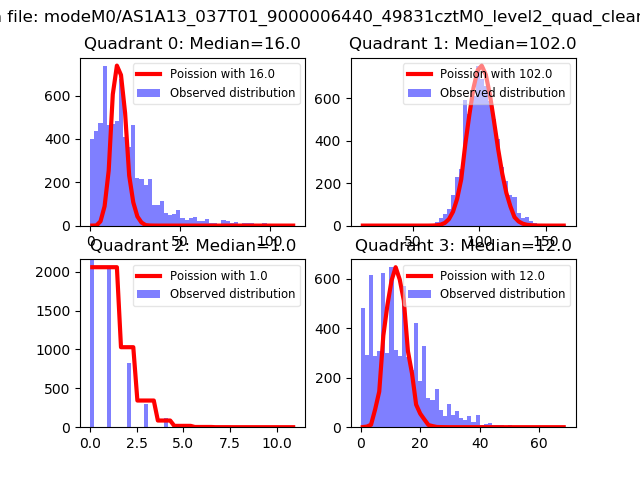 |
 |
| Quadrant-wise count rates Data is divided into 100 sec bins |
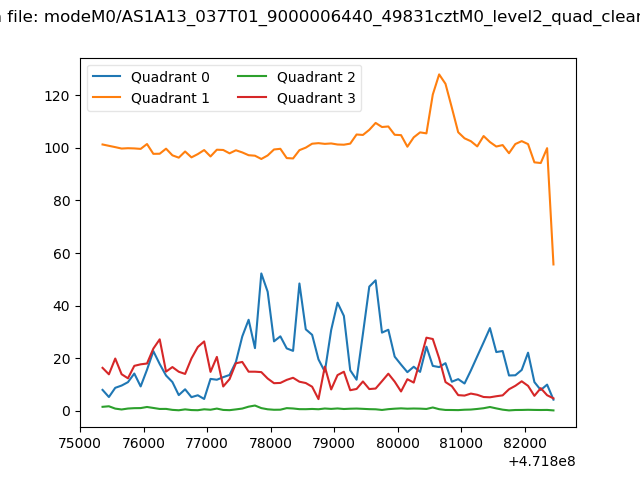 |
|
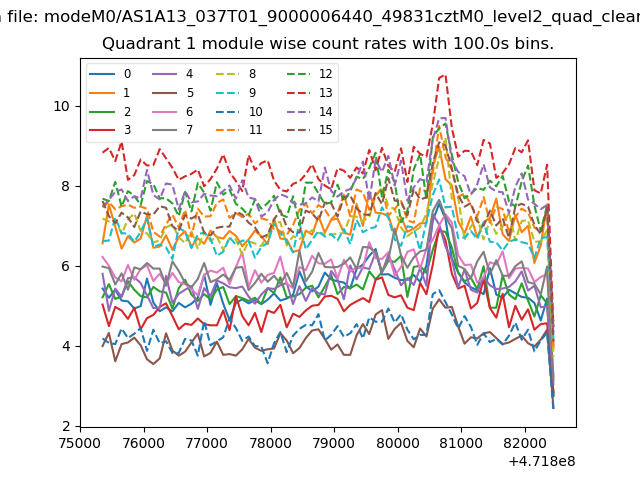
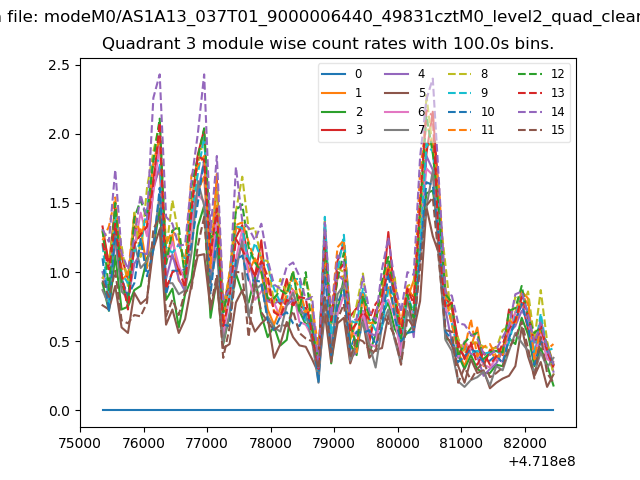
| Module-wise count rates for Quadrant A Data is divided into 100 sec bins |
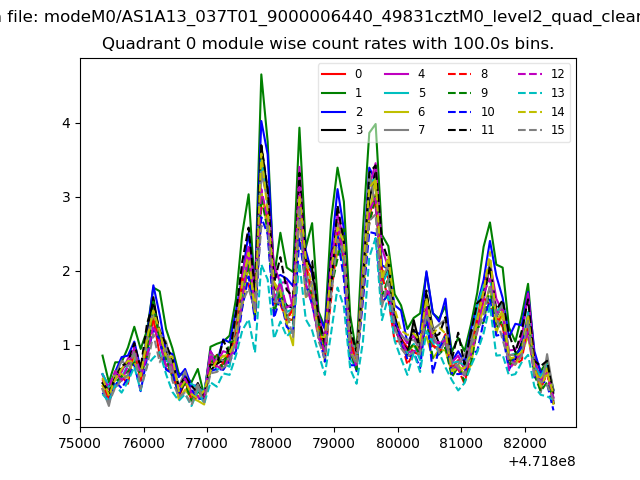 |
 |
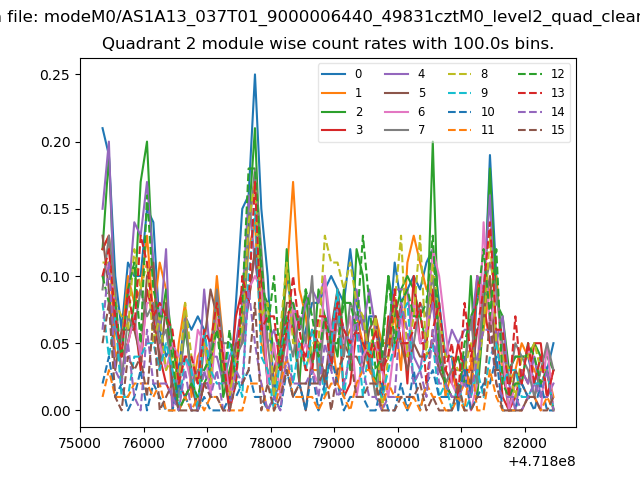
| Module-wise count rates for Quadrant B Data is divided into 100 sec bins |
 |
 |
| Module-wise count rates for Quadrant C Data is divided into 100 sec bins |
 |
 |
| Module-wise count rates for Quadrant D Data is divided into 100 sec bins |
 |
 |
| Parameter | Plot |
|---|---|
| CZT HV Monitor |  |
| D_VDD | 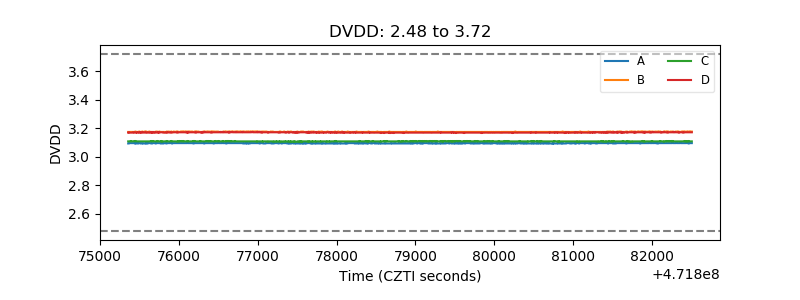 |
| Temperature 1 | 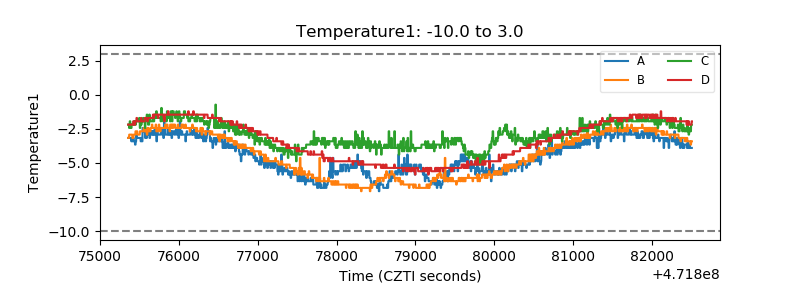 |
| Veto HV Monitor | 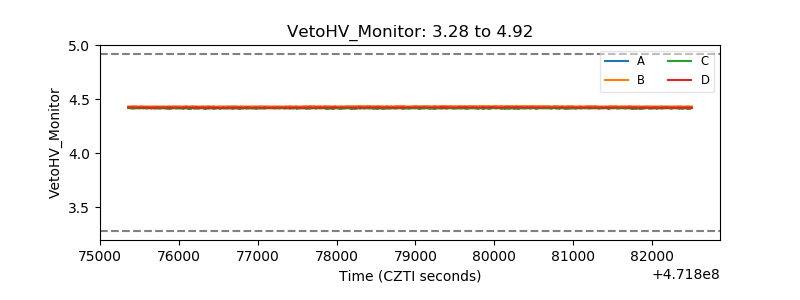 |
| Veto LLD | 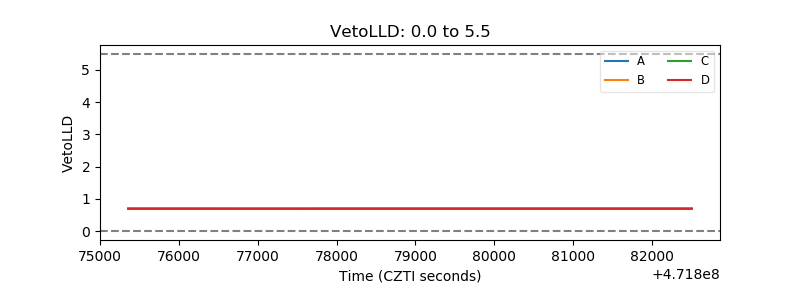 |
| Alpha Counter | 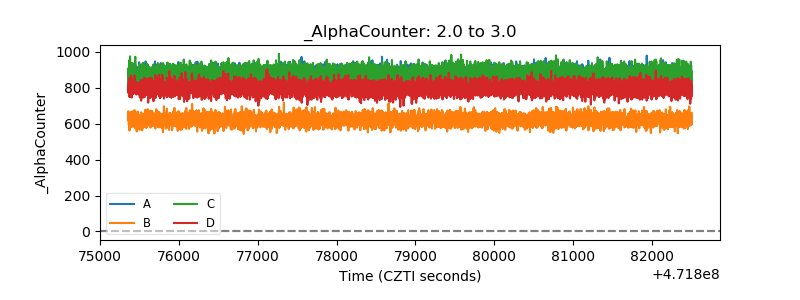 |
| _CPM_Rate | 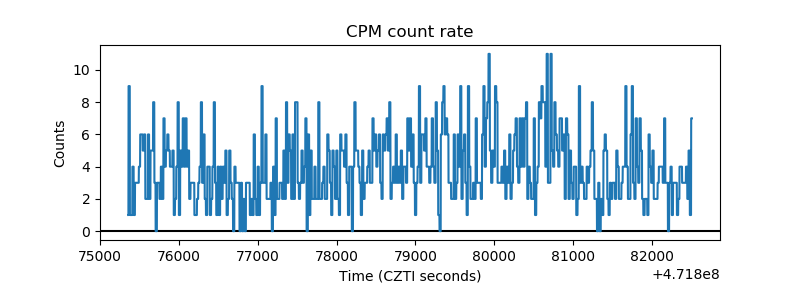 |
| CZT Counter | 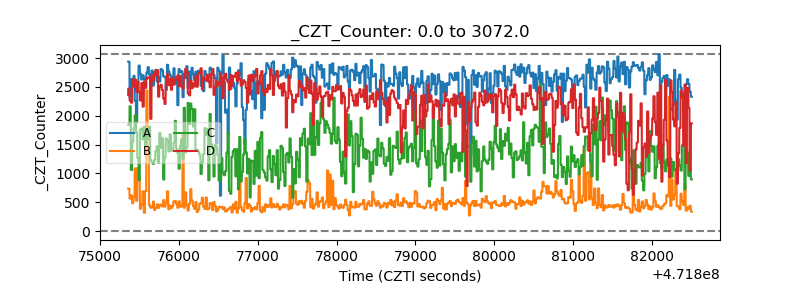 |
| +2.5 Volts monitor | 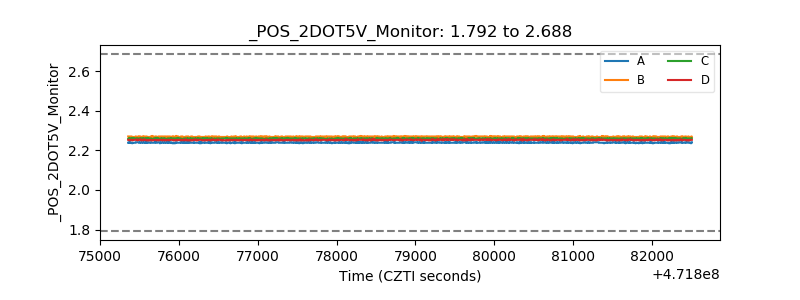 |
| +5 Volts monitor | 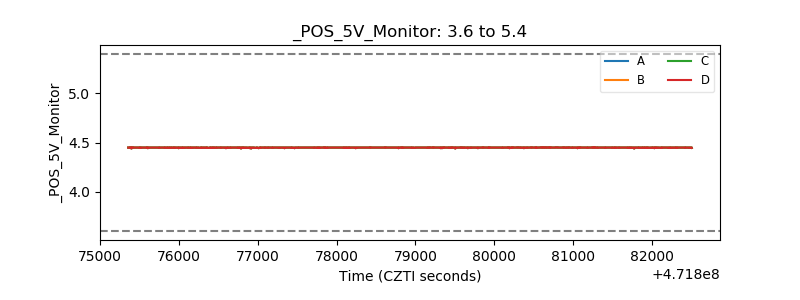 |
| _ROLL_ROT | 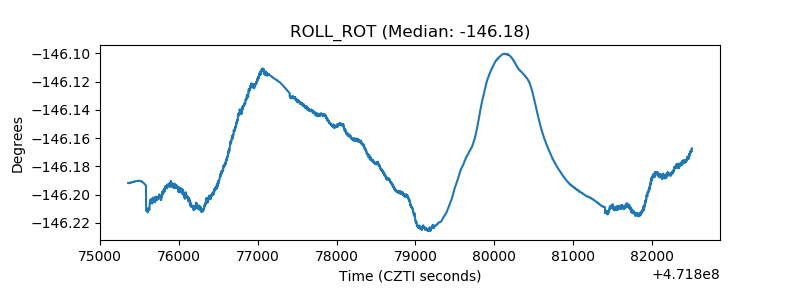 |
| _Roll_DEC | 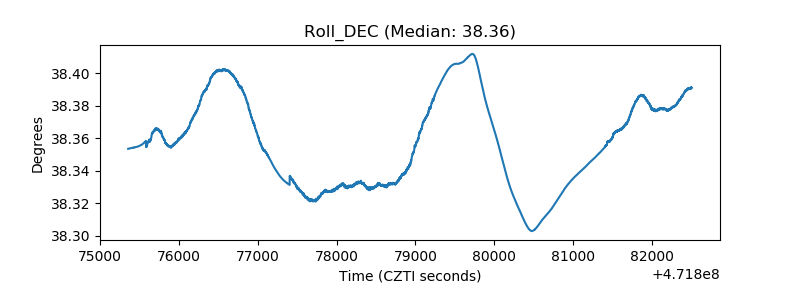 |
| _Roll_RA | 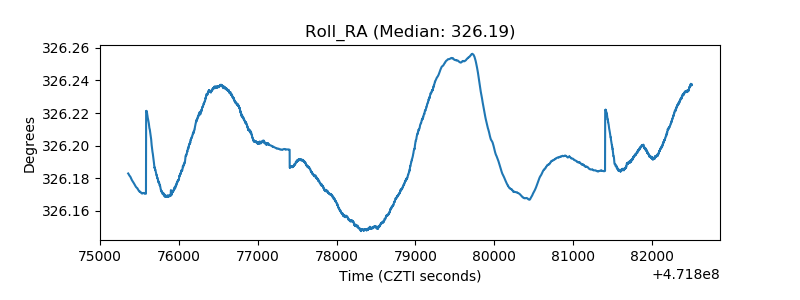 |
| Veto Counter | 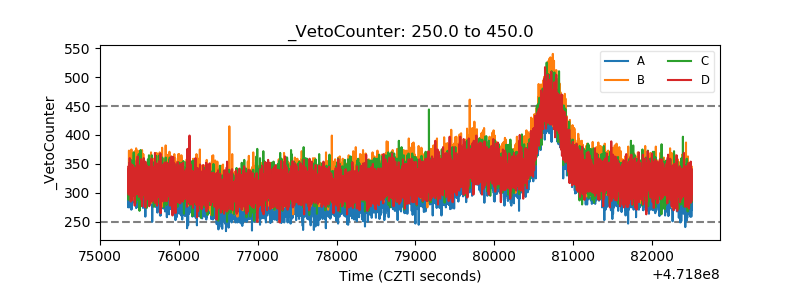 |