| Param | Original file | Final file |
|---|---|---|
| Filename | modeM0/AS1A13_037T01_9000006440_49834cztM0_level2.fits | modeM0/AS1A13_037T01_9000006440_49834cztM0_level2_quad_clean.evt |
| Size (bytes) | 3,339,803,520 | 128,615,040 |
| Size | 3.1 GB | 122.7 MB |
| Events in quadrant A | 36,690,585 | 744,338 |
| Events in quadrant B | 11,497,840 | 1,827,258 |
| Events in quadrant C | 32,669,508 | 11,672 |
| Events in quadrant D | 41,331,664 | 23,447 |
| Mode M9 | |||
|---|---|---|---|
| Quadrant | BADHDUFLAG | Total packets | Discarded packets |
| A | 0 | 13 | 0 |
| B | 0 | 13 | 0 |
| C | 0 | 13 | 0 |
| D | 0 | 13 | 0 |
| Mode SS | |||
|---|---|---|---|
| Quadrant | BADHDUFLAG | Total packets | Discarded packets |
| A | 0 | 378 | 0 |
| B | 0 | 378 | 0 |
| C | 0 | 378 | 0 |
| D | 0 | 378 | 0 |
| Mode M0 | |||
|---|---|---|---|
| Quadrant | BADHDUFLAG | Total packets | Discarded packets |
| A | 0 | 121939 | 4 |
| B | 0 | 47099 | 4 |
| C | 0 | 110082 | 4 |
| D | 0 | 135542 | 4 |
| Quadrant | Total seconds | Saturated seconds | Saturation percentage |
|---|---|---|---|
| A | 18669 | 10997 | 58.905137% |
| B | 18670 | 676 | 3.620782% |
| C | 18670 | 18577 | 99.501875% |
| D | 18670 | 18482 | 98.993037% |
Noise dominated data is calculated using 1-second bins in cleaned event files. If a bin has >2000 counts, and if more than 50% of those come from <1% of pixels, then it is considered to be noise-dominated and hence unusable.
| Quadrant | # 1 sec bins | Bins with >0 counts | Bins with >2000 counts | High rate bins dominated by noise | Noise dominated (total time) | Noise dominated (detector-on time) | Marked lightcurve |
|---|---|---|---|---|---|---|---|
| A | 19839 | 18670 | 9519 | 9519 | 47.98% | 50.99% | 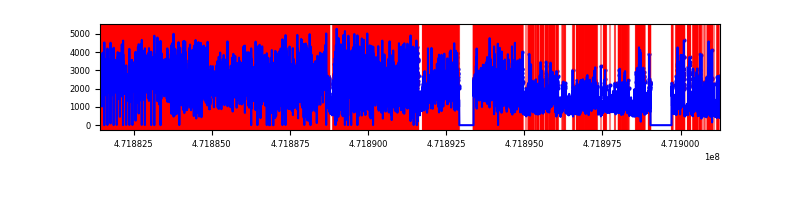 |
| B | 19840 | 18674 | 280 | 280 | 1.41% | 1.50% | 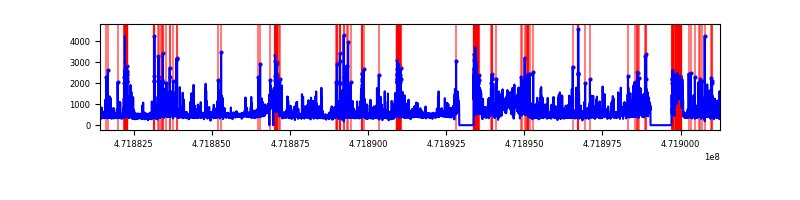 |
| C | 19840 | 18666 | 6348 | 6348 | 32.00% | 34.01% | 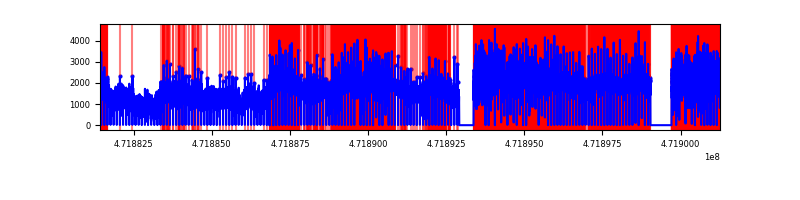 |
| D | 19839 | 18672 | 13347 | 13347 | 67.28% | 71.48% |  |
Top three noisy pixels from each quadrant. If the there are fewer than three noisy pixels in the level2.evt file, extra rows are filled as -1
| Pixel properties | Quadrant properties | ||||||
|---|---|---|---|---|---|---|---|
| Quadrant | DetID | PixID | Counts | Sigma | Mean | Median | Sigma |
| A | 3 | 84 | 9530812 | 25358.73 | 1360 | 1316 | 375.8 |
| A | 4 | 4 | 5923075 | 15758.26 | 1360 | 1316 | 375.8 |
| A | 0 | 98 | 5403485 | 14375.59 | 1360 | 1316 | 375.8 |
| B | 7 | 0 | 1179919 | 2781.0 | 1987 | 1920 | 423.6 |
| B | 0 | 229 | 678240 | 1596.65 | 1987 | 1920 | 423.6 |
| B | 4 | 206 | 575980 | 1355.23 | 1987 | 1920 | 423.6 |
| C | 15 | 230 | 8845709 | 82649.4 | 276 | 267 | 107.0 |
| C | 15 | 197 | 4155944 | 38829.51 | 276 | 267 | 107.0 |
| C | 15 | 179 | 2592048 | 24216.9 | 276 | 267 | 107.0 |
| D | 8 | 129 | 7456096 | 38490.49 | 466 | 437 | 193.7 |
| D | 7 | 61 | 5198618 | 26836.06 | 466 | 437 | 193.7 |
| D | 7 | 126 | 5041248 | 26023.63 | 466 | 437 | 193.7 |
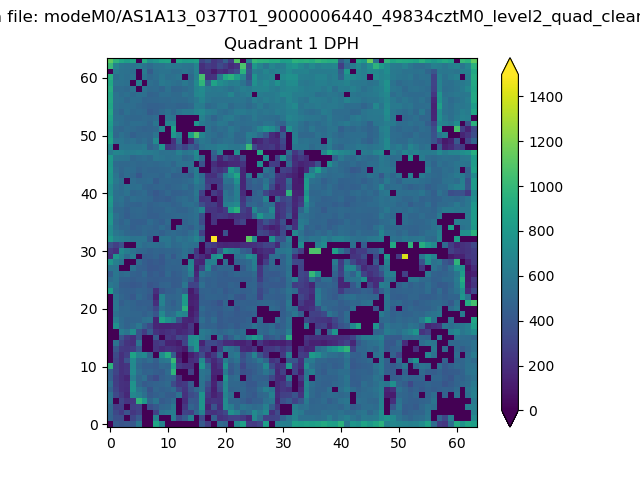
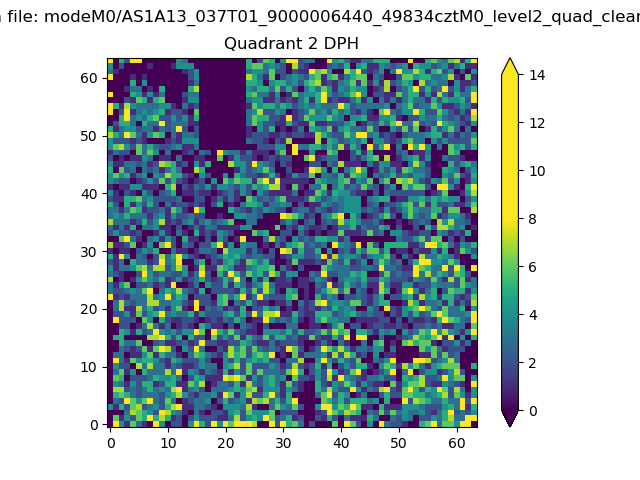
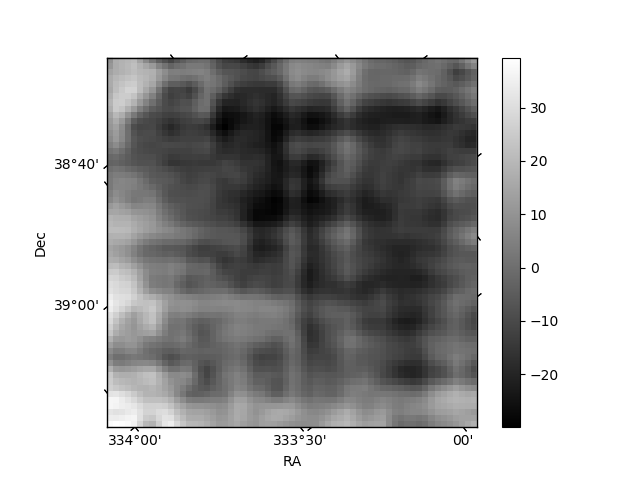
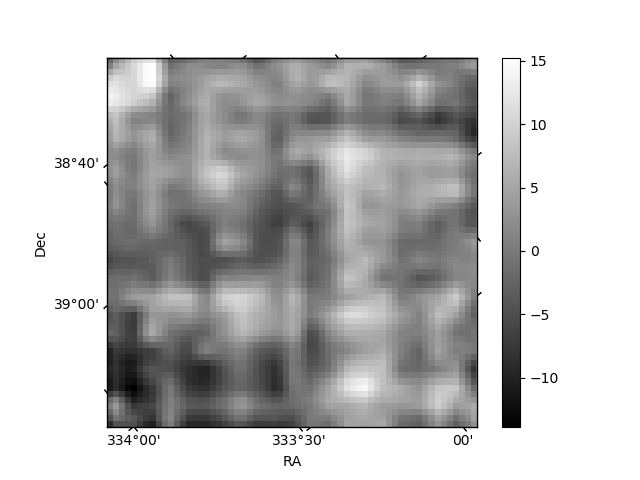
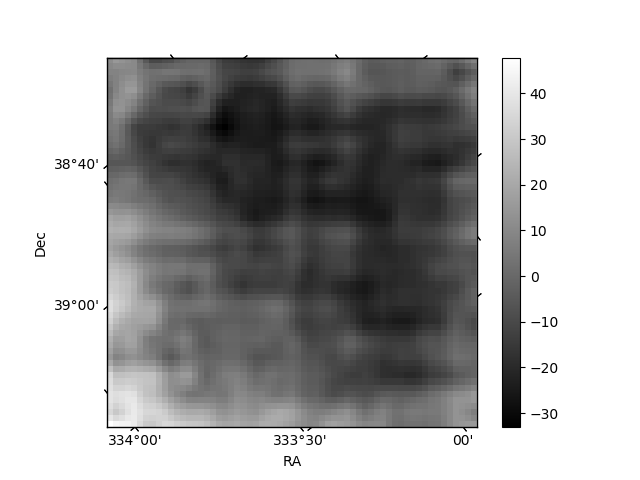
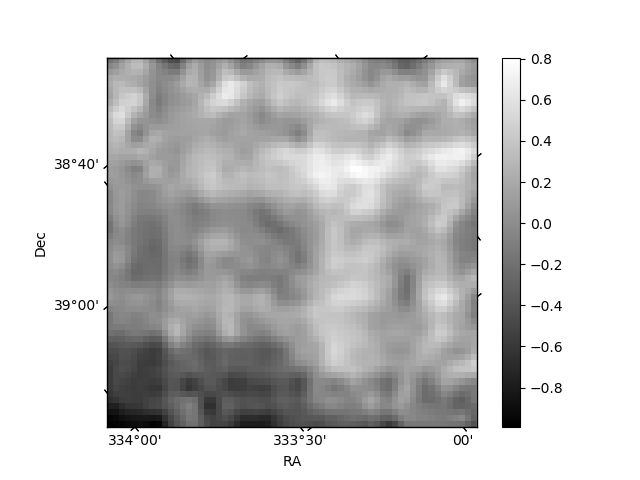
Histogram calculated using DETX and DETY for each event in the final _common_clean file
| Quadrant A | 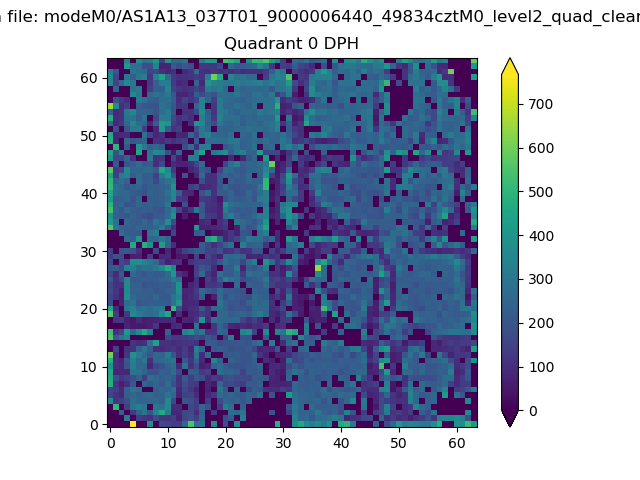 |
 |
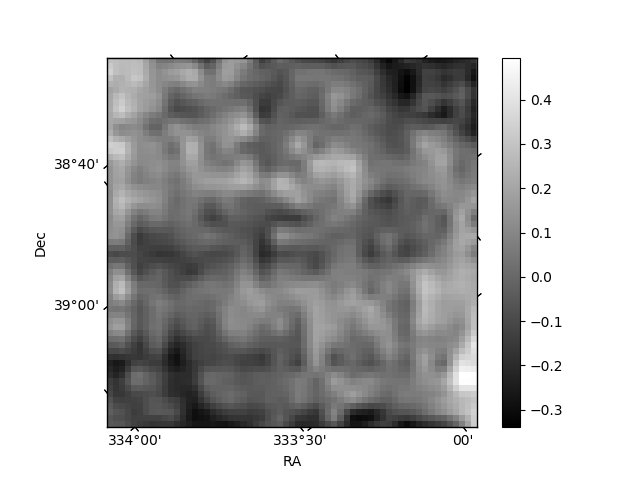
Quadrant B |
|---|---|---|---|
| Quadrant D | 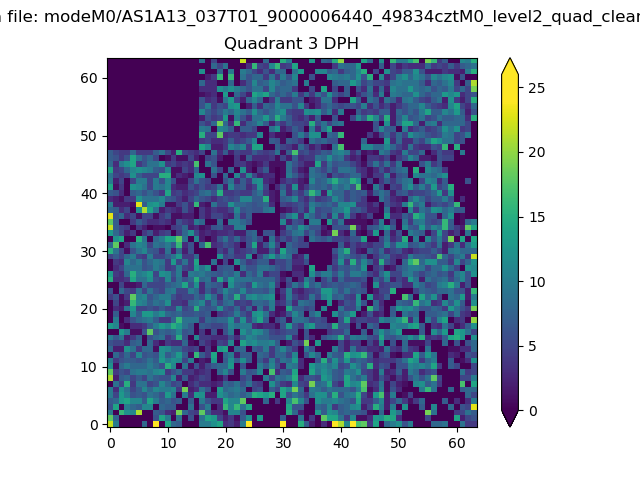 |
 |
Quadrant C |
| Plot type | Count rate plots | Images |
|---|---|---|
| Comparison with Poisson distribution Blue bars denote a histogram of data divided into 1 sec bins. Red curve is a Poisson curve with rate = median count rate of data. |
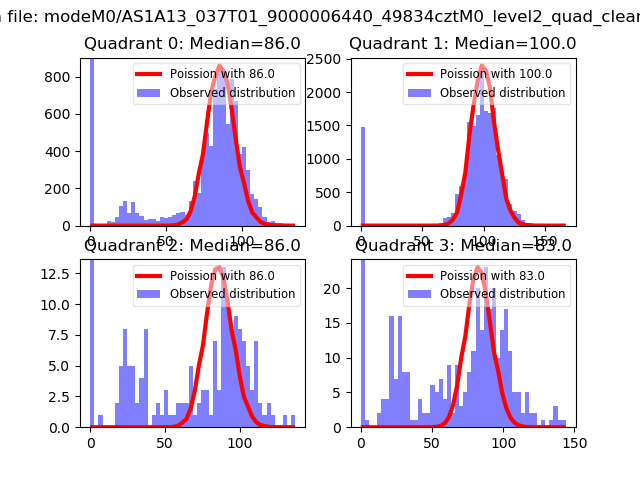 |
 |
| Quadrant-wise count rates Data is divided into 100 sec bins |
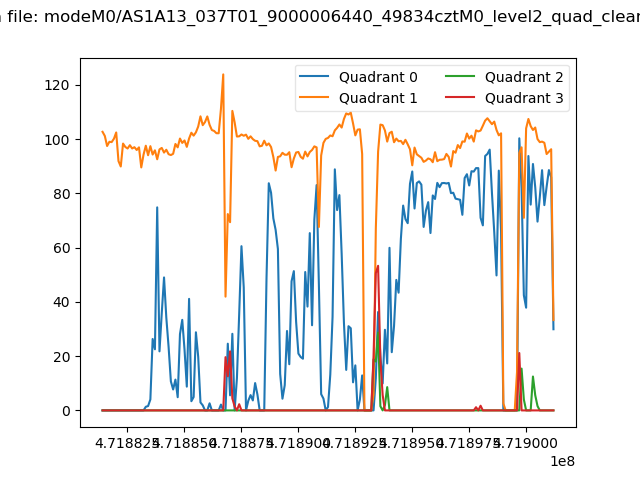 |
|
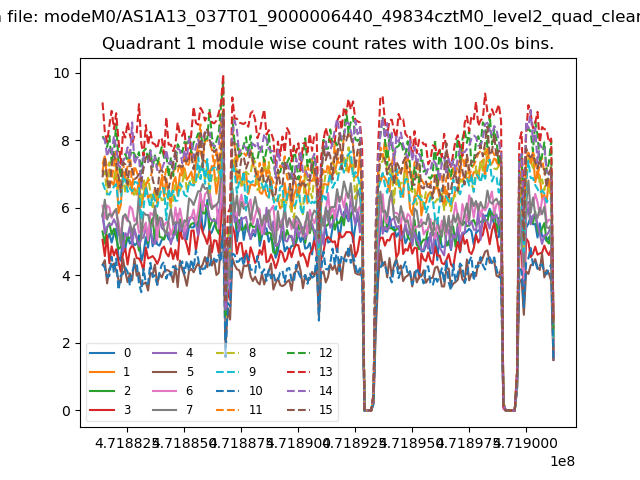
| Module-wise count rates for Quadrant A Data is divided into 100 sec bins |
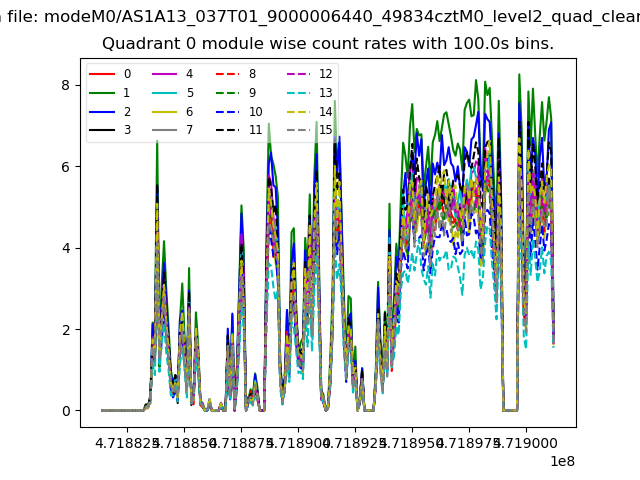 |
 |
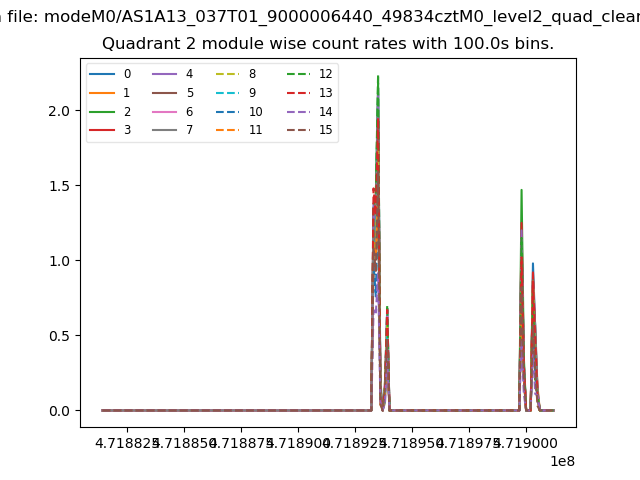
| Module-wise count rates for Quadrant B Data is divided into 100 sec bins |
 |
 |
| Module-wise count rates for Quadrant C Data is divided into 100 sec bins |
 |
 |
| Module-wise count rates for Quadrant D Data is divided into 100 sec bins |
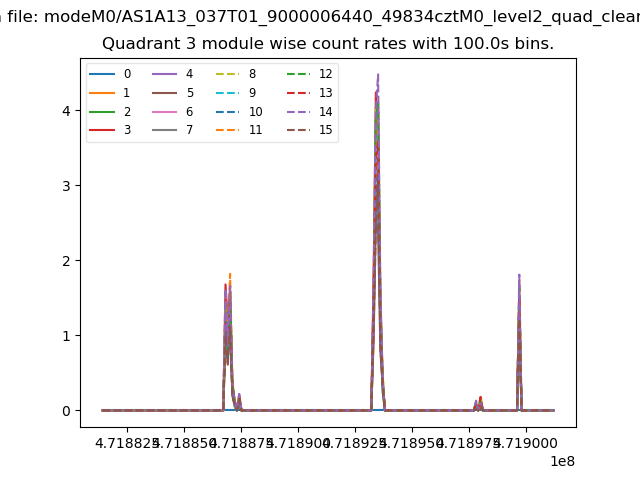 |
 |
| Parameter | Plot |
|---|---|
| CZT HV Monitor | 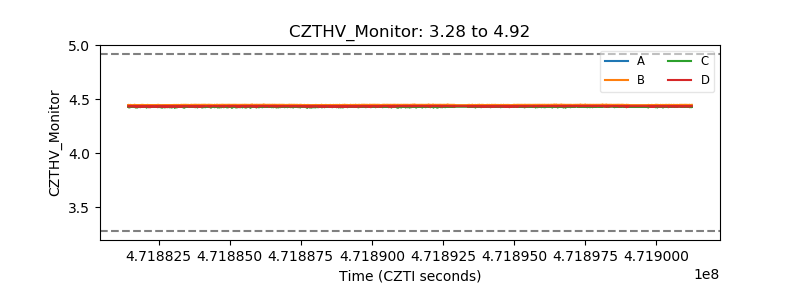 |
| D_VDD | 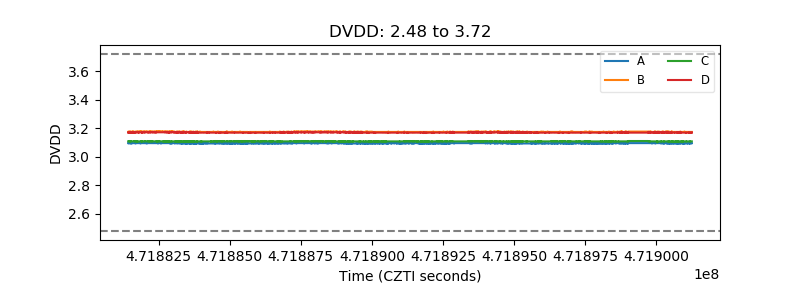 |
| Temperature 1 | 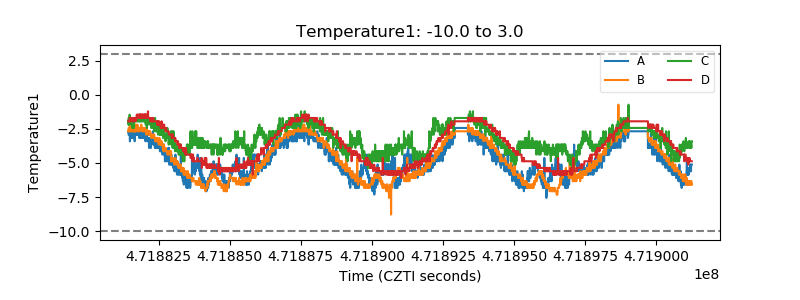 |
| Veto HV Monitor | 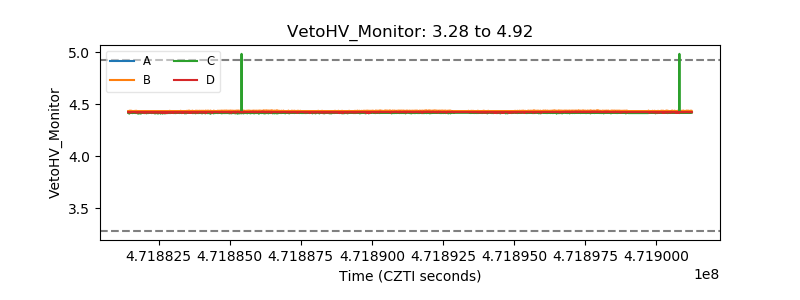 |
| Veto LLD | 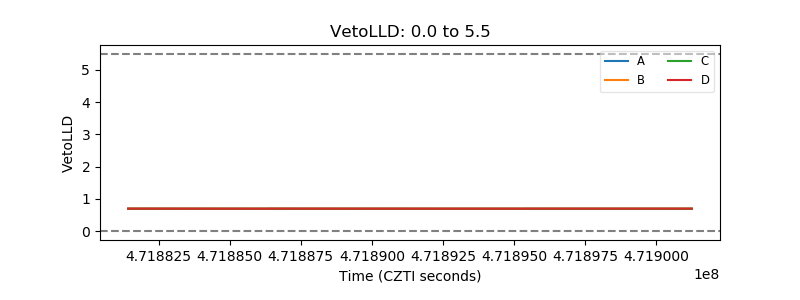 |
| Alpha Counter | 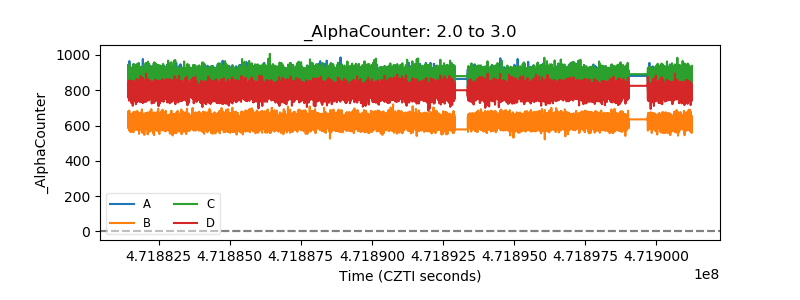 |
| _CPM_Rate | 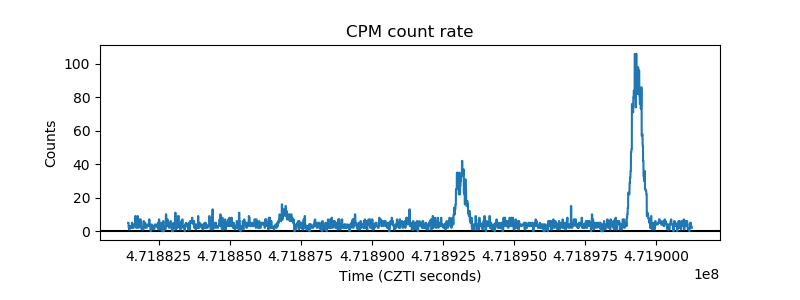 |
| CZT Counter | 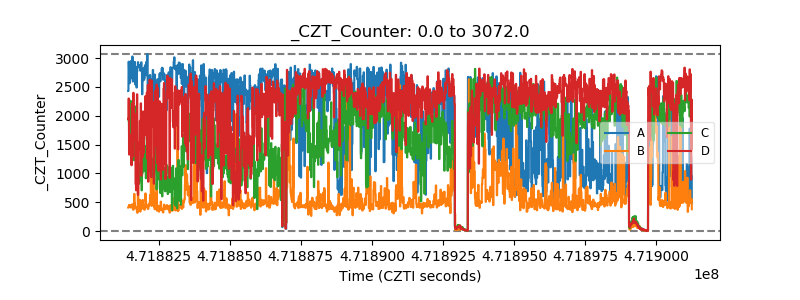 |
| +2.5 Volts monitor | 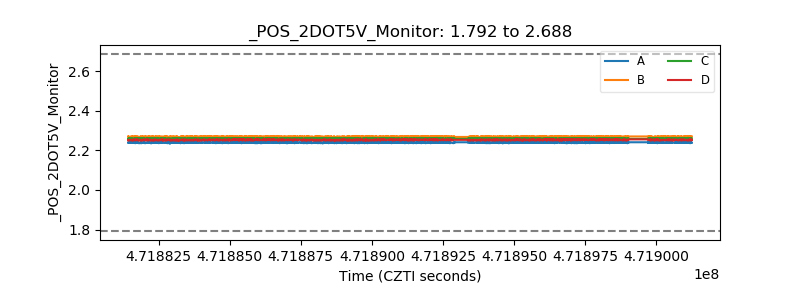 |
| +5 Volts monitor | 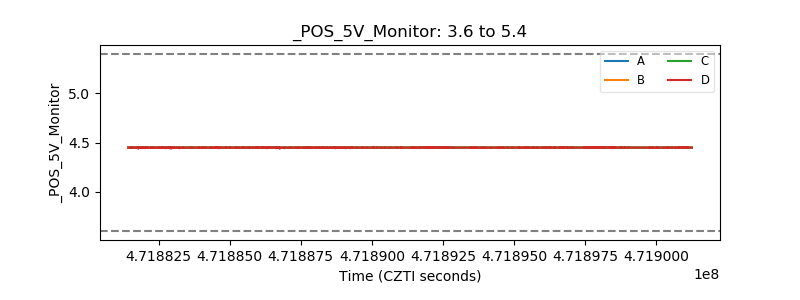 |
| _ROLL_ROT | 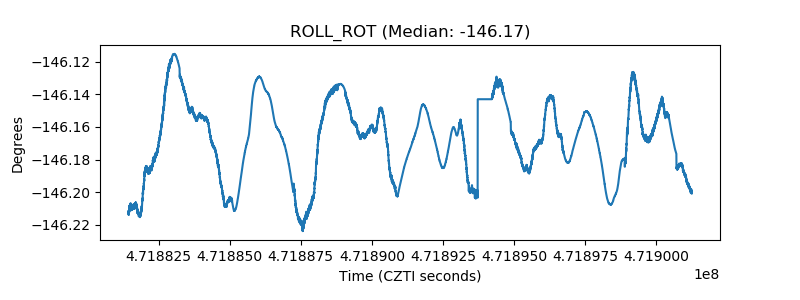 |
| _Roll_DEC | 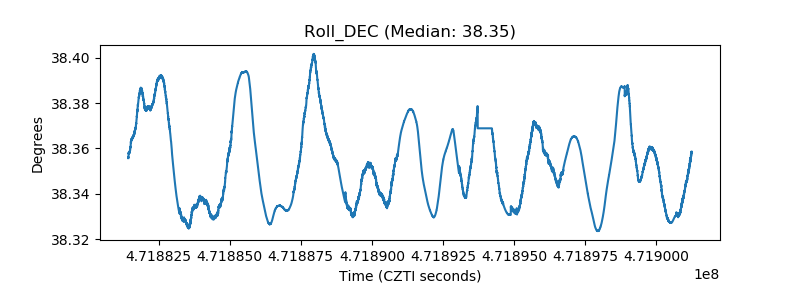 |
| _Roll_RA | 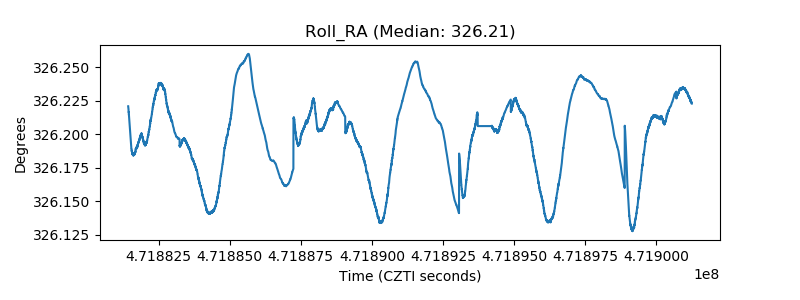 |
| Veto Counter | 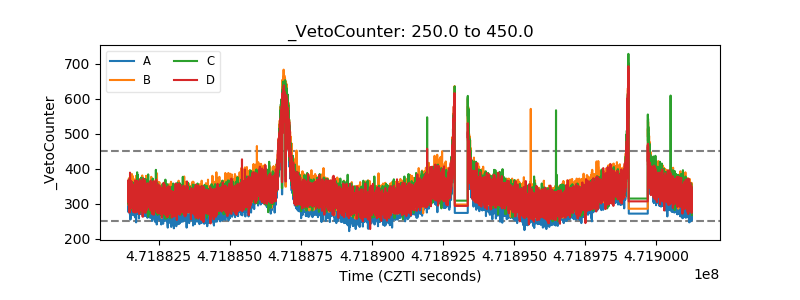 |