| Param | Original file | Final file |
|---|---|---|
| Filename | modeM0/AS1A13_037T01_9000006440_49835cztM0_level2.fits | modeM0/AS1A13_037T01_9000006440_49835cztM0_level2_quad_clean.evt |
| Size (bytes) | 1,010,566,080 | 57,738,240 |
| Size | 963.8 MB | 55.1 MB |
| Events in quadrant A | 7,402,646 | 515,809 |
| Events in quadrant B | 3,596,582 | 613,552 |
| Events in quadrant C | 11,521,495 | 94,821 |
| Events in quadrant D | 14,415,254 | 92,846 |
| Mode M9 | |||
|---|---|---|---|
| Quadrant | BADHDUFLAG | Total packets | Discarded packets |
| A | 0 | 9 | 0 |
| B | 0 | 9 | 0 |
| C | 0 | 9 | 0 |
| D | 0 | 9 | 0 |
| Mode SS | |||
|---|---|---|---|
| Quadrant | BADHDUFLAG | Total packets | Discarded packets |
| A | 0 | 122 | 0 |
| B | 0 | 122 | 0 |
| C | 0 | 122 | 0 |
| D | 0 | 122 | 0 |
| Mode M0 | |||
|---|---|---|---|
| Quadrant | BADHDUFLAG | Total packets | Discarded packets |
| A | 0 | 26252 | 0 |
| B | 0 | 14881 | 0 |
| C | 0 | 38400 | 0 |
| D | 0 | 46989 | 0 |
| Quadrant | Total seconds | Saturated seconds | Saturation percentage |
|---|---|---|---|
| A | 6089 | 1142 | 18.755132% |
| B | 6089 | 109 | 1.790113% |
| C | 6090 | 6019 | 98.834154% |
| D | 6089 | 6089 | 100.000000% |
Noise dominated data is calculated using 1-second bins in cleaned event files. If a bin has >2000 counts, and if more than 50% of those come from <1% of pixels, then it is considered to be noise-dominated and hence unusable.
| Quadrant | # 1 sec bins | Bins with >0 counts | Bins with >2000 counts | High rate bins dominated by noise | Noise dominated (total time) | Noise dominated (detector-on time) | Marked lightcurve |
|---|---|---|---|---|---|---|---|
| A | 6979 | 6090 | 956 | 956 | 13.70% | 15.70% | 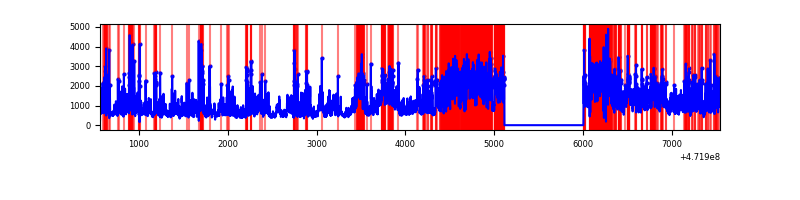 |
| B | 6979 | 6090 | 62 | 62 | 0.89% | 1.02% | 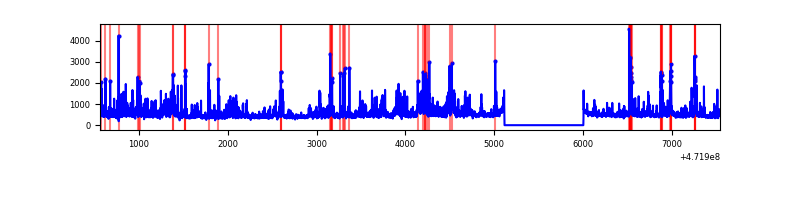 |
| C | 6979 | 6089 | 2460 | 2460 | 35.25% | 40.40% | 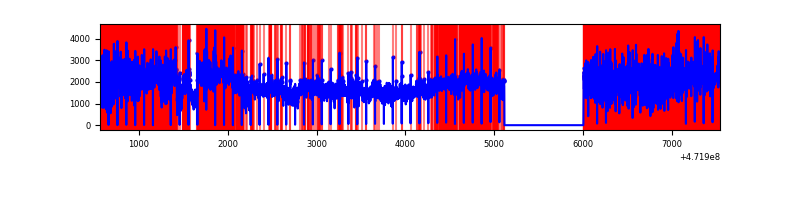 |
| D | 6978 | 6088 | 5341 | 5341 | 76.54% | 87.73% | 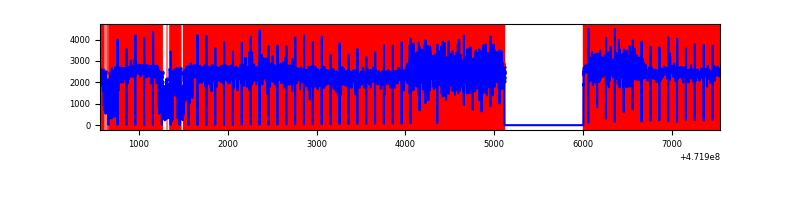 |
Top three noisy pixels from each quadrant. If the there are fewer than three noisy pixels in the level2.evt file, extra rows are filled as -1
| Pixel properties | Quadrant properties | ||||||
|---|---|---|---|---|---|---|---|
| Quadrant | DetID | PixID | Counts | Sigma | Mean | Median | Sigma |
| A | 0 | 98 | 1187877 | 7840.5 | 595 | 580 | 151.4 |
| A | 4 | 4 | 897871 | 5925.4 | 595 | 580 | 151.4 |
| A | 15 | 191 | 399116 | 2631.8 | 595 | 580 | 151.4 |
| B | 10 | 28 | 296098 | 2150.32 | 641 | 620 | 137.4 |
| B | 0 | 229 | 175226 | 1270.68 | 641 | 620 | 137.4 |
| B | 10 | 44 | 130178 | 942.85 | 641 | 620 | 137.4 |
| C | 15 | 230 | 4655436 | 106485.04 | 125 | 122 | 43.7 |
| C | 15 | 197 | 1044205 | 23882.22 | 125 | 122 | 43.7 |
| C | 15 | 174 | 999914 | 22869.11 | 125 | 122 | 43.7 |
| D | 8 | 176 | 5791218 | 102643.49 | 131 | 123 | 56.4 |
| D | 7 | 61 | 1888642 | 33472.8 | 131 | 123 | 56.4 |
| D | 8 | 129 | 1784309 | 31623.57 | 131 | 123 | 56.4 |
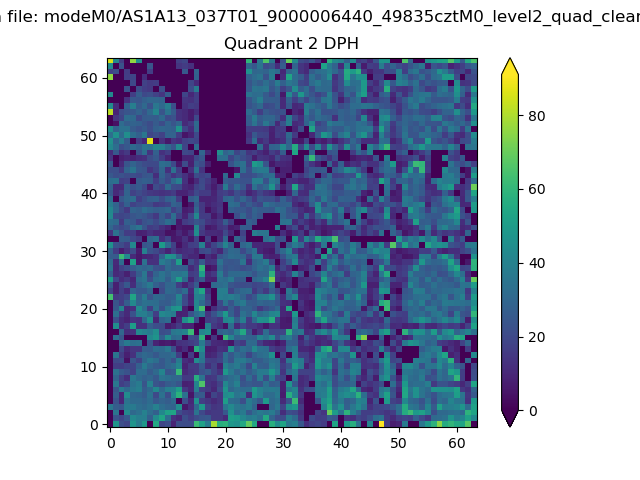
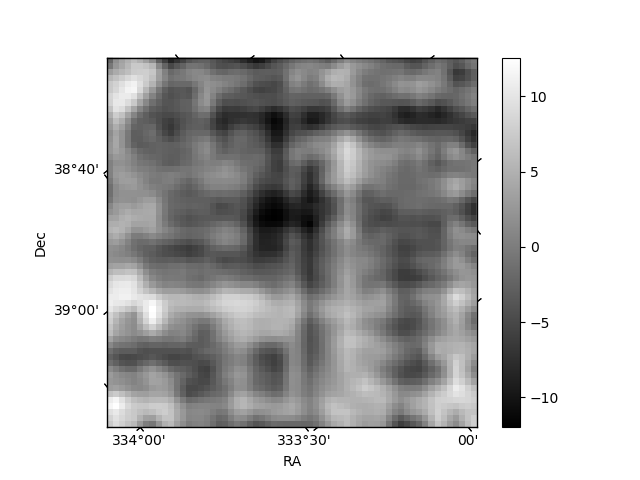
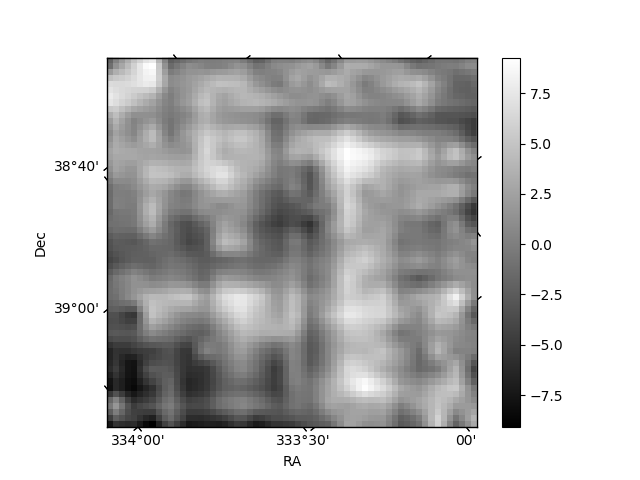
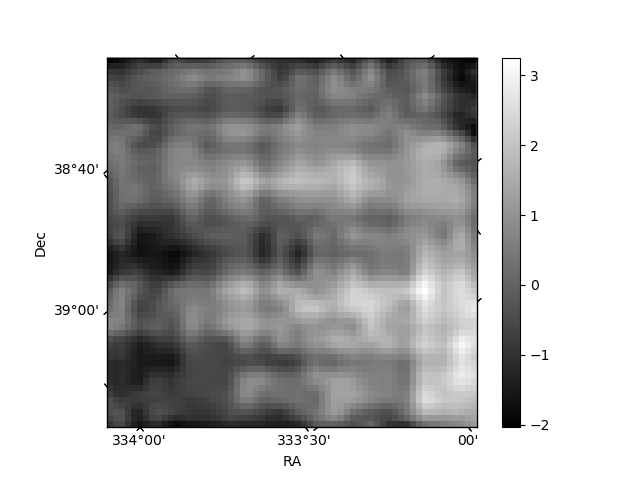
Histogram calculated using DETX and DETY for each event in the final _common_clean file
| Quadrant A | 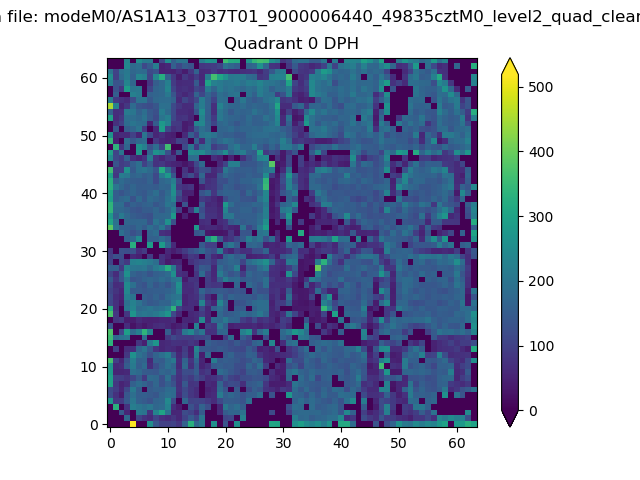 |
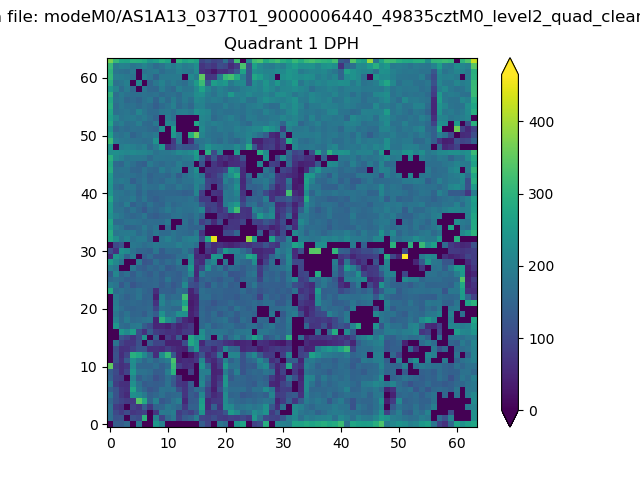 |
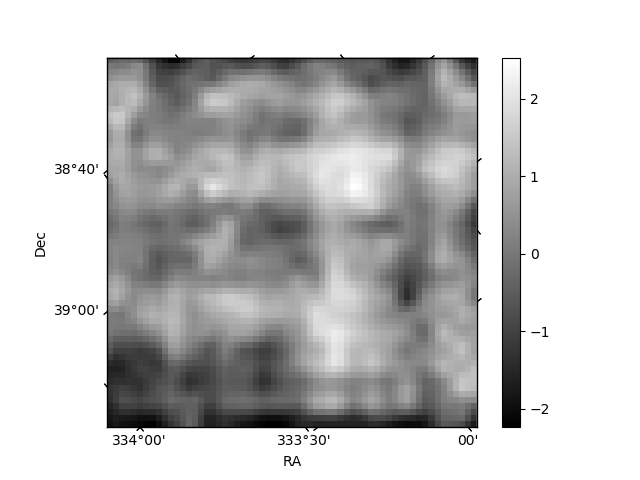
Quadrant B |
|---|---|---|---|
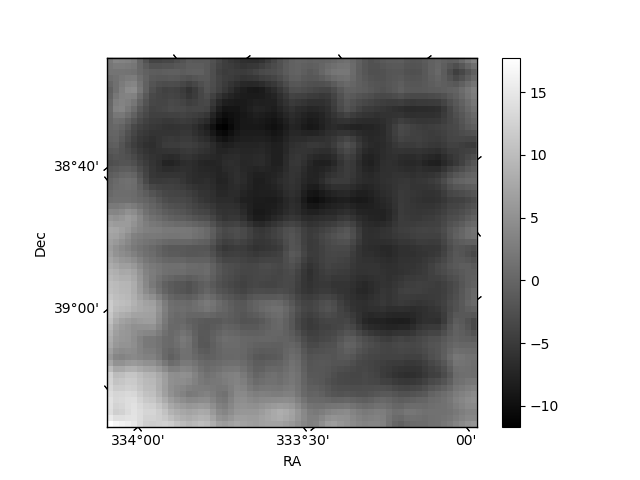
| Quadrant D | 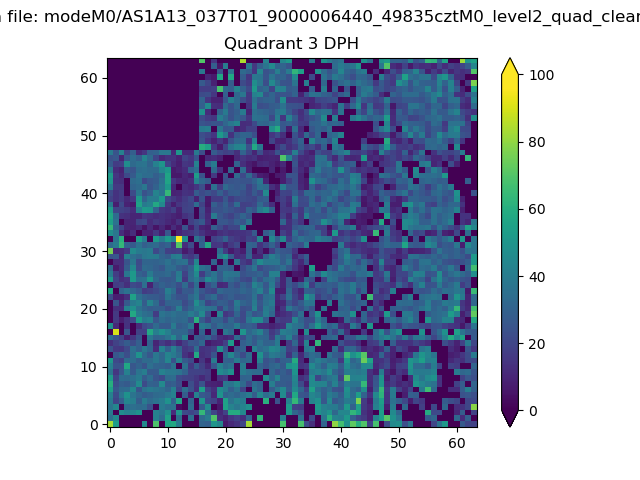 |
 |
Quadrant C |
| Plot type | Count rate plots | Images |
|---|---|---|
| Comparison with Poisson distribution Blue bars denote a histogram of data divided into 1 sec bins. Red curve is a Poisson curve with rate = median count rate of data. |
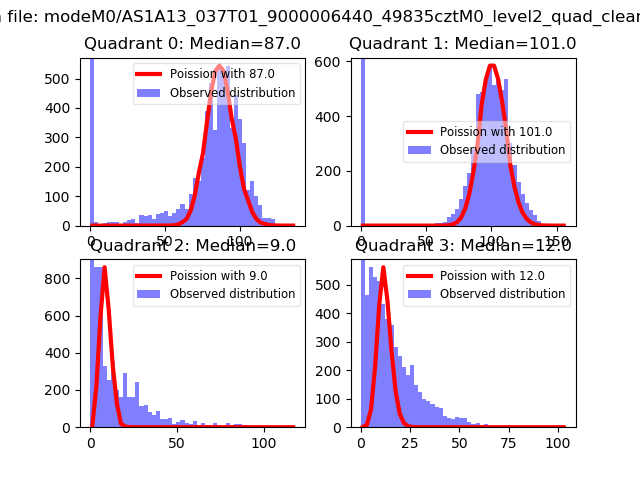 |
 |
| Quadrant-wise count rates Data is divided into 100 sec bins |
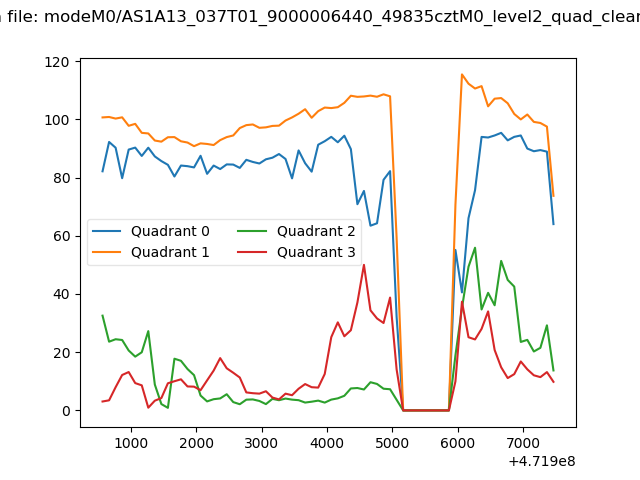 |
|
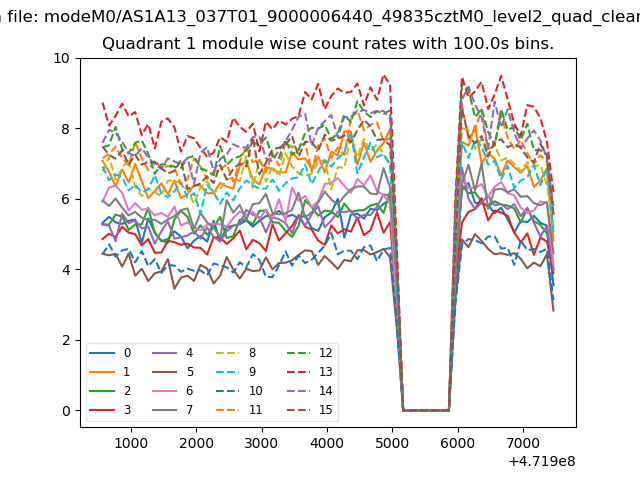
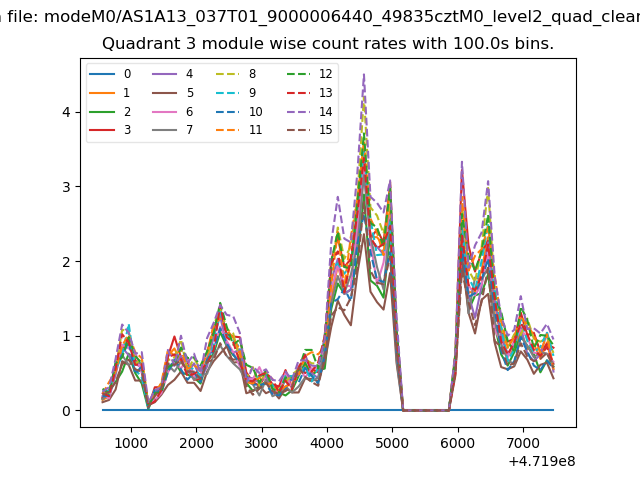
| Module-wise count rates for Quadrant A Data is divided into 100 sec bins |
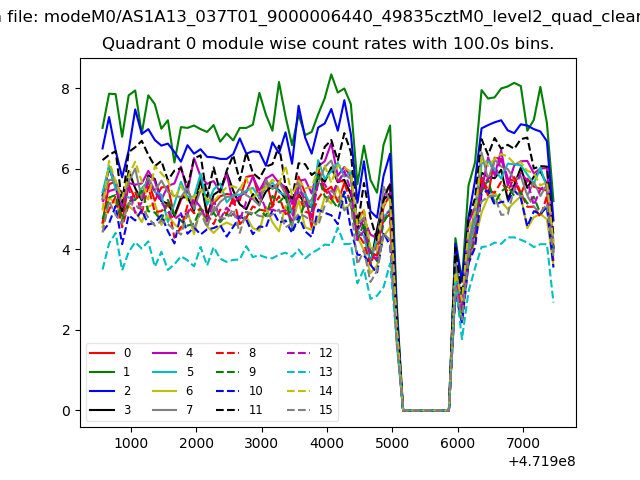 |
 |
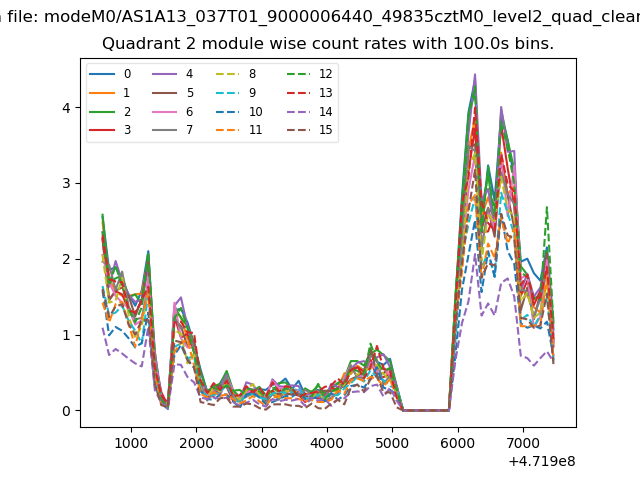
| Module-wise count rates for Quadrant B Data is divided into 100 sec bins |
 |
 |
| Module-wise count rates for Quadrant C Data is divided into 100 sec bins |
 |
 |
| Module-wise count rates for Quadrant D Data is divided into 100 sec bins |
 |
 |
| Parameter | Plot |
|---|---|
| CZT HV Monitor | 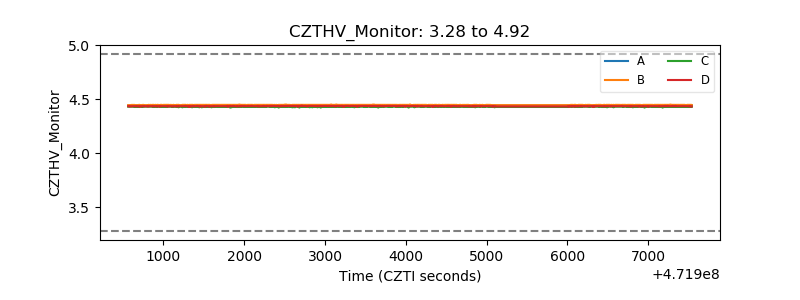 |
| D_VDD | 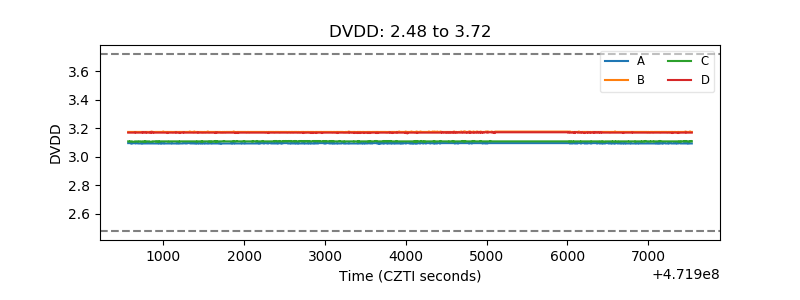 |
| Temperature 1 | 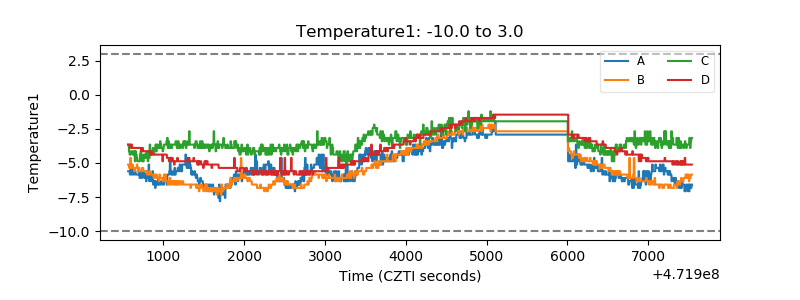 |
| Veto HV Monitor | 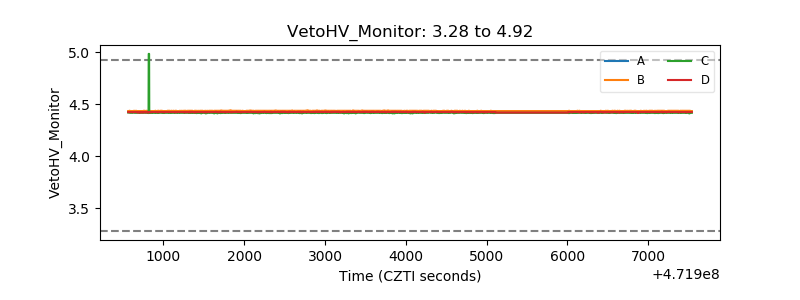 |
| Veto LLD | 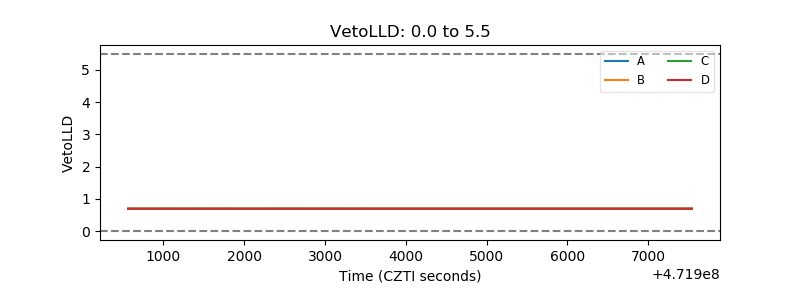 |
| Alpha Counter | 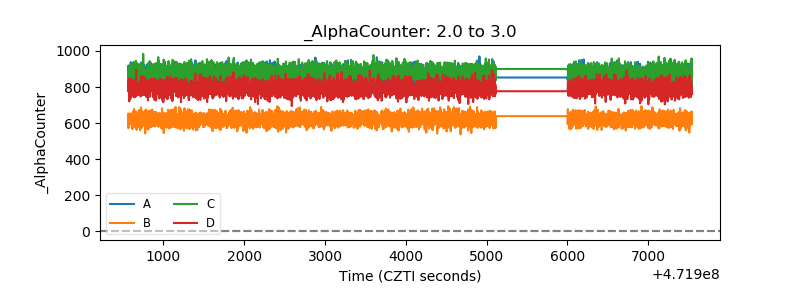 |
| _CPM_Rate | 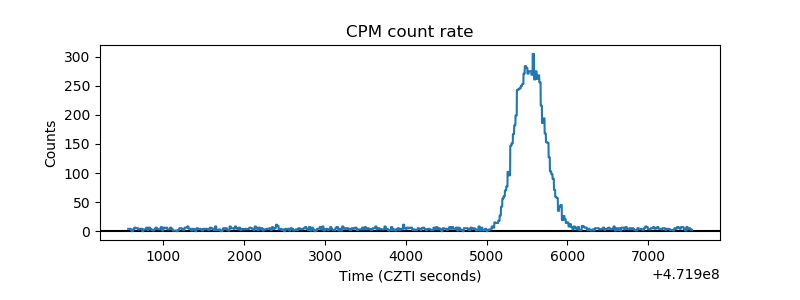 |
| CZT Counter | 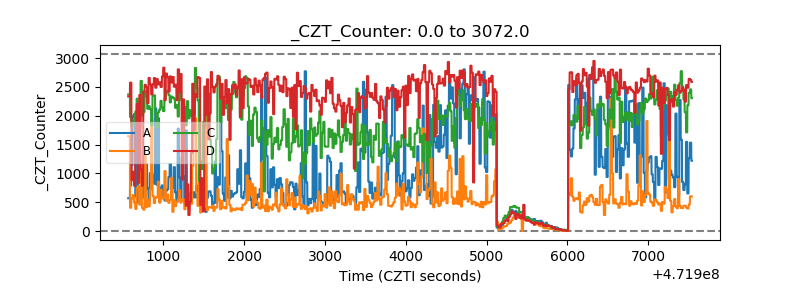 |
| +2.5 Volts monitor | 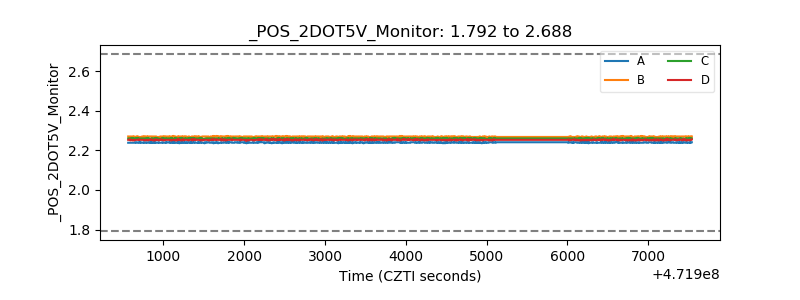 |
| +5 Volts monitor | 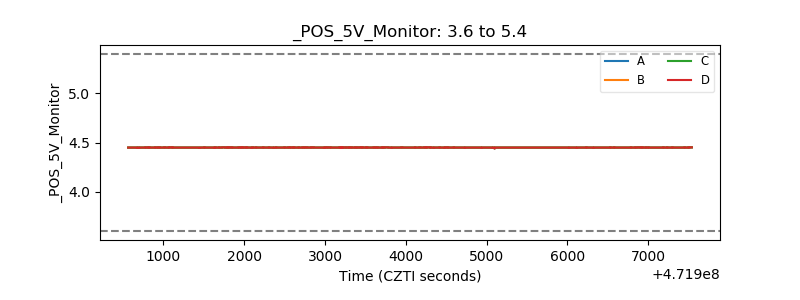 |
| _ROLL_ROT | 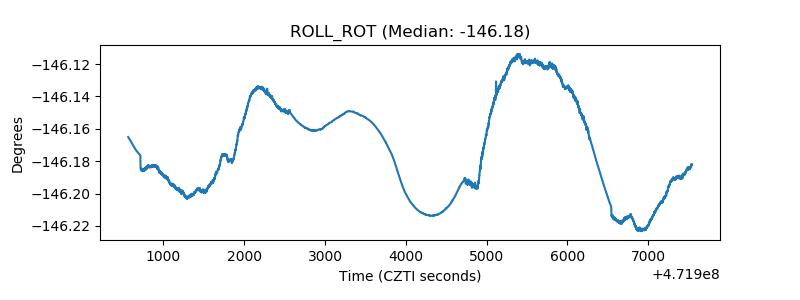 |
| _Roll_DEC | 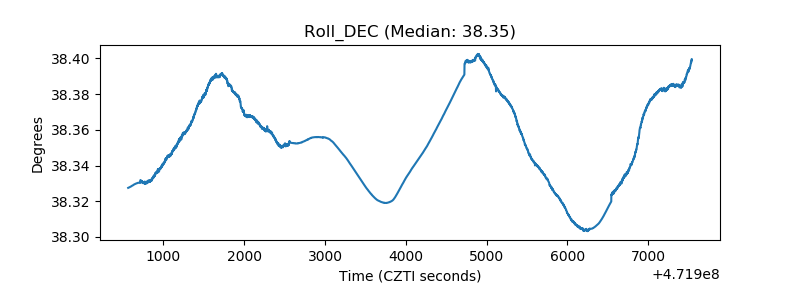 |
| _Roll_RA | 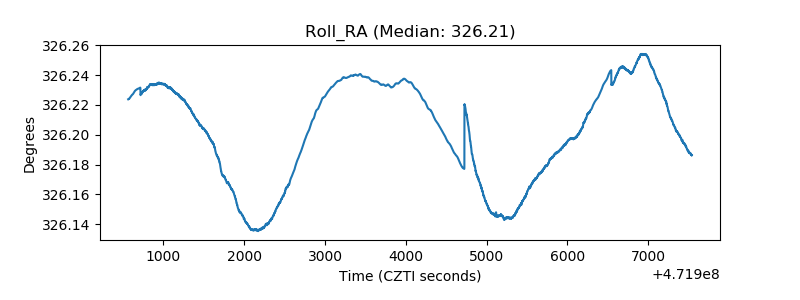 |
| Veto Counter | 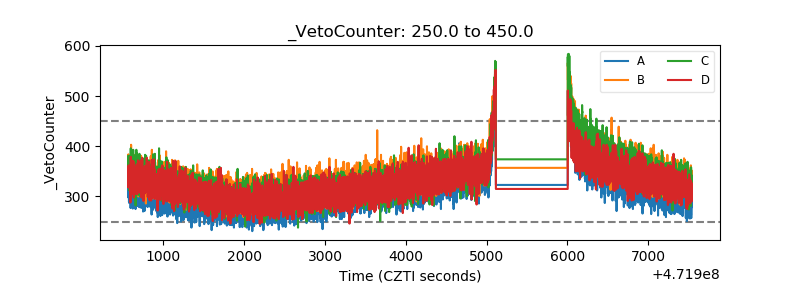 |