| Param | Original file | Final file |
|---|---|---|
| Filename | modeM0/AS1A13_037T01_9000006440_49837cztM0_level2.fits | modeM0/AS1A13_037T01_9000006440_49837cztM0_level2_quad_clean.evt |
| Size (bytes) | 1,158,768,000 | 41,679,360 |
| Size | 1.1 GB | 39.7 MB |
| Events in quadrant A | 12,742,705 | 184,933 |
| Events in quadrant B | 3,704,537 | 603,311 |
| Events in quadrant C | 11,807,315 | 9,517 |
| Events in quadrant D | 14,179,741 | 47,875 |
| Mode M9 | |||
|---|---|---|---|
| Quadrant | BADHDUFLAG | Total packets | Discarded packets |
| A | 0 | 11 | 0 |
| B | 0 | 11 | 0 |
| C | 0 | 11 | 0 |
| D | 0 | 11 | 0 |
| Mode SS | |||
|---|---|---|---|
| Quadrant | BADHDUFLAG | Total packets | Discarded packets |
| A | 0 | 122 | 0 |
| B | 0 | 122 | 0 |
| C | 0 | 122 | 0 |
| D | 0 | 122 | 0 |
| Mode M0 | |||
|---|---|---|---|
| Quadrant | BADHDUFLAG | Total packets | Discarded packets |
| A | 0 | 41959 | 1 |
| B | 0 | 15070 | 1 |
| C | 0 | 39165 | 1 |
| D | 0 | 46205 | 4 |
| Quadrant | Total seconds | Saturated seconds | Saturation percentage |
|---|---|---|---|
| A | 5951 | 4221 | 70.929256% |
| B | 5951 | 132 | 2.218115% |
| C | 5952 | 5877 | 98.739919% |
| D | 5951 | 5441 | 91.430012% |
Noise dominated data is calculated using 1-second bins in cleaned event files. If a bin has >2000 counts, and if more than 50% of those come from <1% of pixels, then it is considered to be noise-dominated and hence unusable.
| Quadrant | # 1 sec bins | Bins with >0 counts | Bins with >2000 counts | High rate bins dominated by noise | Noise dominated (total time) | Noise dominated (detector-on time) | Marked lightcurve |
|---|---|---|---|---|---|---|---|
| A | 7021 | 5951 | 3911 | 3911 | 55.70% | 65.72% | 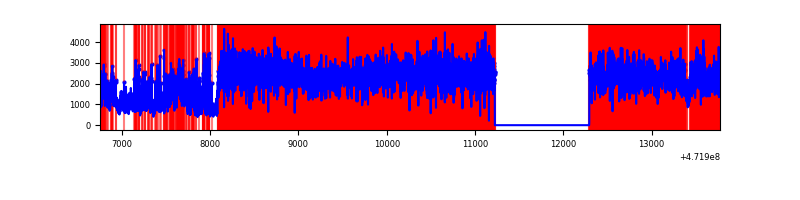 |
| B | 7021 | 5952 | 75 | 75 | 1.07% | 1.26% | 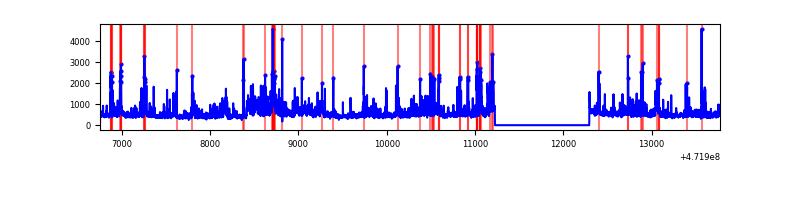 |
| C | 7022 | 5952 | 2795 | 2795 | 39.80% | 46.96% | 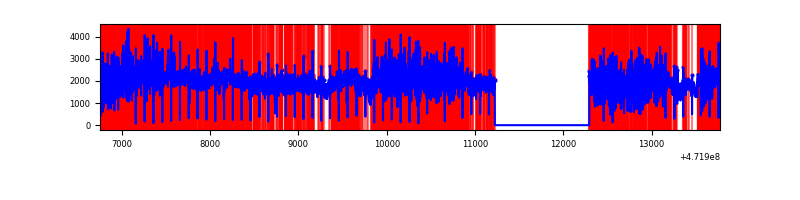 |
| D | 7020 | 5950 | 4908 | 4908 | 69.91% | 82.49% | 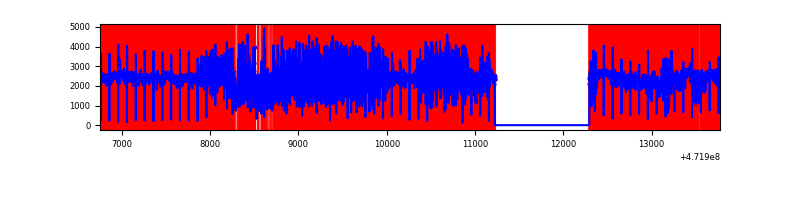 |
Top three noisy pixels from each quadrant. If the there are fewer than three noisy pixels in the level2.evt file, extra rows are filled as -1
| Pixel properties | Quadrant properties | ||||||
|---|---|---|---|---|---|---|---|
| Quadrant | DetID | PixID | Counts | Sigma | Mean | Median | Sigma |
| A | 4 | 4 | 7018872 | 58677.61 | 457 | 444 | 119.6 |
| A | 0 | 98 | 866732 | 7242.61 | 457 | 444 | 119.6 |
| A | 3 | 84 | 840285 | 7021.5 | 457 | 444 | 119.6 |
| B | 10 | 28 | 373104 | 2809.08 | 625 | 604 | 132.6 |
| B | 0 | 229 | 317685 | 2391.16 | 625 | 604 | 132.6 |
| B | 10 | 44 | 110537 | 829.02 | 625 | 604 | 132.6 |
| C | 15 | 230 | 4833706 | 102747.84 | 147 | 145 | 47.0 |
| C | 15 | 197 | 2048970 | 43552.23 | 147 | 145 | 47.0 |
| C | 15 | 174 | 872866 | 18551.58 | 147 | 145 | 47.0 |
| D | 8 | 176 | 3105819 | 50653.7 | 195 | 187 | 61.3 |
| D | 7 | 61 | 2320821 | 37850.17 | 195 | 187 | 61.3 |
| D | 7 | 126 | 1398573 | 22808.05 | 195 | 187 | 61.3 |
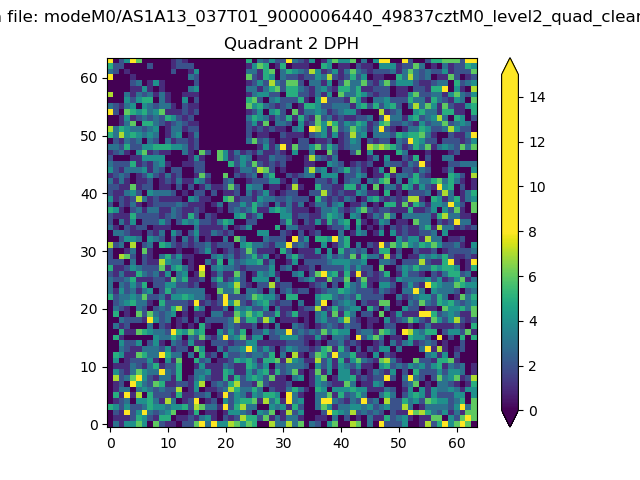
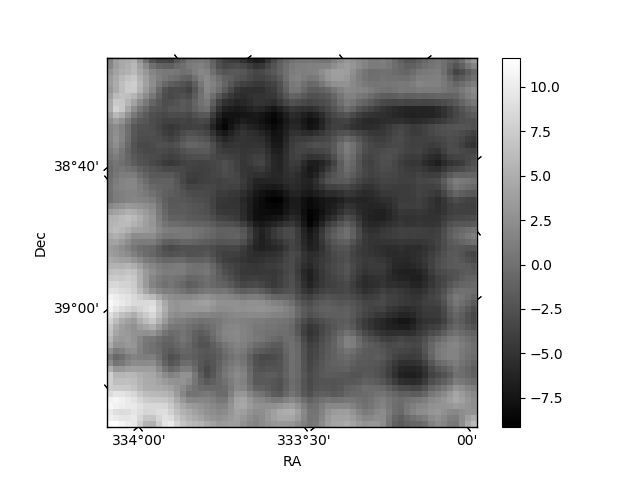
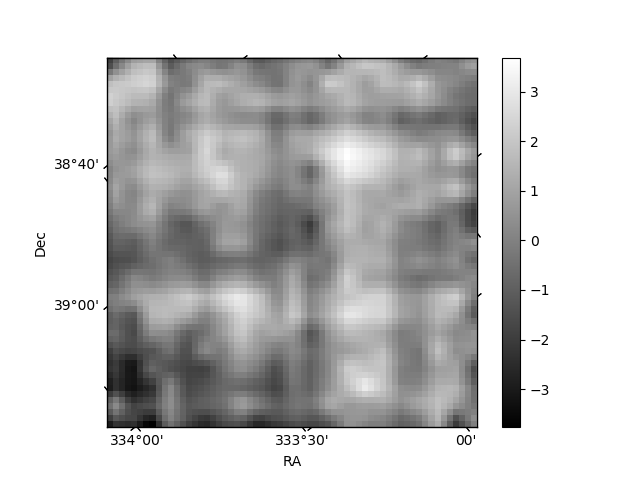
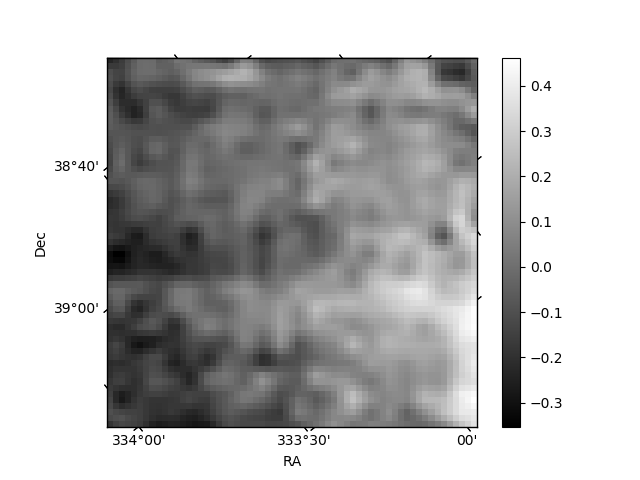
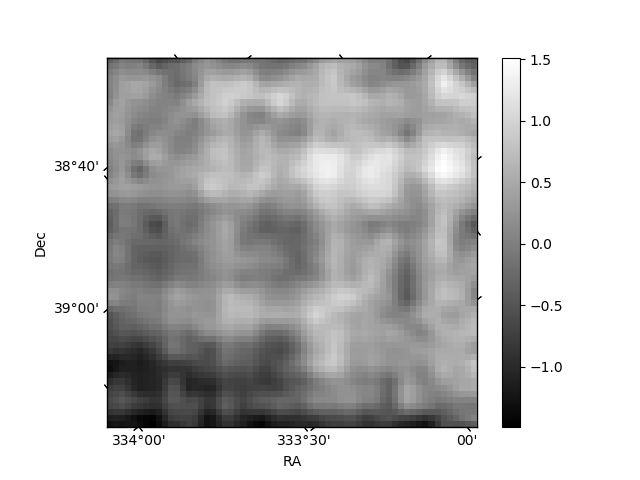
Histogram calculated using DETX and DETY for each event in the final _common_clean file
| Quadrant A | 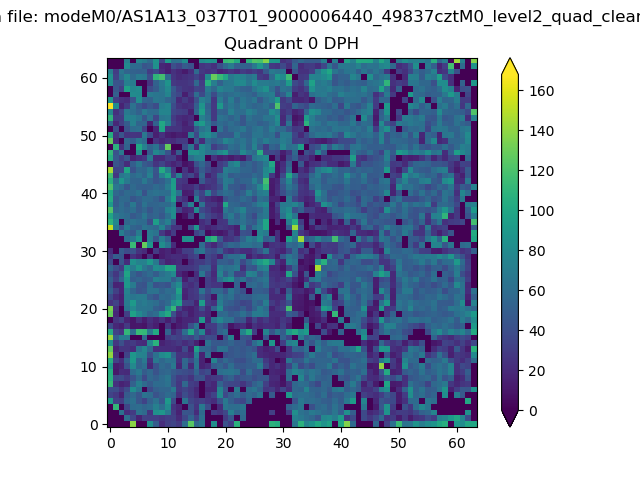 |
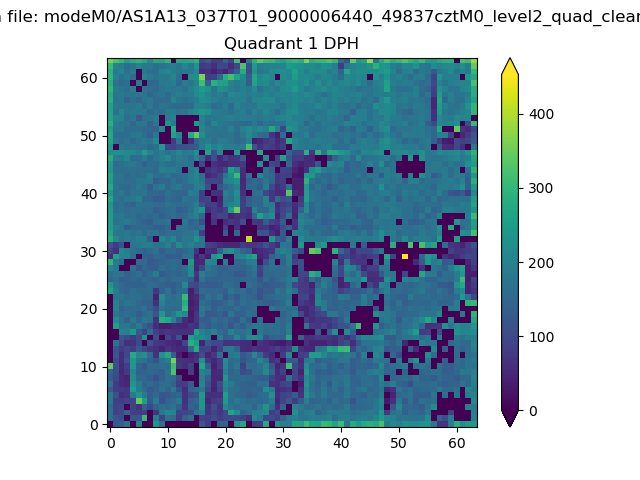 |
Quadrant B |
|---|---|---|---|
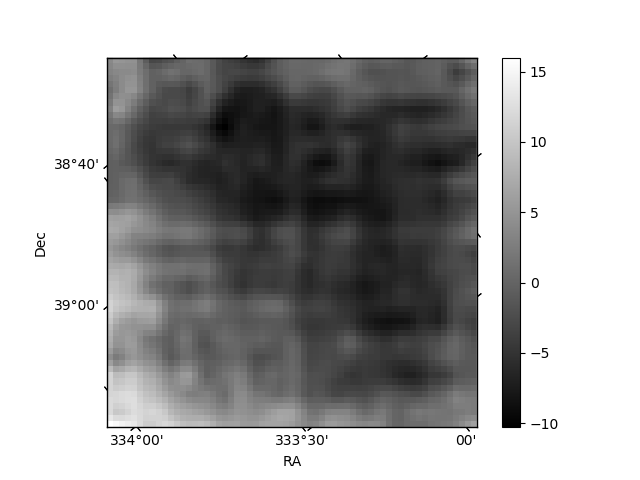
| Quadrant D | 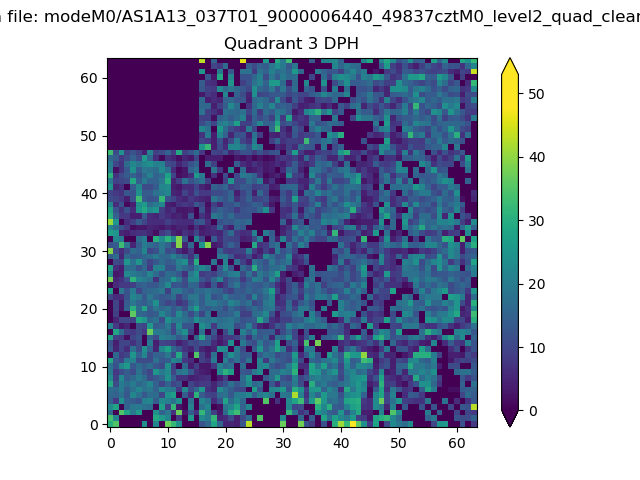 |
 |
Quadrant C |
| Plot type | Count rate plots | Images |
|---|---|---|
| Comparison with Poisson distribution Blue bars denote a histogram of data divided into 1 sec bins. Red curve is a Poisson curve with rate = median count rate of data. |
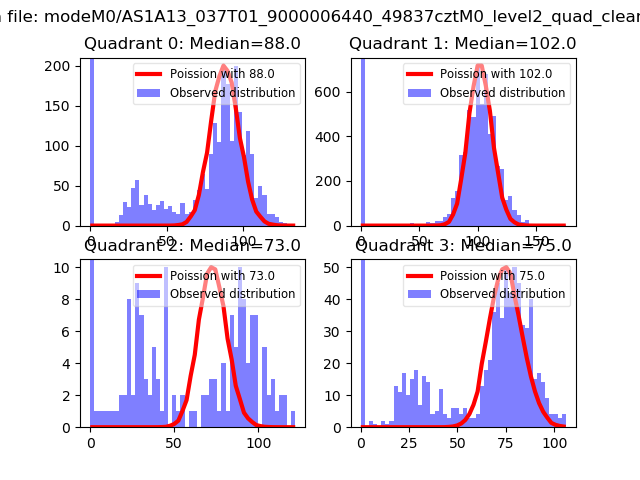 |
 |
| Quadrant-wise count rates Data is divided into 100 sec bins |
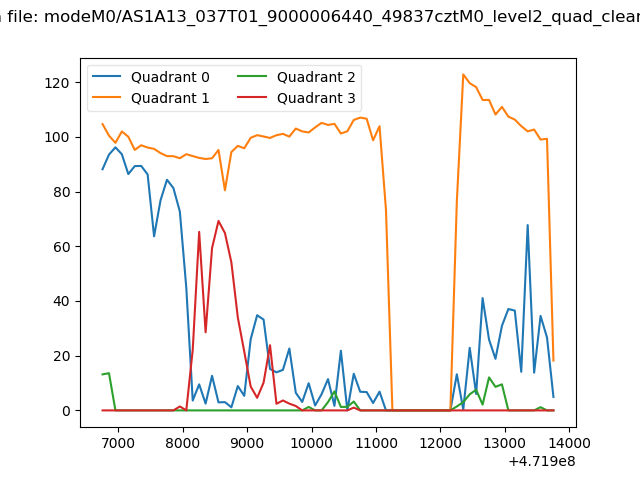 |
|
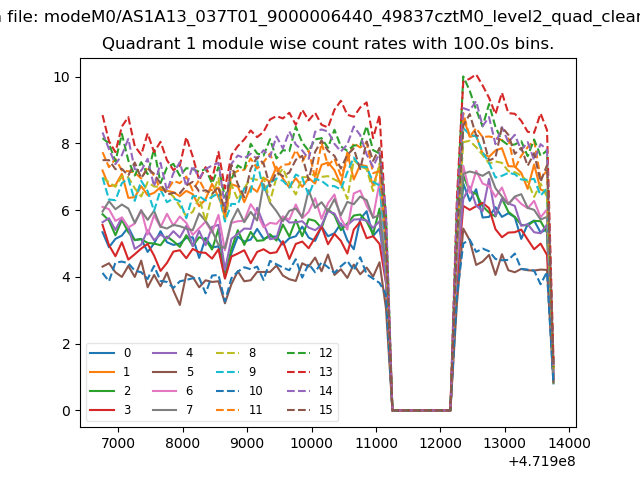
| Module-wise count rates for Quadrant A Data is divided into 100 sec bins |
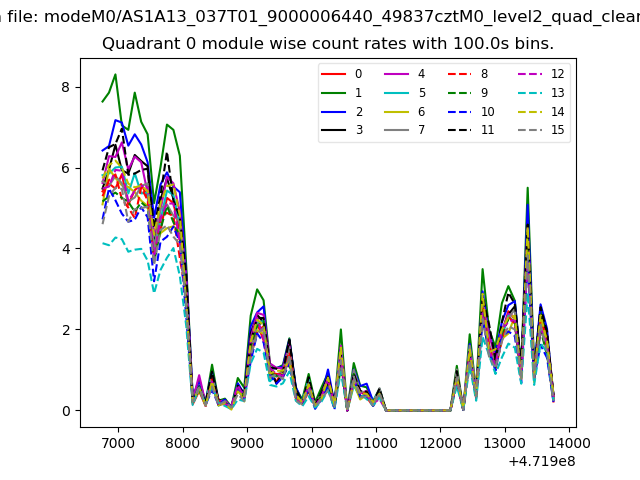 |
 |
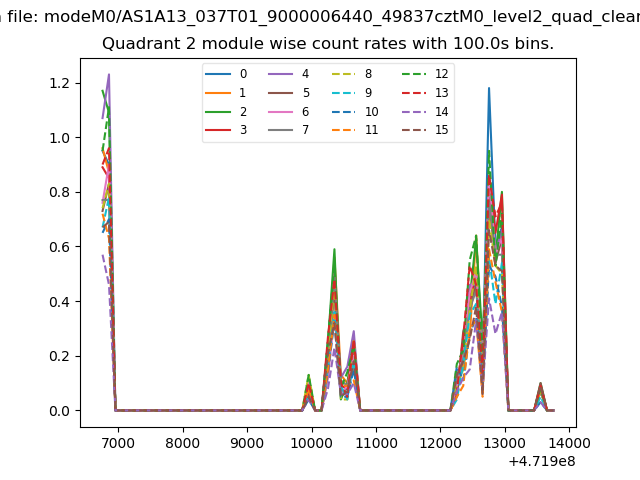
| Module-wise count rates for Quadrant B Data is divided into 100 sec bins |
 |
 |
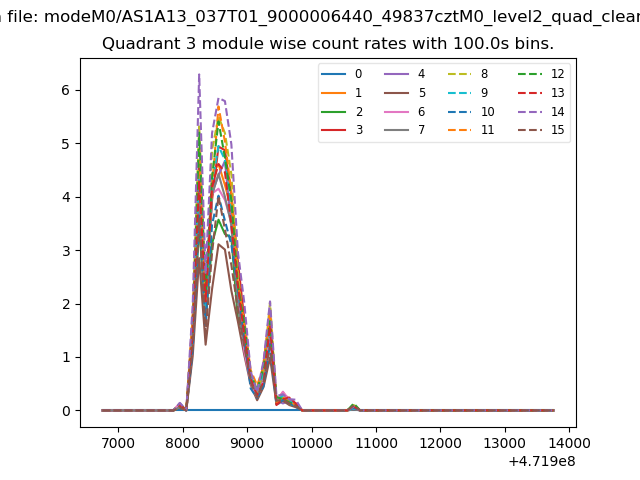
| Module-wise count rates for Quadrant C Data is divided into 100 sec bins |
 |
 |
| Module-wise count rates for Quadrant D Data is divided into 100 sec bins |
 |
 |
| Parameter | Plot |
|---|---|
| CZT HV Monitor | 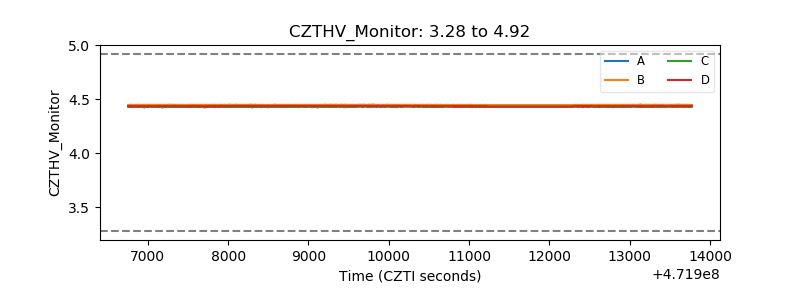 |
| D_VDD | 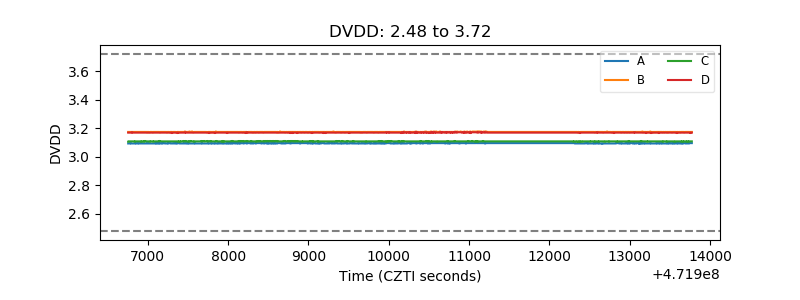 |
| Temperature 1 | 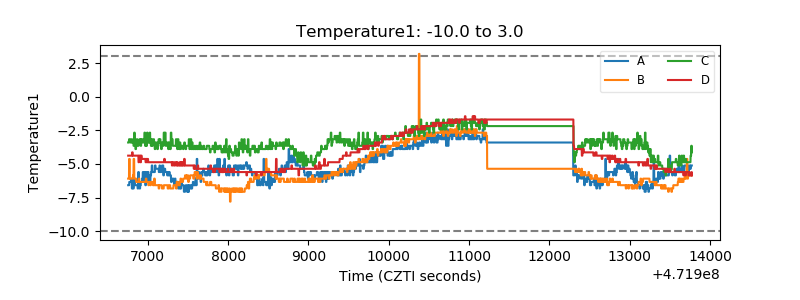 |
| Veto HV Monitor | 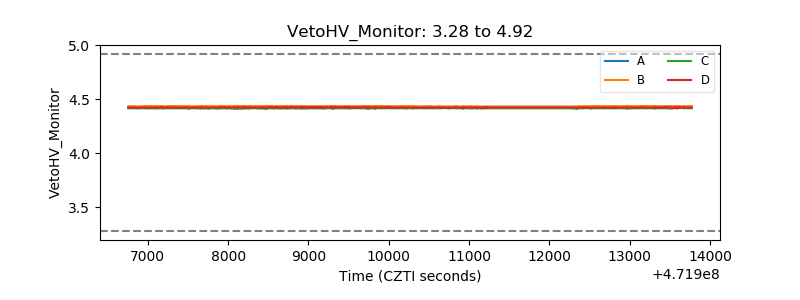 |
| Veto LLD | 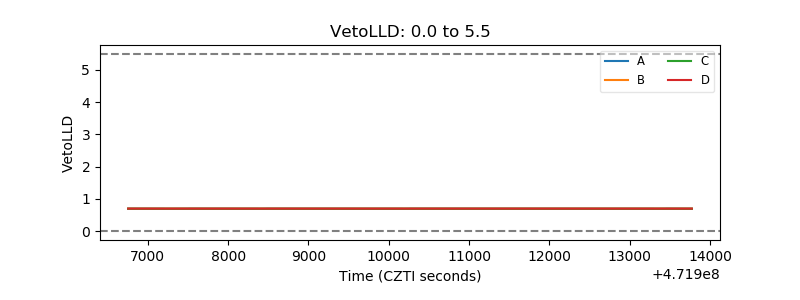 |
| Alpha Counter | 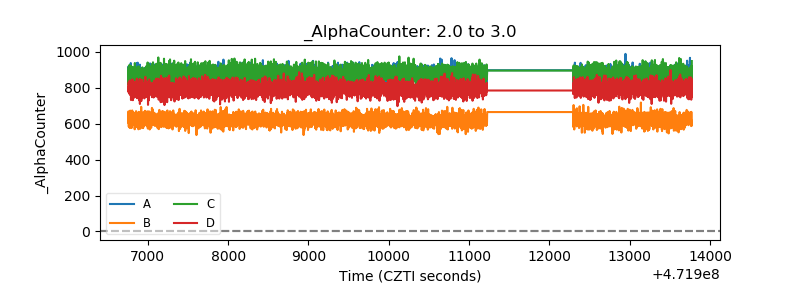 |
| _CPM_Rate | 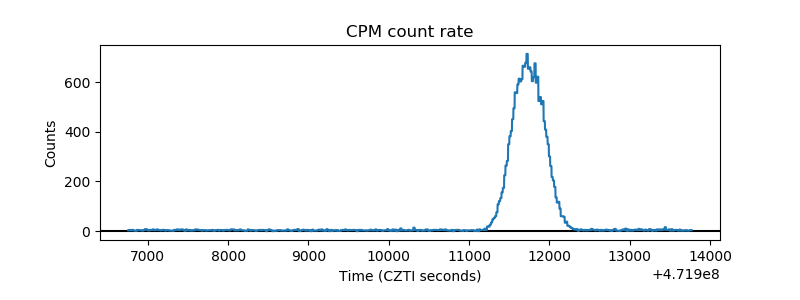 |
| CZT Counter | 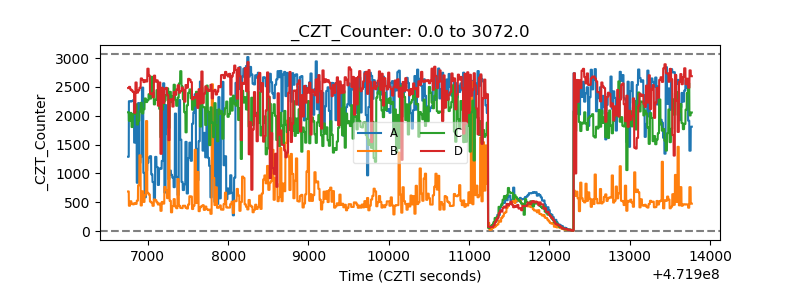 |
| +2.5 Volts monitor | 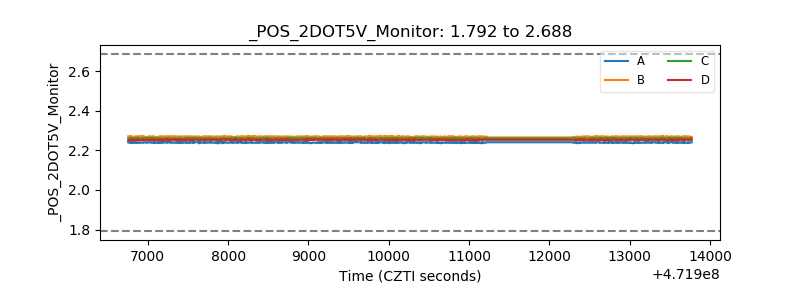 |
| +5 Volts monitor | 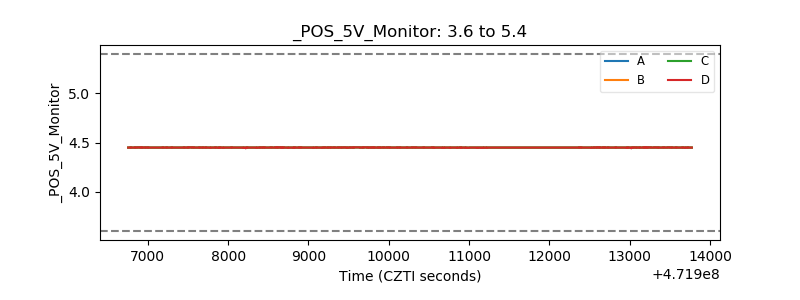 |
| _ROLL_ROT | 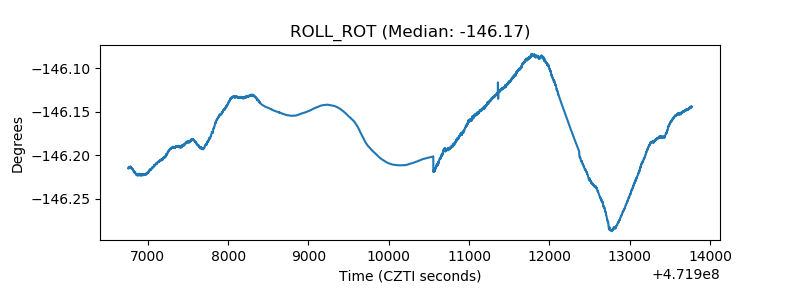 |
| _Roll_DEC | 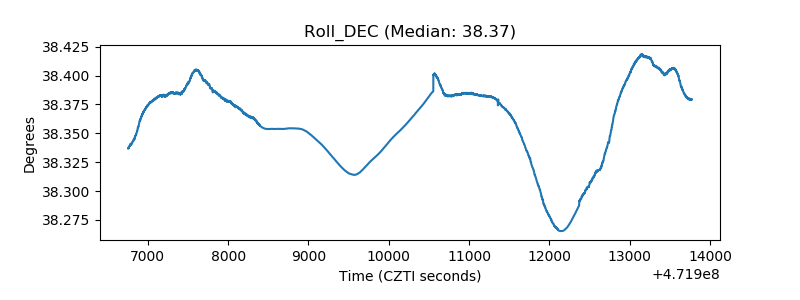 |
| _Roll_RA | 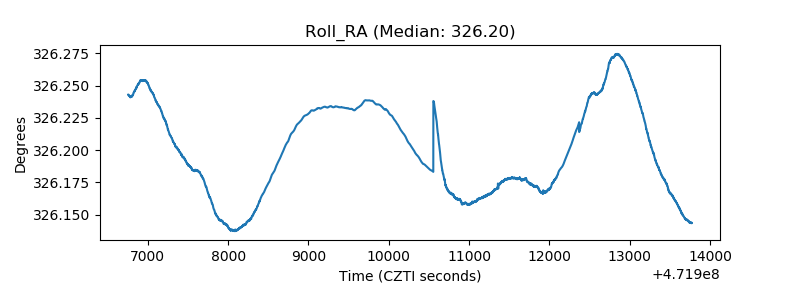 |
| Veto Counter | 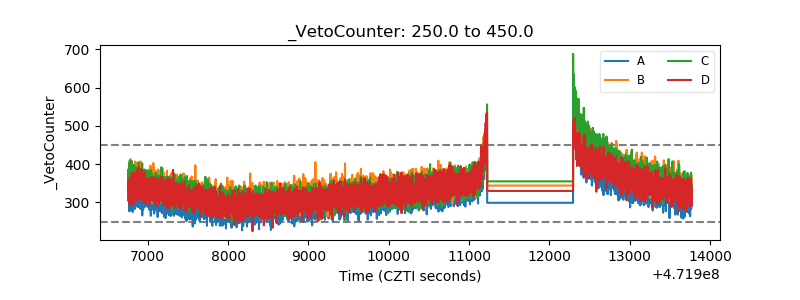 |