| Param | Original file | Final file |
|---|---|---|
| Filename | modeM0/AS1A13_037T01_9000006440_49838cztM0_level2.fits | modeM0/AS1A13_037T01_9000006440_49838cztM0_level2_quad_clean.evt |
| Size (bytes) | 1,250,634,240 | 56,646,720 |
| Size | 1.2 GB | 54.0 MB |
| Events in quadrant A | 14,999,555 | 367,131 |
| Events in quadrant B | 3,598,574 | 662,572 |
| Events in quadrant C | 11,623,844 | 144,502 |
| Events in quadrant D | 15,590,324 | 96,272 |
| Mode M9 | |||
|---|---|---|---|
| Quadrant | BADHDUFLAG | Total packets | Discarded packets |
| A | 0 | 11 | 0 |
| B | 0 | 11 | 0 |
| C | 0 | 11 | 0 |
| D | 0 | 11 | 0 |
| Mode SS | |||
|---|---|---|---|
| Quadrant | BADHDUFLAG | Total packets | Discarded packets |
| A | 0 | 128 | 0 |
| B | 0 | 128 | 0 |
| C | 0 | 128 | 0 |
| D | 0 | 128 | 0 |
| Mode M0 | |||
|---|---|---|---|
| Quadrant | BADHDUFLAG | Total packets | Discarded packets |
| A | 0 | 48783 | 0 |
| B | 0 | 14996 | 0 |
| C | 0 | 38878 | 0 |
| D | 0 | 50692 | 0 |
| Quadrant | Total seconds | Saturated seconds | Saturation percentage |
|---|---|---|---|
| A | 6244 | 5455 | 87.363869% |
| B | 6245 | 135 | 2.161729% |
| C | 6245 | 6078 | 97.325861% |
| D | 6245 | 6245 | 100.000000% |
Noise dominated data is calculated using 1-second bins in cleaned event files. If a bin has >2000 counts, and if more than 50% of those come from <1% of pixels, then it is considered to be noise-dominated and hence unusable.
| Quadrant | # 1 sec bins | Bins with >0 counts | Bins with >2000 counts | High rate bins dominated by noise | Noise dominated (total time) | Noise dominated (detector-on time) | Marked lightcurve |
|---|---|---|---|---|---|---|---|
| A | 7394 | 6244 | 5048 | 5048 | 68.27% | 80.85% | 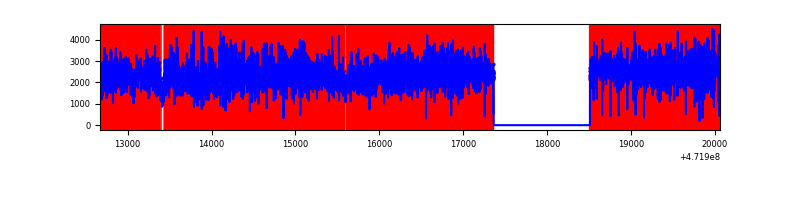 |
| B | 7395 | 6246 | 74 | 74 | 1.00% | 1.18% | 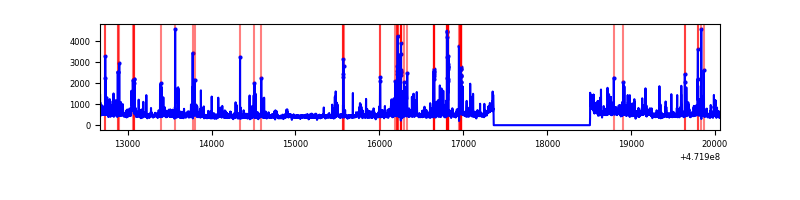 |
| C | 7394 | 6244 | 2228 | 2228 | 30.13% | 35.68% | 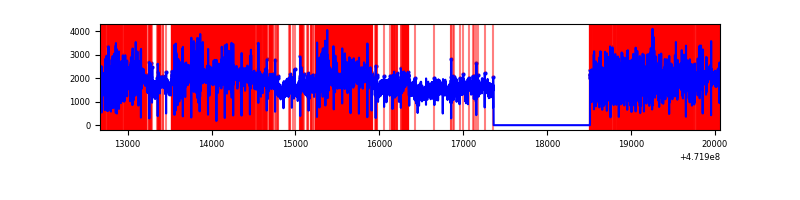 |
| D | 7394 | 6244 | 5773 | 5773 | 78.08% | 92.46% | 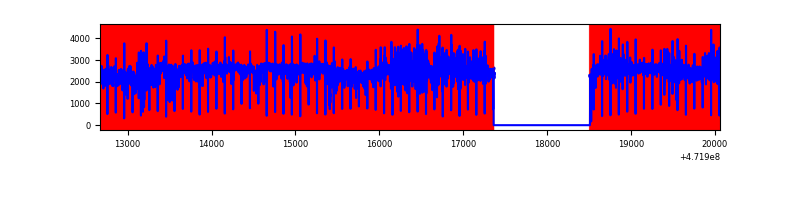 |
Top three noisy pixels from each quadrant. If the there are fewer than three noisy pixels in the level2.evt file, extra rows are filled as -1
| Pixel properties | Quadrant properties | ||||||
|---|---|---|---|---|---|---|---|
| Quadrant | DetID | PixID | Counts | Sigma | Mean | Median | Sigma |
| A | 4 | 4 | 7751441 | 69792.38 | 417 | 406 | 111.1 |
| A | 3 | 84 | 3862576 | 34776.0 | 417 | 406 | 111.1 |
| A | 4 | 13 | 280638 | 2523.28 | 417 | 406 | 111.1 |
| B | 0 | 229 | 318842 | 2185.26 | 678 | 655 | 145.6 |
| B | 5 | 185 | 158523 | 1084.21 | 678 | 655 | 145.6 |
| B | 4 | 206 | 128622 | 878.86 | 678 | 655 | 145.6 |
| C | 15 | 230 | 5148177 | 84506.19 | 179 | 175 | 60.9 |
| C | 15 | 197 | 2321023 | 38097.5 | 179 | 175 | 60.9 |
| C | 15 | 174 | 846371 | 13890.59 | 179 | 175 | 60.9 |
| D | 8 | 176 | 5231795 | 96646.18 | 131 | 124 | 54.1 |
| D | 8 | 129 | 2410703 | 44531.33 | 131 | 124 | 54.1 |
| D | 7 | 61 | 1568827 | 28979.11 | 131 | 124 | 54.1 |
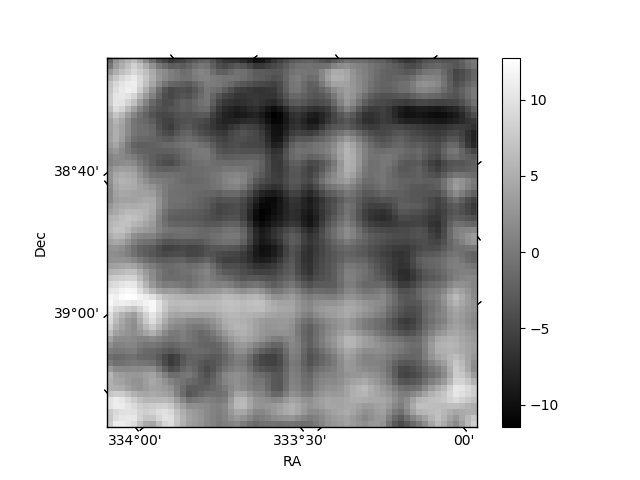
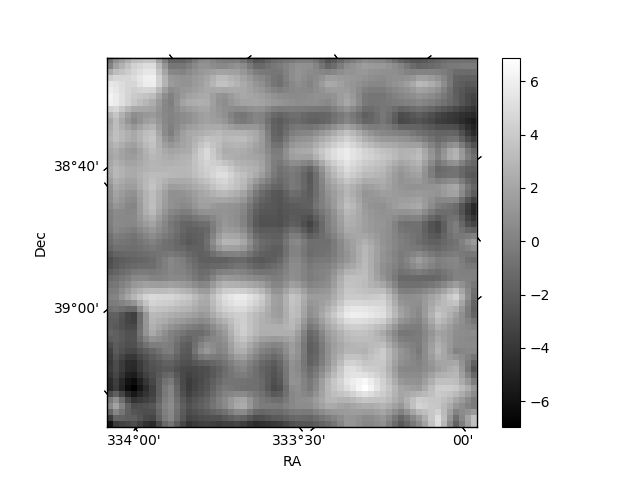
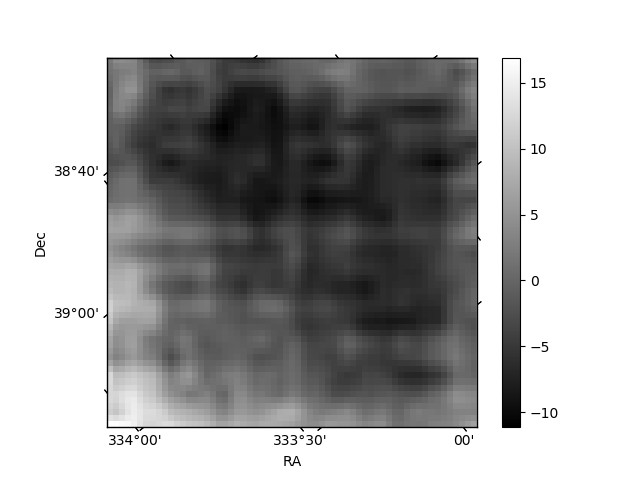
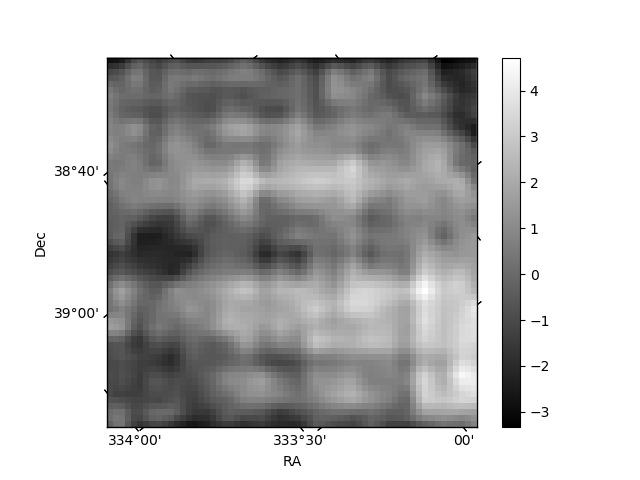
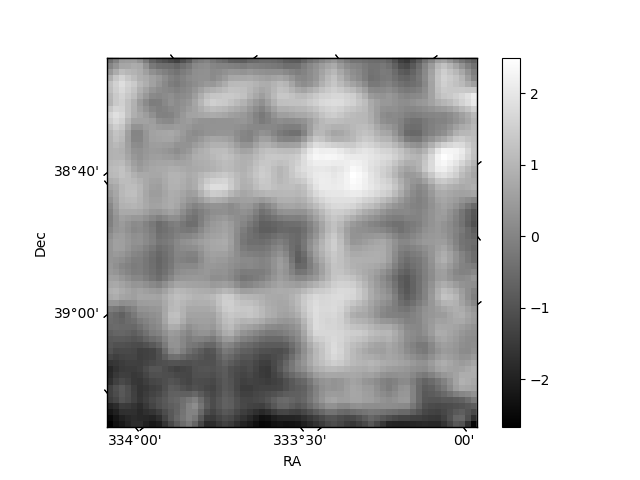
Histogram calculated using DETX and DETY for each event in the final _common_clean file
| Quadrant A | 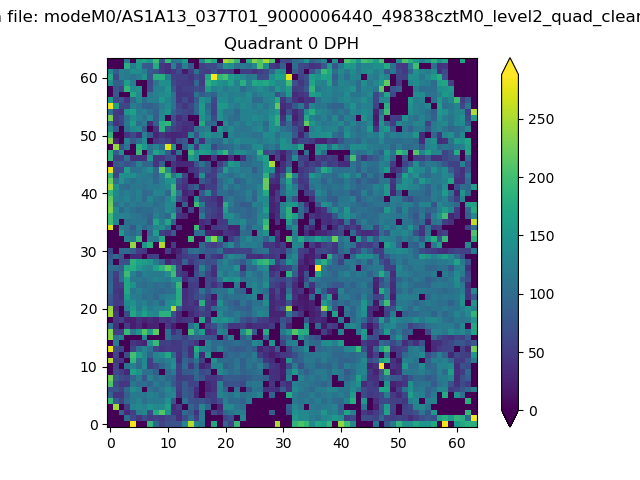 |
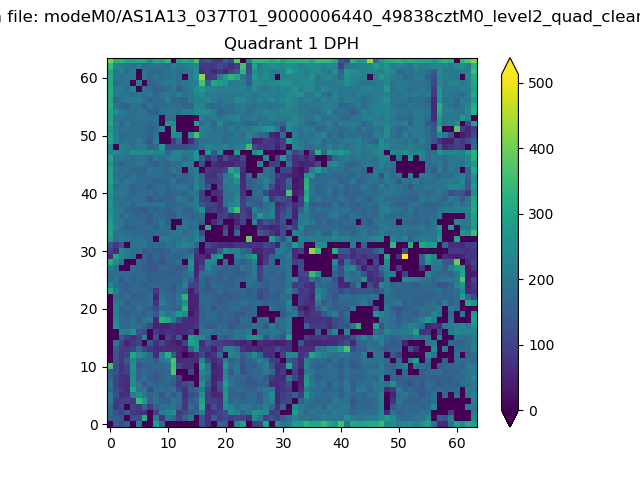 |
Quadrant B |
|---|---|---|---|
| Quadrant D | 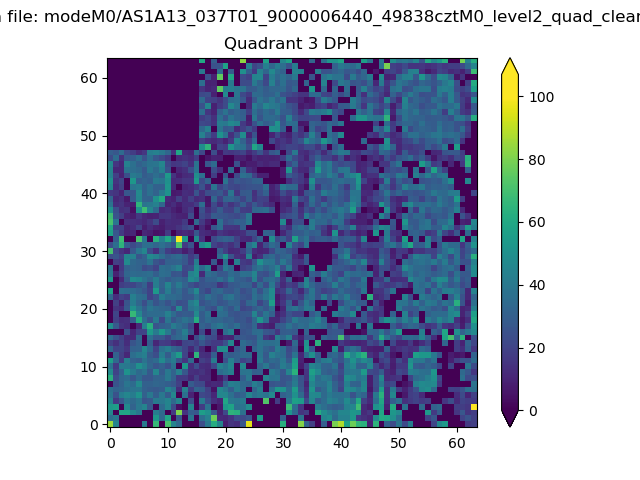 |
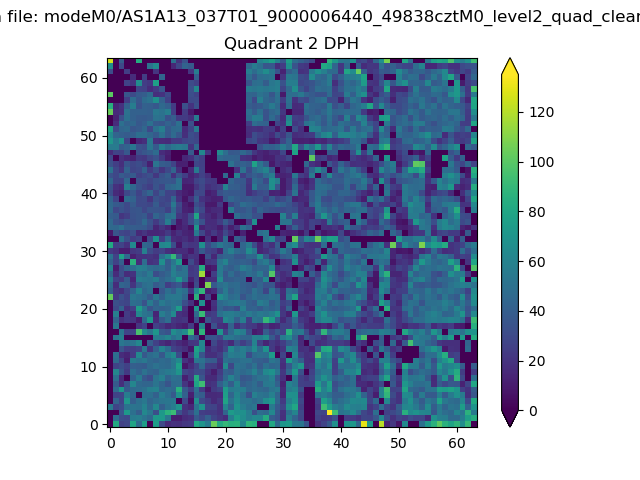 |
Quadrant C |
| Plot type | Count rate plots | Images |
|---|---|---|
| Comparison with Poisson distribution Blue bars denote a histogram of data divided into 1 sec bins. Red curve is a Poisson curve with rate = median count rate of data. |
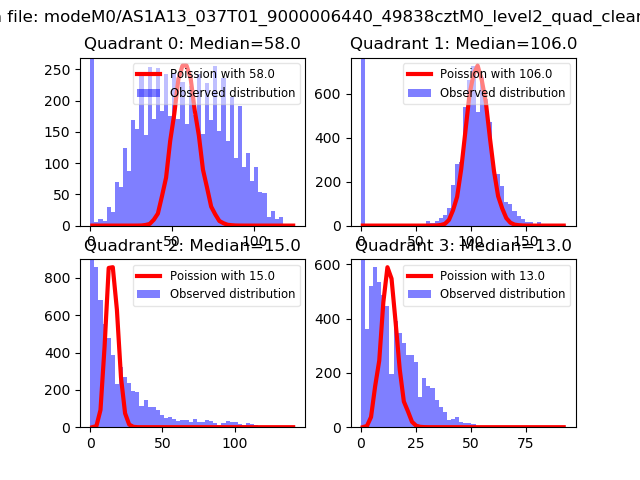 |
 |
| Quadrant-wise count rates Data is divided into 100 sec bins |
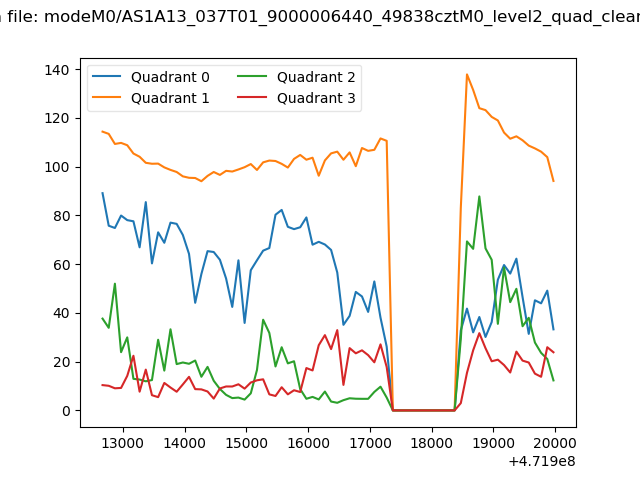 |
|
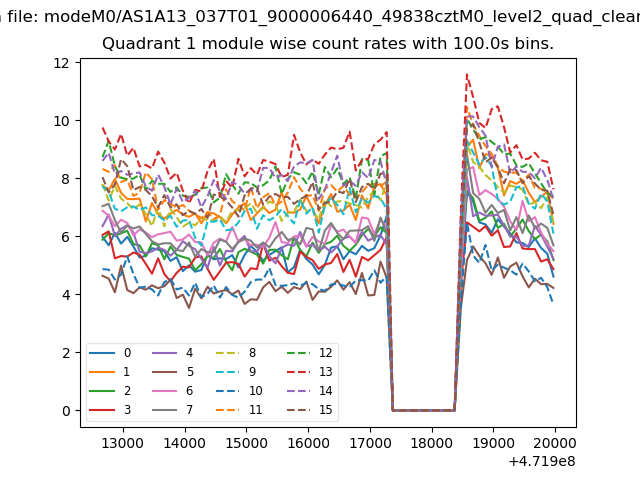
| Module-wise count rates for Quadrant A Data is divided into 100 sec bins |
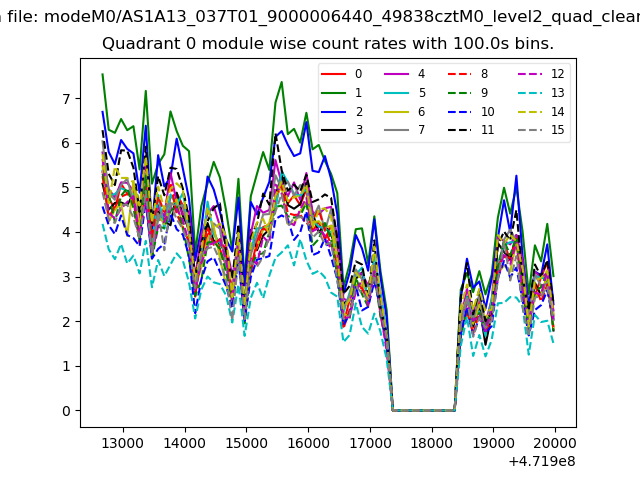 |
 |
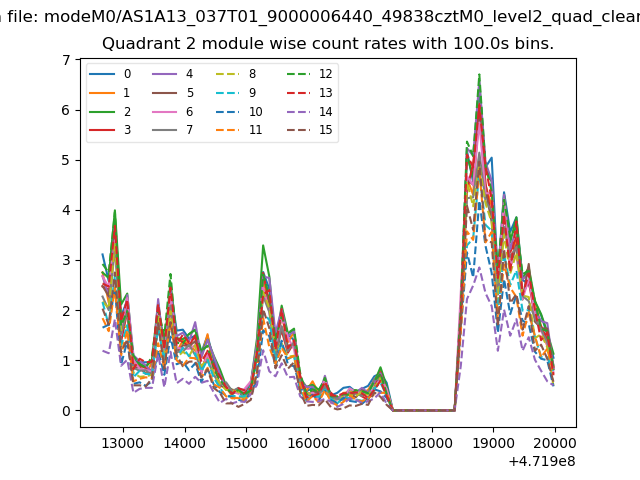
| Module-wise count rates for Quadrant B Data is divided into 100 sec bins |
 |
 |
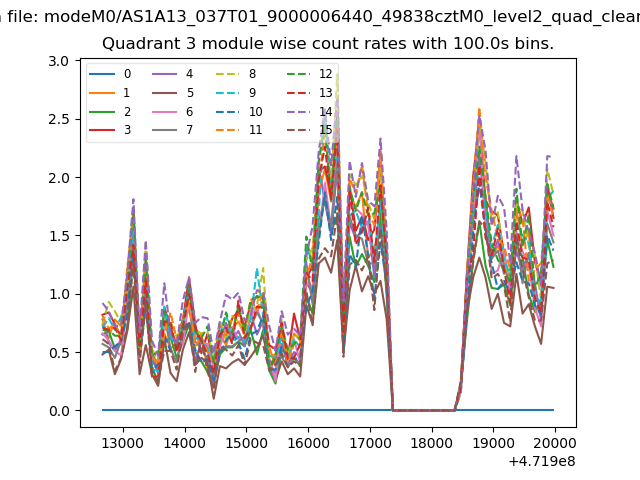
| Module-wise count rates for Quadrant C Data is divided into 100 sec bins |
 |
 |
| Module-wise count rates for Quadrant D Data is divided into 100 sec bins |
 |
 |
| Parameter | Plot |
|---|---|
| CZT HV Monitor | 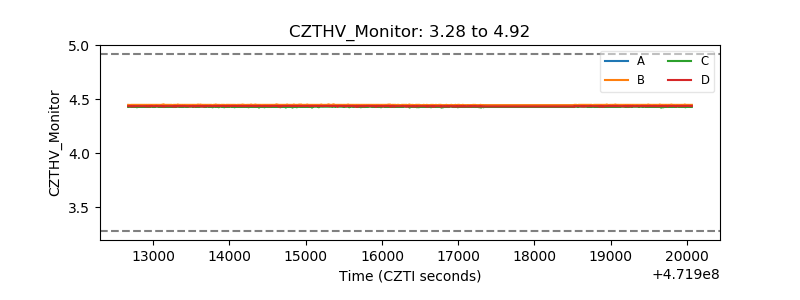 |
| D_VDD | 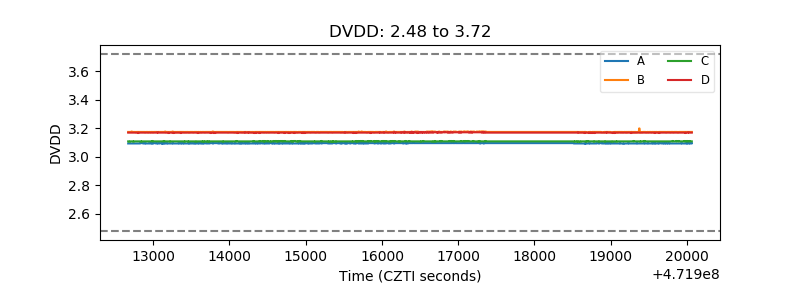 |
| Temperature 1 | 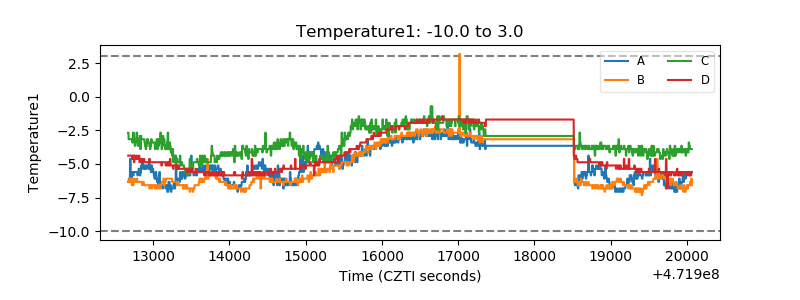 |
| Veto HV Monitor | 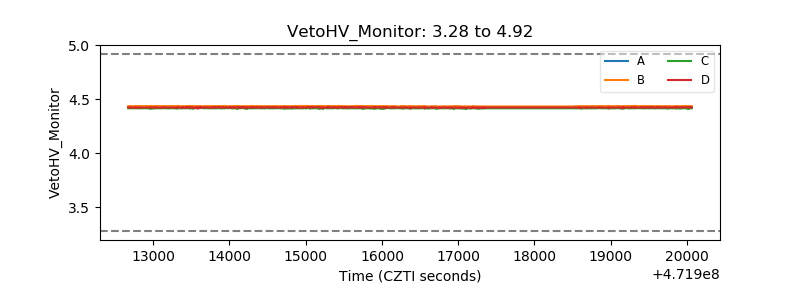 |
| Veto LLD | 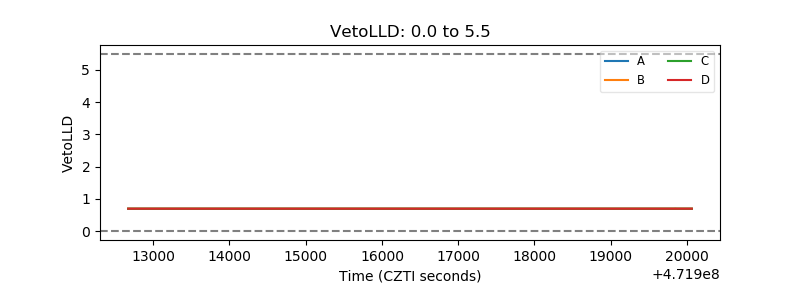 |
| Alpha Counter | 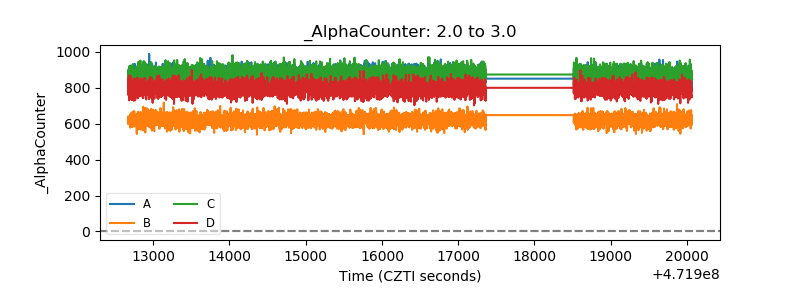 |
| _CPM_Rate | 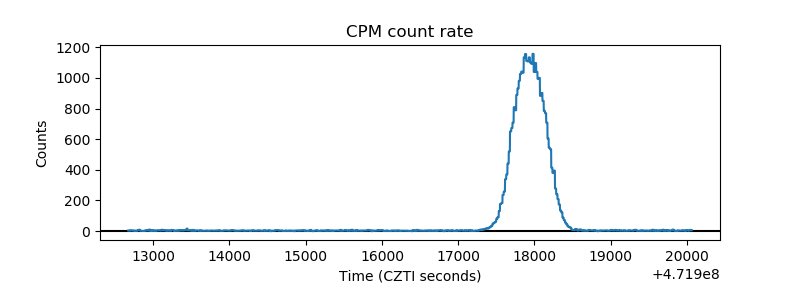 |
| CZT Counter | 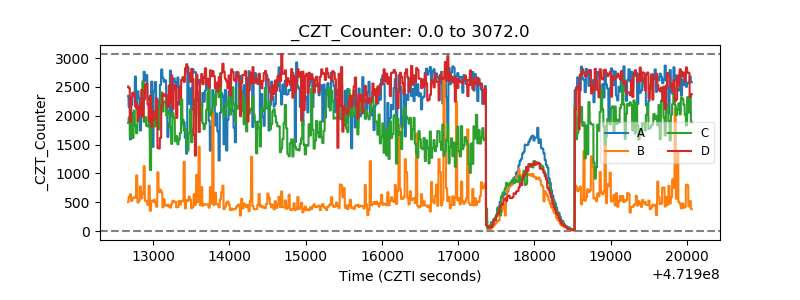 |
| +2.5 Volts monitor | 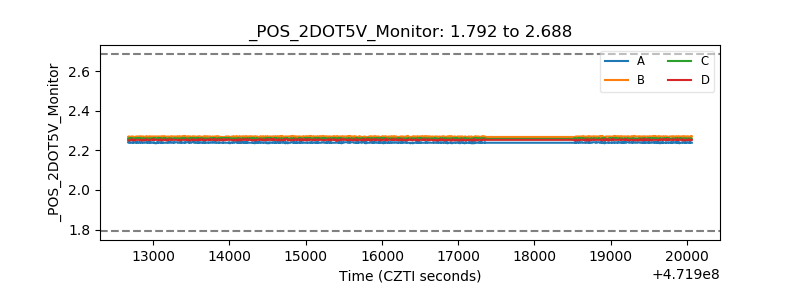 |
| +5 Volts monitor | 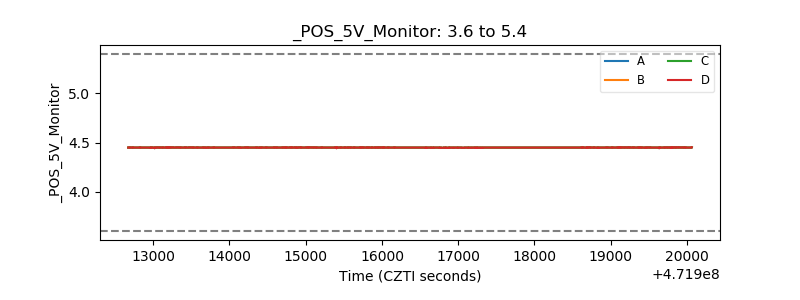 |
| _ROLL_ROT | 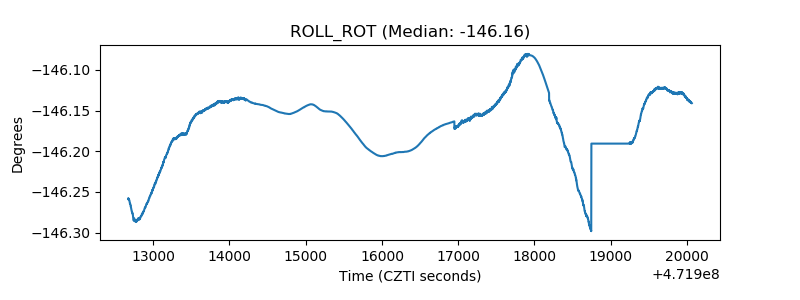 |
| _Roll_DEC | 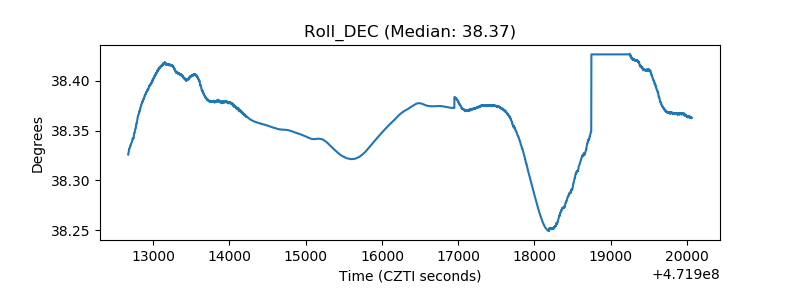 |
| _Roll_RA | 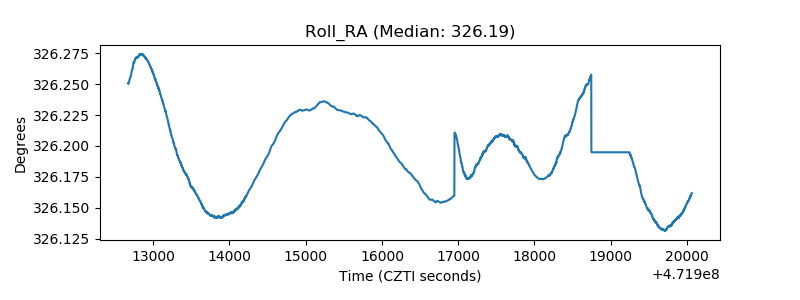 |
| Veto Counter | 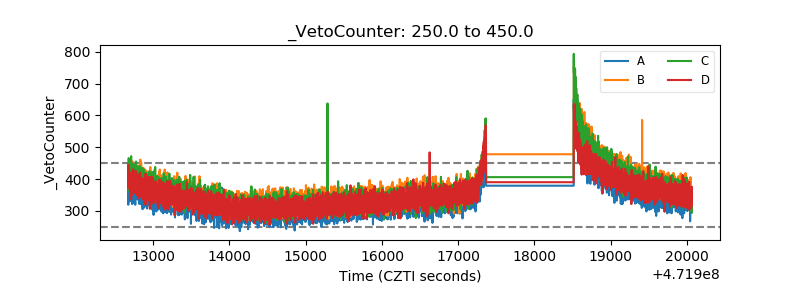 |