| Param | Original file | Final file |
|---|---|---|
| Filename | modeM0/AS1A13_037T01_9000006440_49839cztM0_level2.fits | modeM0/AS1A13_037T01_9000006440_49839cztM0_level2_quad_clean.evt |
| Size (bytes) | 1,160,285,760 | 39,329,280 |
| Size | 1.1 GB | 37.5 MB |
| Events in quadrant A | 13,566,155 | 119,405 |
| Events in quadrant B | 3,288,206 | 628,022 |
| Events in quadrant C | 11,764,258 | 11,467 |
| Events in quadrant D | 13,882,893 | 25,164 |
| Mode M9 | |||
|---|---|---|---|
| Quadrant | BADHDUFLAG | Total packets | Discarded packets |
| A | 0 | 11 | 0 |
| B | 0 | 11 | 0 |
| C | 0 | 11 | 0 |
| D | 0 | 11 | 0 |
| Mode SS | |||
|---|---|---|---|
| Quadrant | BADHDUFLAG | Total packets | Discarded packets |
| A | 0 | 120 | 0 |
| B | 0 | 120 | 0 |
| C | 0 | 120 | 0 |
| D | 0 | 120 | 0 |
| Mode M0 | |||
|---|---|---|---|
| Quadrant | BADHDUFLAG | Total packets | Discarded packets |
| A | 0 | 44222 | 1 |
| B | 0 | 13740 | 1 |
| C | 0 | 38944 | 1 |
| D | 0 | 45230 | 1 |
| Quadrant | Total seconds | Saturated seconds | Saturation percentage |
|---|---|---|---|
| A | 5807 | 4827 | 83.123816% |
| B | 5808 | 155 | 2.668733% |
| C | 5808 | 5725 | 98.570937% |
| D | 5808 | 5615 | 96.676997% |
Noise dominated data is calculated using 1-second bins in cleaned event files. If a bin has >2000 counts, and if more than 50% of those come from <1% of pixels, then it is considered to be noise-dominated and hence unusable.
| Quadrant | # 1 sec bins | Bins with >0 counts | Bins with >2000 counts | High rate bins dominated by noise | Noise dominated (total time) | Noise dominated (detector-on time) | Marked lightcurve |
|---|---|---|---|---|---|---|---|
| A | 6982 | 5807 | 4334 | 4334 | 62.07% | 74.63% | 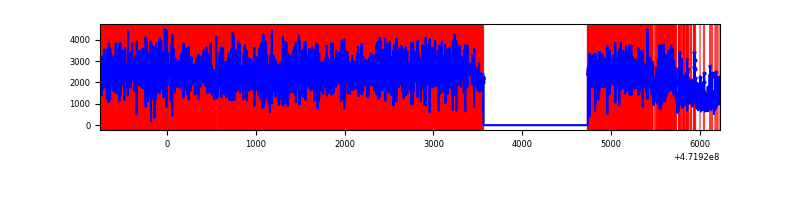 |
| B | 6983 | 5809 | 36 | 36 | 0.52% | 0.62% | 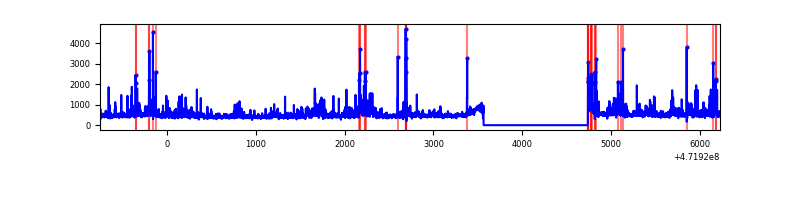 |
| C | 6982 | 5807 | 3083 | 3083 | 44.16% | 53.09% | 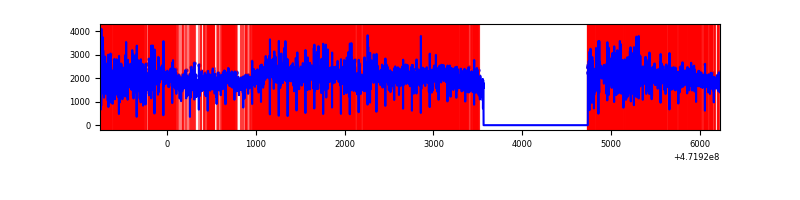 |
| D | 6982 | 5807 | 5038 | 5038 | 72.16% | 86.76% | 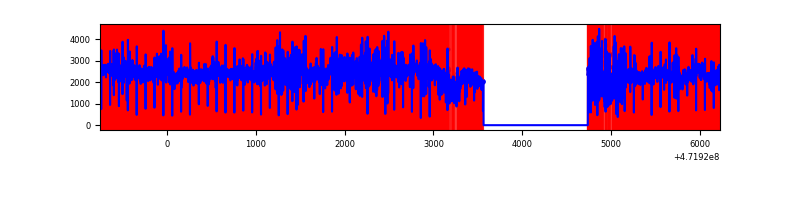 |
Top three noisy pixels from each quadrant. If the there are fewer than three noisy pixels in the level2.evt file, extra rows are filled as -1
| Pixel properties | Quadrant properties | ||||||
|---|---|---|---|---|---|---|---|
| Quadrant | DetID | PixID | Counts | Sigma | Mean | Median | Sigma |
| A | 4 | 4 | 9001101 | 79757.76 | 417 | 406 | 112.9 |
| A | 3 | 84 | 1389247 | 12306.92 | 417 | 406 | 112.9 |
| A | 3 | 130 | 236379 | 2091.02 | 417 | 406 | 112.9 |
| B | 0 | 229 | 285354 | 2049.37 | 648 | 628 | 138.9 |
| B | 4 | 206 | 114228 | 817.66 | 648 | 628 | 138.9 |
| B | 5 | 185 | 78143 | 557.93 | 648 | 628 | 138.9 |
| C | 15 | 230 | 3779856 | 77269.67 | 150 | 148 | 48.9 |
| C | 15 | 197 | 1876810 | 38365.15 | 150 | 148 | 48.9 |
| C | 1 | 44 | 1510190 | 30870.23 | 150 | 148 | 48.9 |
| D | 7 | 61 | 3541026 | 62697.61 | 176 | 169 | 56.5 |
| D | 8 | 176 | 2550126 | 45151.84 | 176 | 169 | 56.5 |
| D | 7 | 126 | 2002746 | 35459.44 | 176 | 169 | 56.5 |
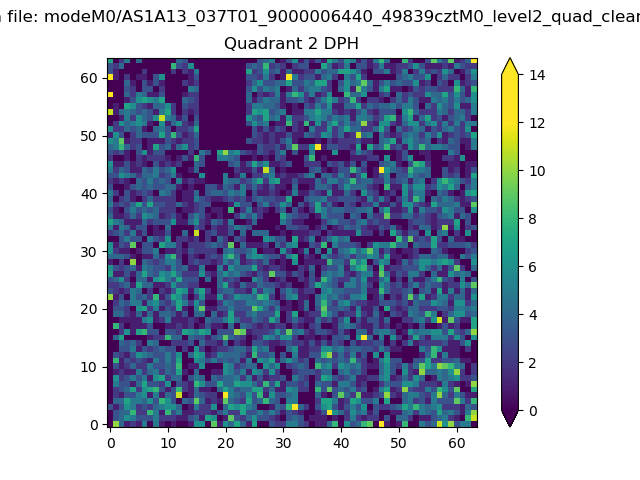
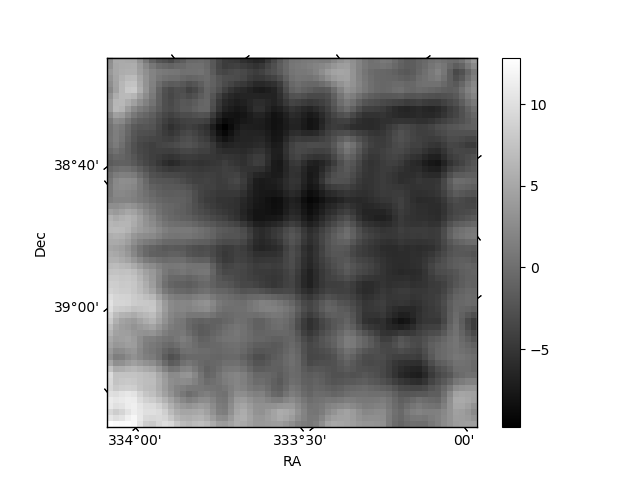
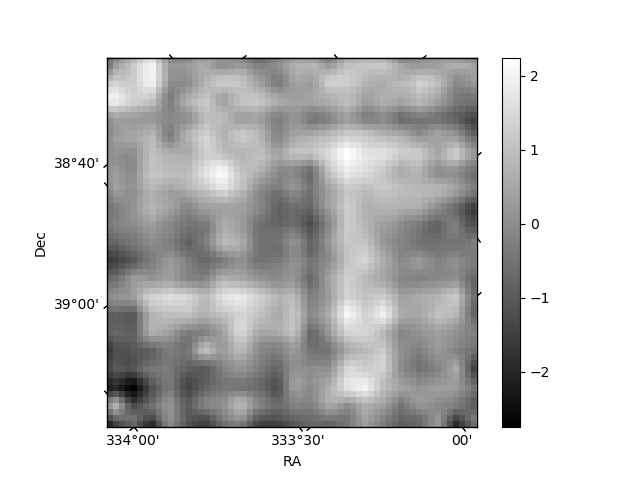
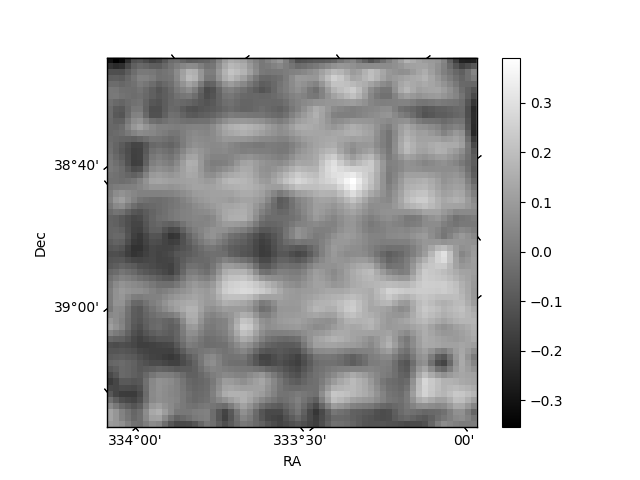
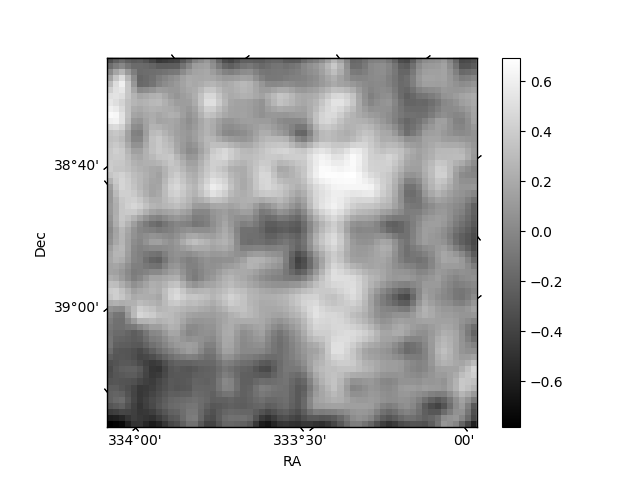
Histogram calculated using DETX and DETY for each event in the final _common_clean file
| Quadrant A | 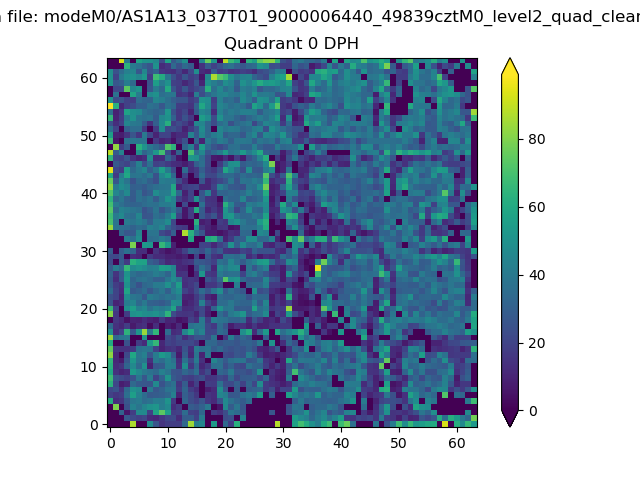 |
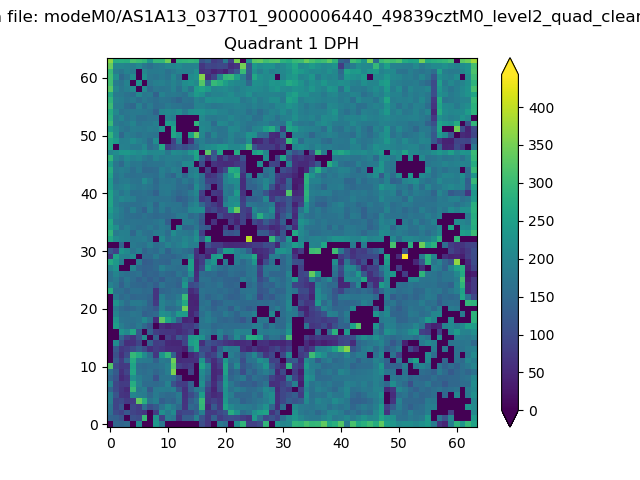 |
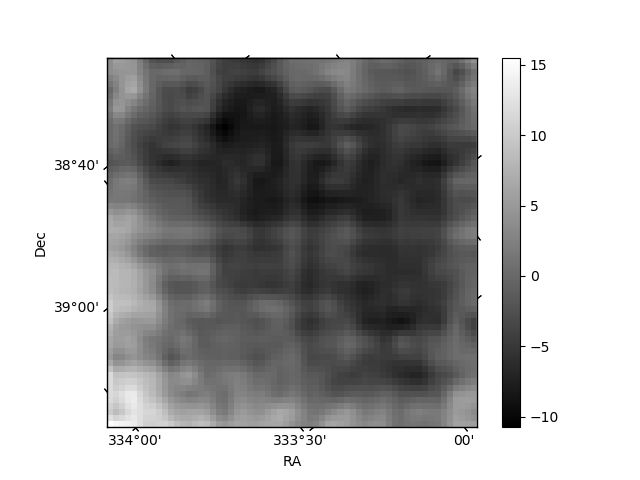
Quadrant B |
|---|---|---|---|
| Quadrant D | 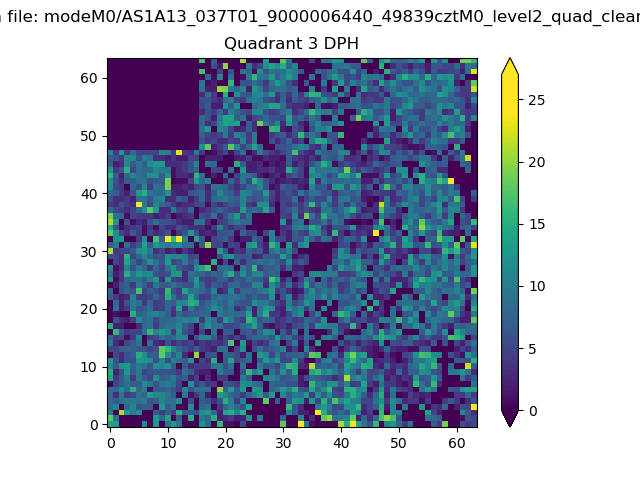 |
 |
Quadrant C |
| Plot type | Count rate plots | Images |
|---|---|---|
| Comparison with Poisson distribution Blue bars denote a histogram of data divided into 1 sec bins. Red curve is a Poisson curve with rate = median count rate of data. |
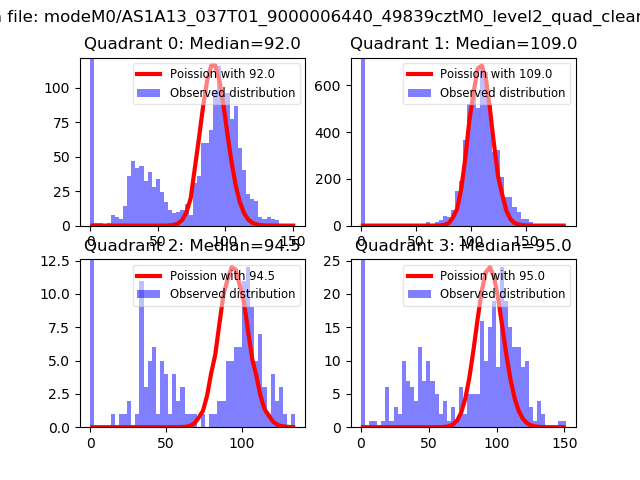 |
 |
| Quadrant-wise count rates Data is divided into 100 sec bins |
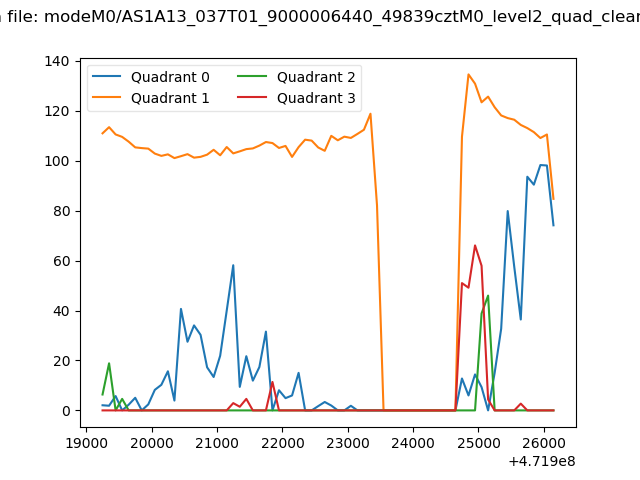 |
|
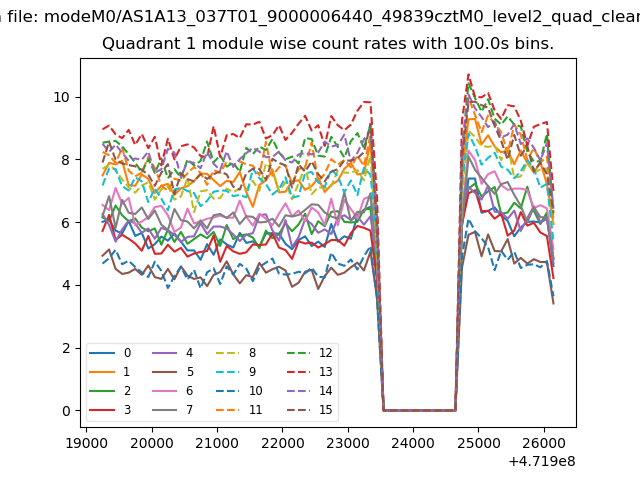
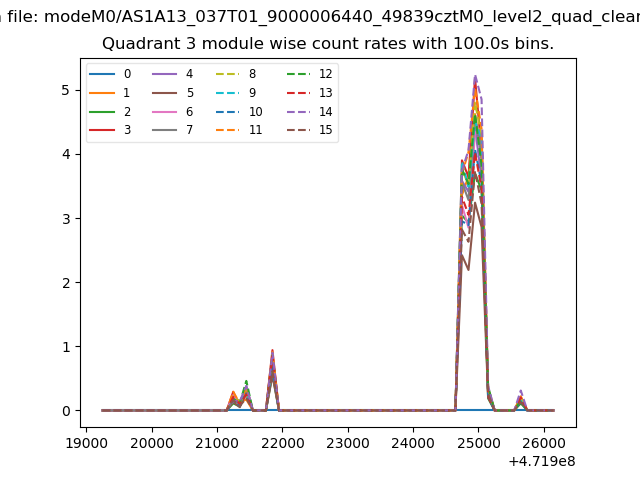
| Module-wise count rates for Quadrant A Data is divided into 100 sec bins |
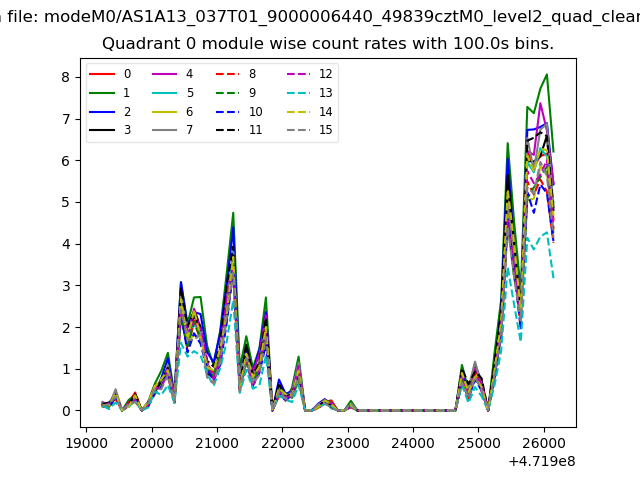 |
 |
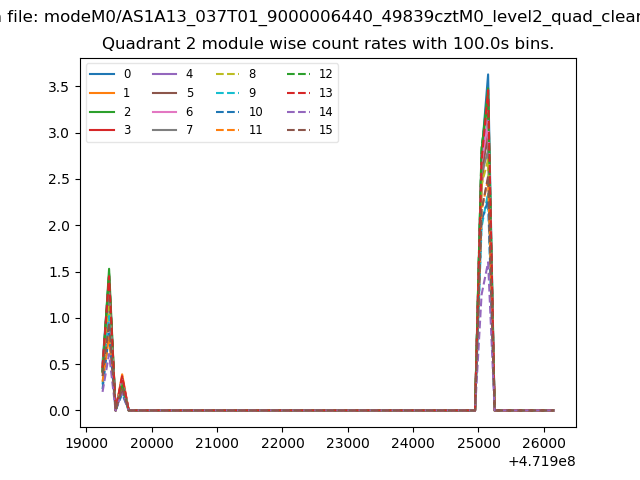
| Module-wise count rates for Quadrant B Data is divided into 100 sec bins |
 |
 |
| Module-wise count rates for Quadrant C Data is divided into 100 sec bins |
 |
 |
| Module-wise count rates for Quadrant D Data is divided into 100 sec bins |
 |
 |
| Parameter | Plot |
|---|---|
| CZT HV Monitor | 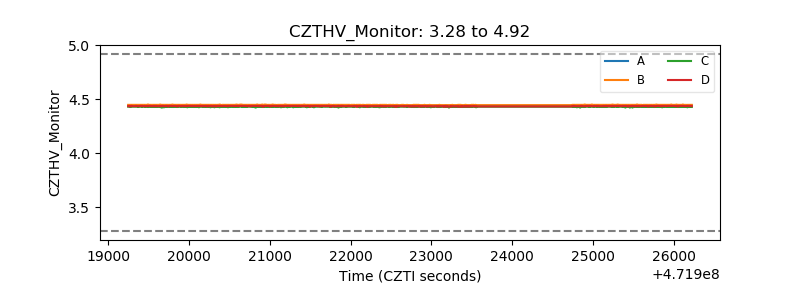 |
| D_VDD | 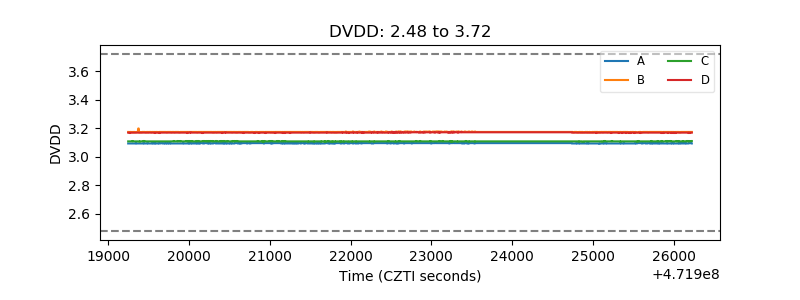 |
| Temperature 1 | 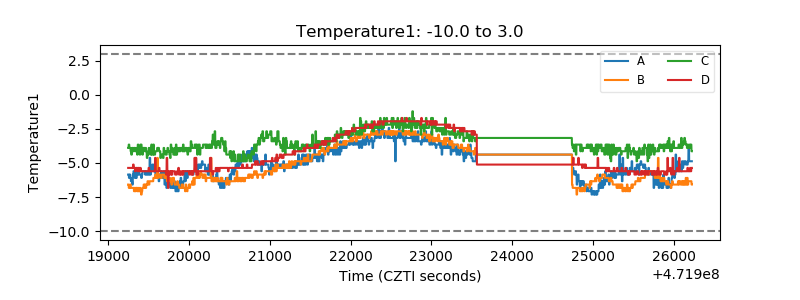 |
| Veto HV Monitor | 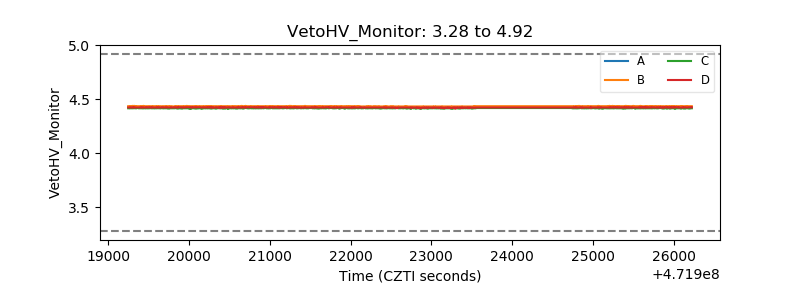 |
| Veto LLD | 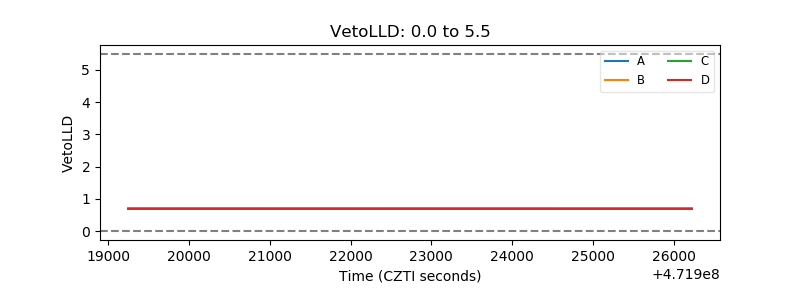 |
| Alpha Counter | 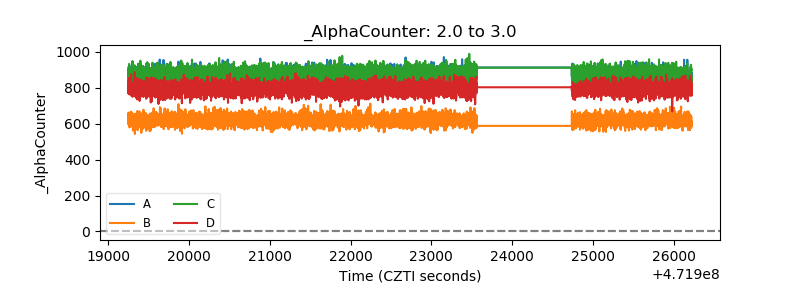 |
| _CPM_Rate | 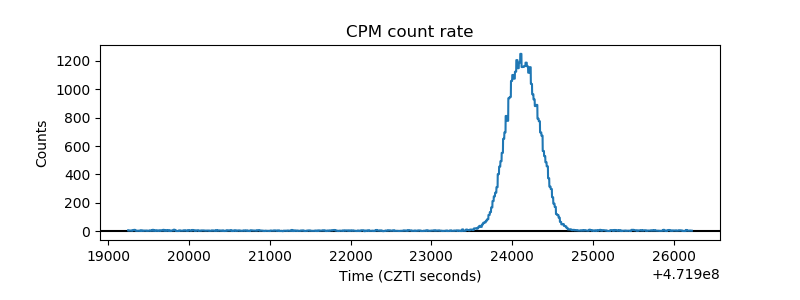 |
| CZT Counter | 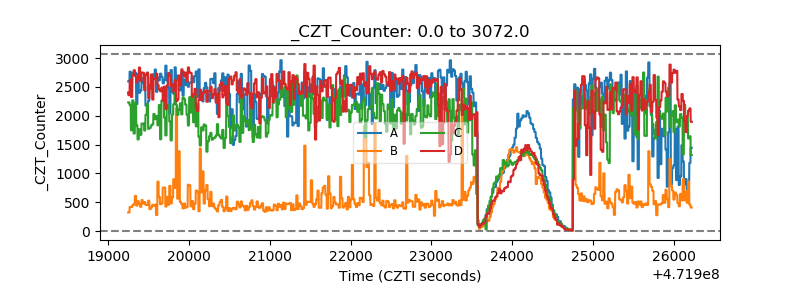 |
| +2.5 Volts monitor | 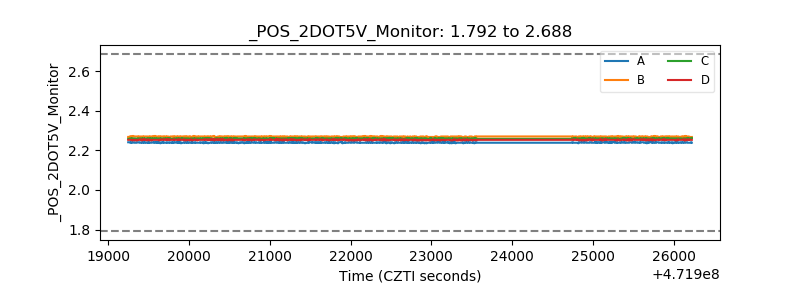 |
| +5 Volts monitor | 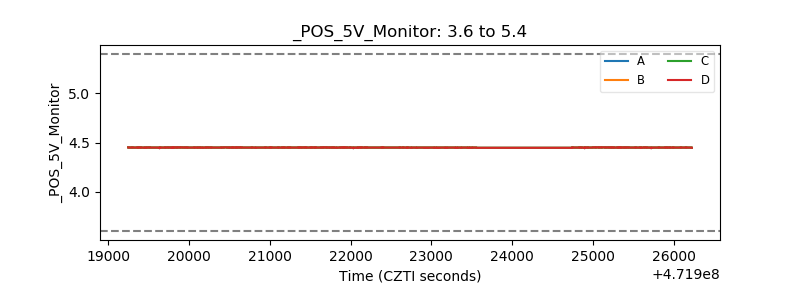 |
| _ROLL_ROT | 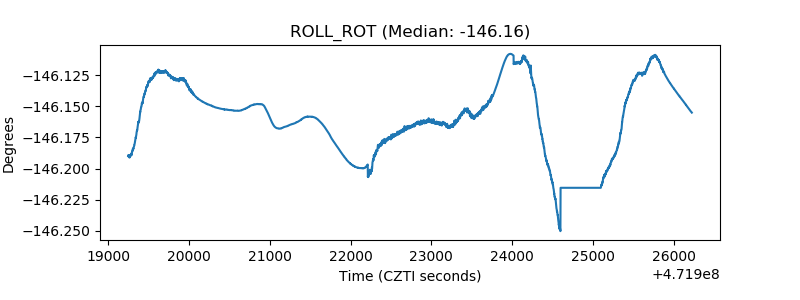 |
| _Roll_DEC | 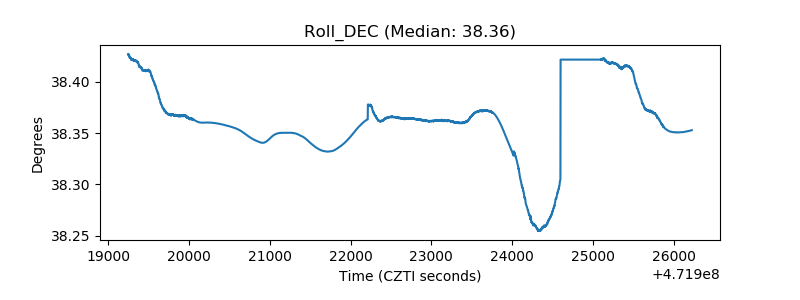 |
| _Roll_RA | 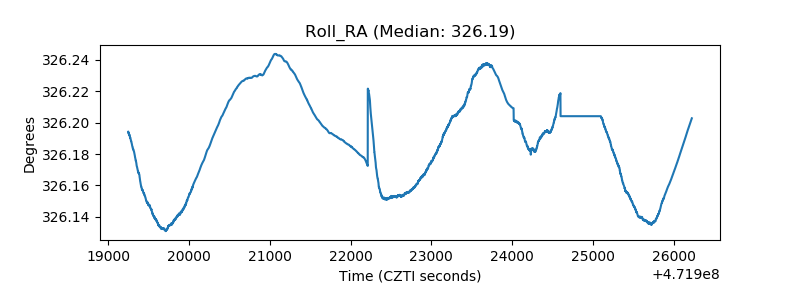 |
| Veto Counter | 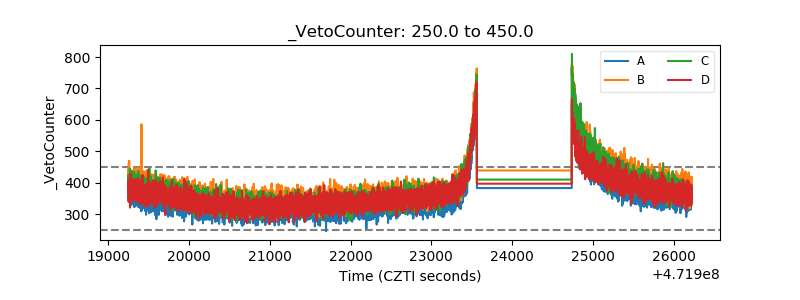 |