| Param | Original file | Final file |
|---|---|---|
| Filename | modeM0/AS1A13_037T01_9000006440_49840cztM0_level2.fits | modeM0/AS1A13_037T01_9000006440_49840cztM0_level2_quad_clean.evt |
| Size (bytes) | 1,080,216,000 | 53,665,920 |
| Size | 1.0 GB | 51.2 MB |
| Events in quadrant A | 9,207,058 | 494,396 |
| Events in quadrant B | 3,706,826 | 674,482 |
| Events in quadrant C | 12,703,899 | 21,444 |
| Events in quadrant D | 13,894,157 | 6,494 |
| Mode M9 | |||
|---|---|---|---|
| Quadrant | BADHDUFLAG | Total packets | Discarded packets |
| A | 0 | 12 | 0 |
| B | 0 | 12 | 0 |
| C | 0 | 12 | 0 |
| D | 0 | 12 | 0 |
| Mode SS | |||
|---|---|---|---|
| Quadrant | BADHDUFLAG | Total packets | Discarded packets |
| A | 0 | 124 | 0 |
| B | 0 | 124 | 0 |
| C | 0 | 124 | 0 |
| D | 0 | 124 | 0 |
| Mode M0 | |||
|---|---|---|---|
| Quadrant | BADHDUFLAG | Total packets | Discarded packets |
| A | 0 | 31638 | 1 |
| B | 0 | 15130 | 1 |
| C | 0 | 41923 | 1 |
| D | 0 | 45441 | 1 |
| Quadrant | Total seconds | Saturated seconds | Saturation percentage |
|---|---|---|---|
| A | 6131 | 1483 | 24.188550% |
| B | 6131 | 193 | 3.147937% |
| C | 6131 | 5959 | 97.194585% |
| D | 6131 | 6081 | 99.184472% |
Noise dominated data is calculated using 1-second bins in cleaned event files. If a bin has >2000 counts, and if more than 50% of those come from <1% of pixels, then it is considered to be noise-dominated and hence unusable.
| Quadrant | # 1 sec bins | Bins with >0 counts | Bins with >2000 counts | High rate bins dominated by noise | Noise dominated (total time) | Noise dominated (detector-on time) | Marked lightcurve |
|---|---|---|---|---|---|---|---|
| A | 7321 | 6132 | 1256 | 1256 | 17.16% | 20.48% | 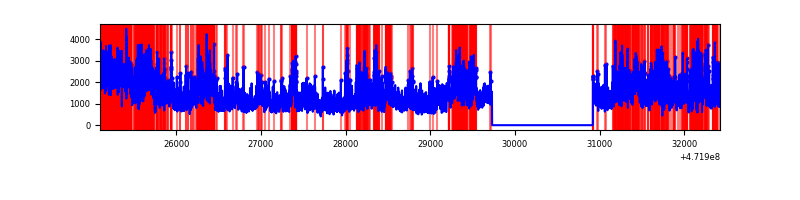 |
| B | 7321 | 6132 | 53 | 53 | 0.72% | 0.86% | 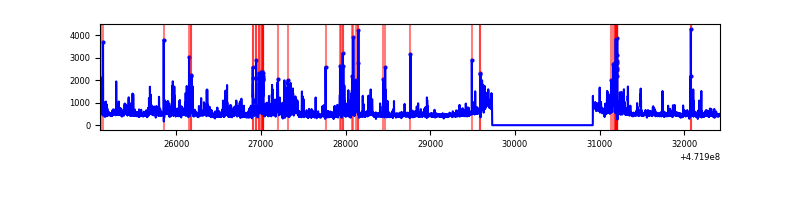 |
| C | 7320 | 6130 | 3526 | 3526 | 48.17% | 57.52% | 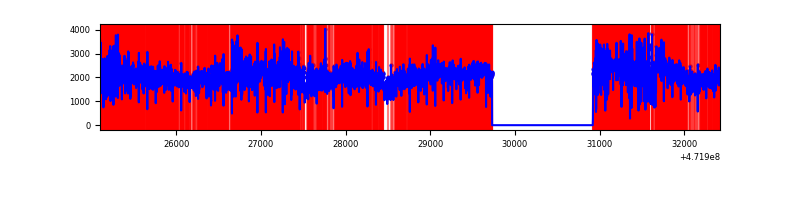 |
| D | 7320 | 6130 | 4871 | 4871 | 66.54% | 79.46% | 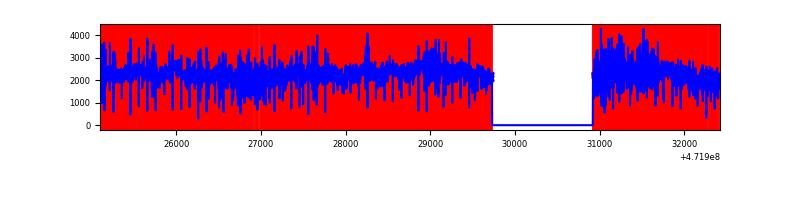 |
Top three noisy pixels from each quadrant. If the there are fewer than three noisy pixels in the level2.evt file, extra rows are filled as -1
| Pixel properties | Quadrant properties | ||||||
|---|---|---|---|---|---|---|---|
| Quadrant | DetID | PixID | Counts | Sigma | Mean | Median | Sigma |
| A | 4 | 4 | 3475938 | 20942.41 | 646 | 629 | 165.9 |
| A | 3 | 84 | 1555388 | 9369.06 | 646 | 629 | 165.9 |
| A | 3 | 1 | 168627 | 1012.37 | 646 | 629 | 165.9 |
| B | 0 | 229 | 265373 | 1820.94 | 691 | 671 | 145.4 |
| B | 4 | 206 | 197359 | 1353.06 | 691 | 671 | 145.4 |
| B | 10 | 44 | 181480 | 1243.82 | 691 | 671 | 145.4 |
| C | 1 | 44 | 2653459 | 55377.73 | 151 | 150 | 47.9 |
| C | 15 | 230 | 1777933 | 37104.46 | 151 | 150 | 47.9 |
| C | 15 | 197 | 1761485 | 36761.17 | 151 | 150 | 47.9 |
| D | 7 | 61 | 5488619 | 97028.58 | 172 | 164 | 56.6 |
| D | 7 | 126 | 2046288 | 36172.75 | 172 | 164 | 56.6 |
| D | 8 | 129 | 1171949 | 20715.6 | 172 | 164 | 56.6 |
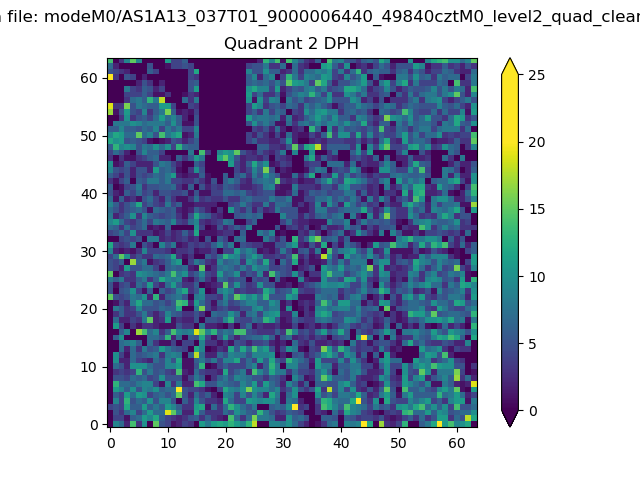
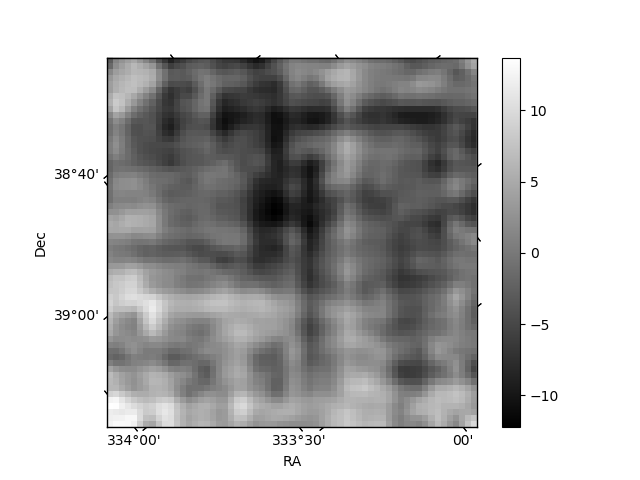
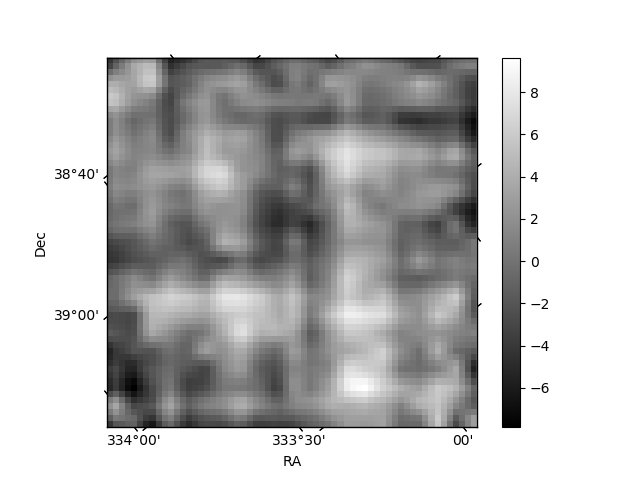
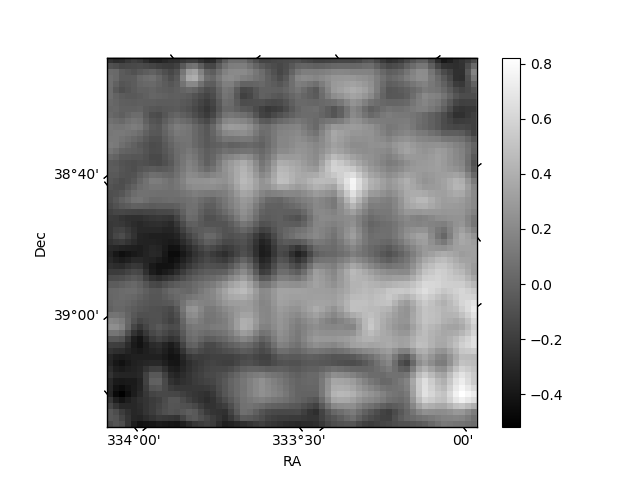
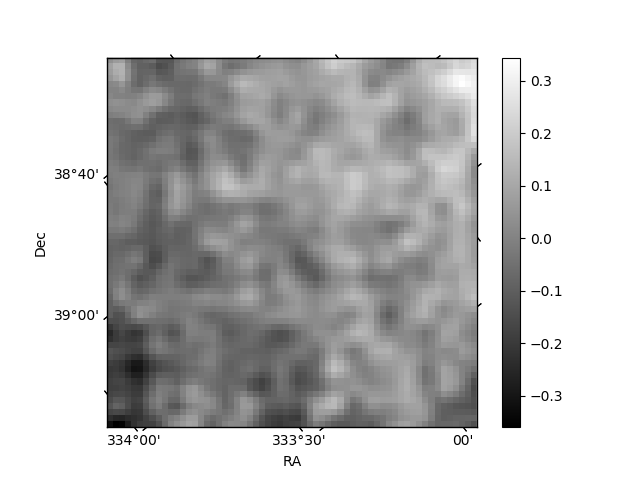
Histogram calculated using DETX and DETY for each event in the final _common_clean file
| Quadrant A | 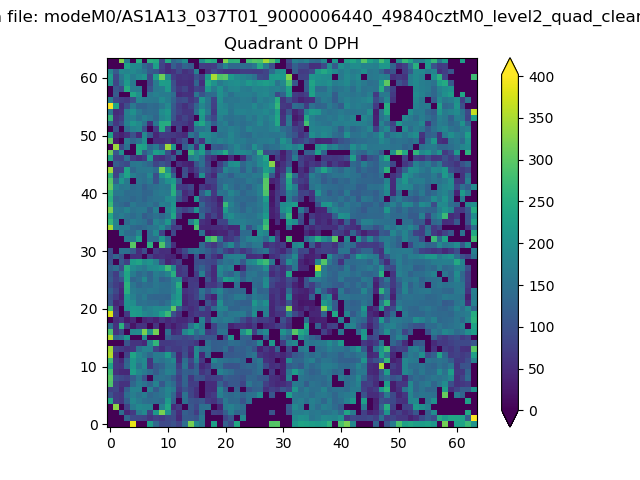 |
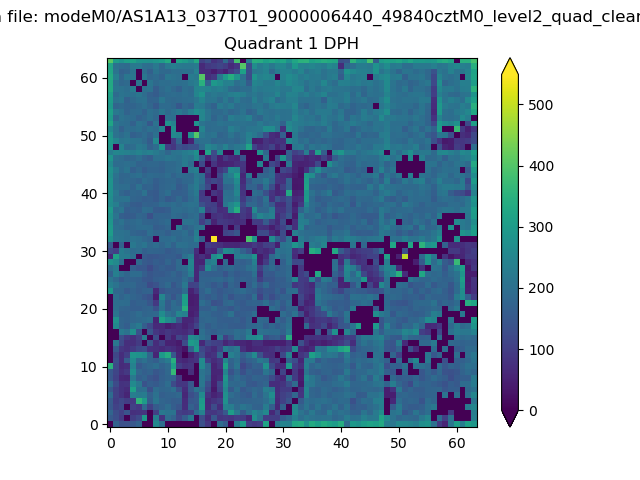 |
Quadrant B |
|---|---|---|---|
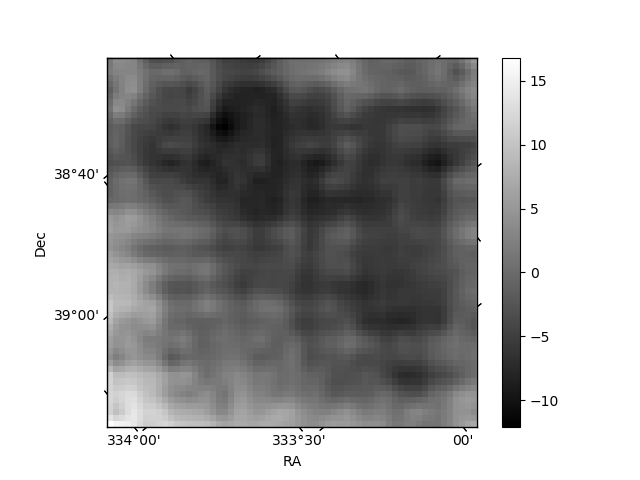
| Quadrant D | 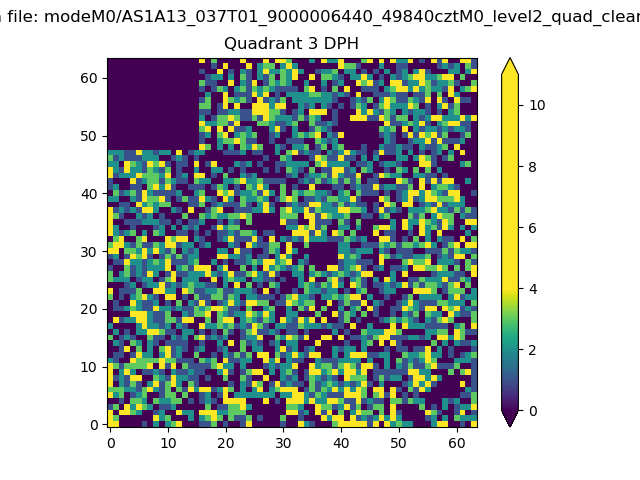 |
 |
Quadrant C |
| Plot type | Count rate plots | Images |
|---|---|---|
| Comparison with Poisson distribution Blue bars denote a histogram of data divided into 1 sec bins. Red curve is a Poisson curve with rate = median count rate of data. |
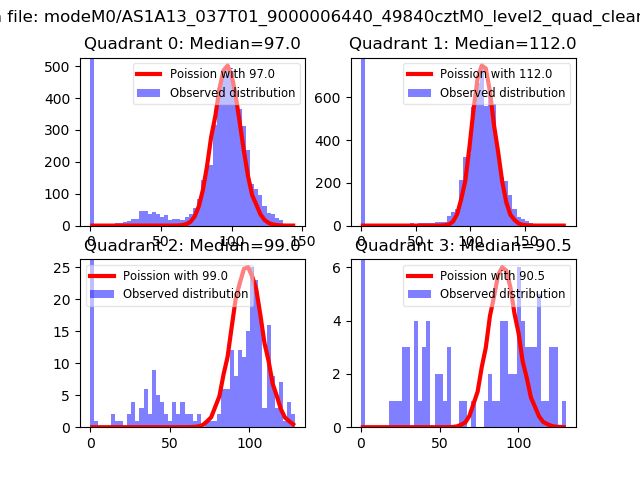 |
 |
| Quadrant-wise count rates Data is divided into 100 sec bins |
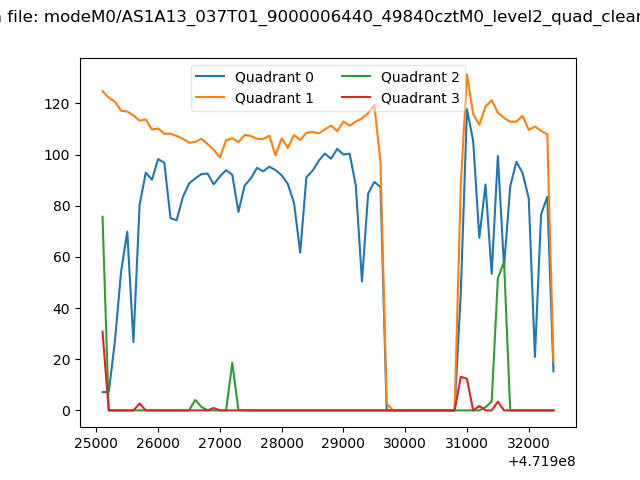 |
|
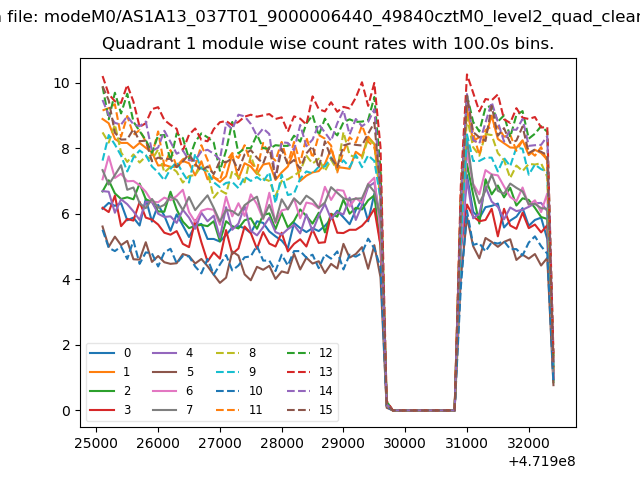
| Module-wise count rates for Quadrant A Data is divided into 100 sec bins |
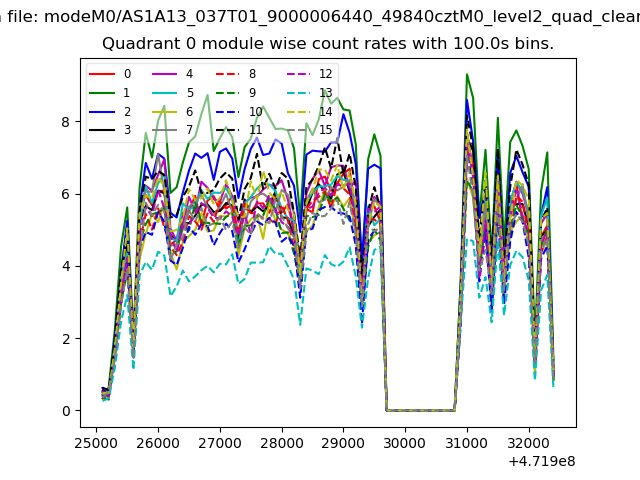 |
 |
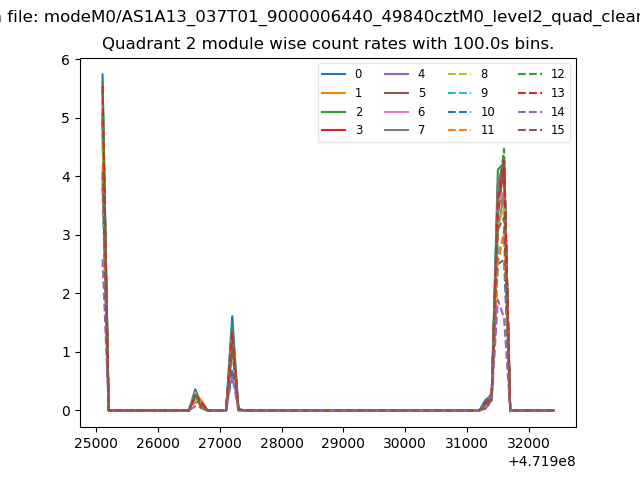
| Module-wise count rates for Quadrant B Data is divided into 100 sec bins |
 |
 |
| Module-wise count rates for Quadrant C Data is divided into 100 sec bins |
 |
 |
| Module-wise count rates for Quadrant D Data is divided into 100 sec bins |
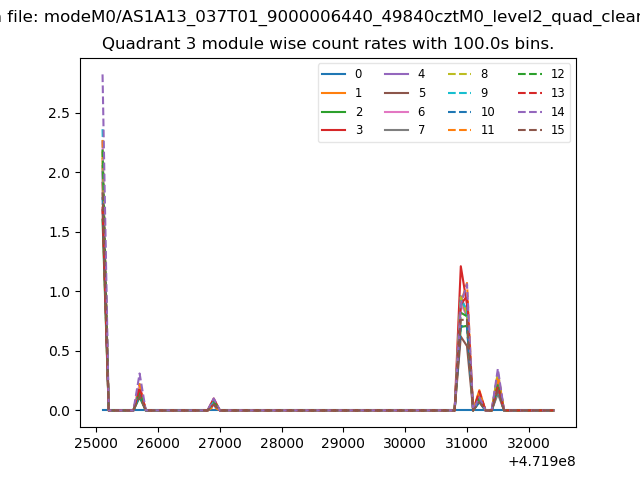 |
 |
| Parameter | Plot |
|---|---|
| CZT HV Monitor | 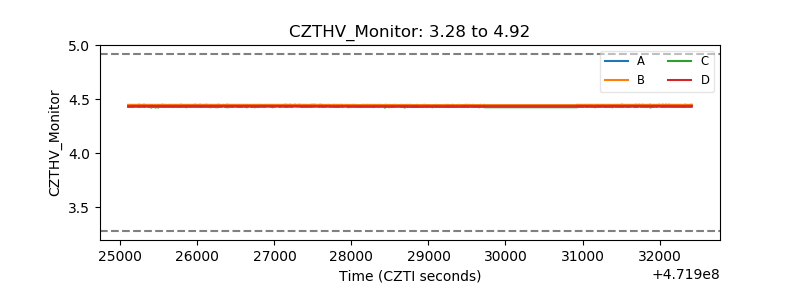 |
| D_VDD | 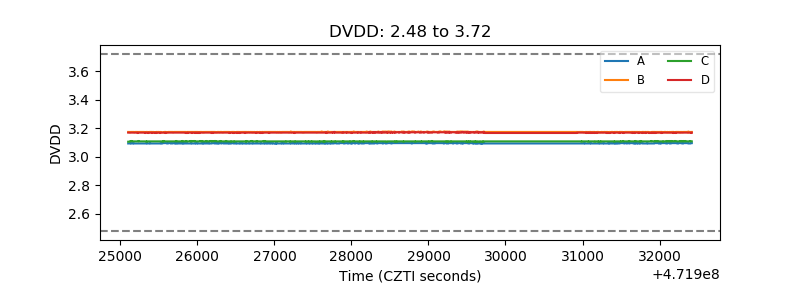 |
| Temperature 1 | 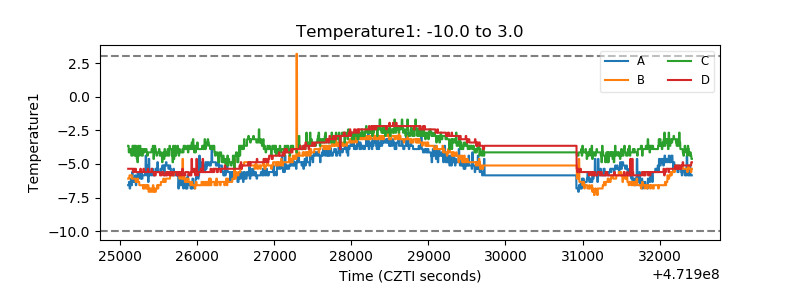 |
| Veto HV Monitor | 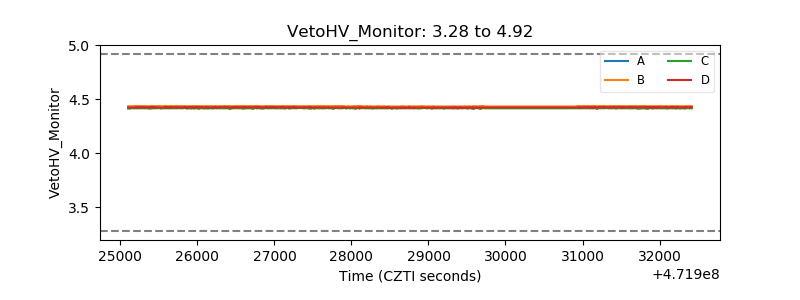 |
| Veto LLD | 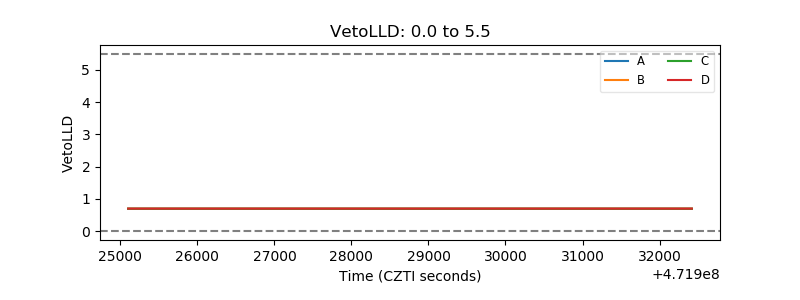 |
| Alpha Counter | 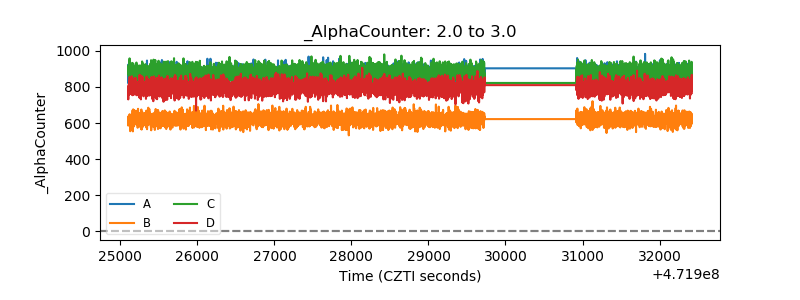 |
| _CPM_Rate | 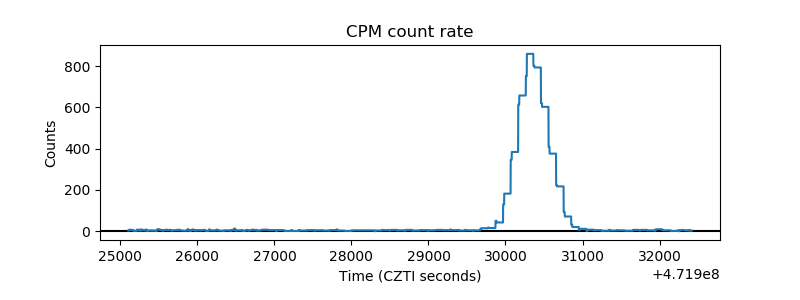 |
| CZT Counter | 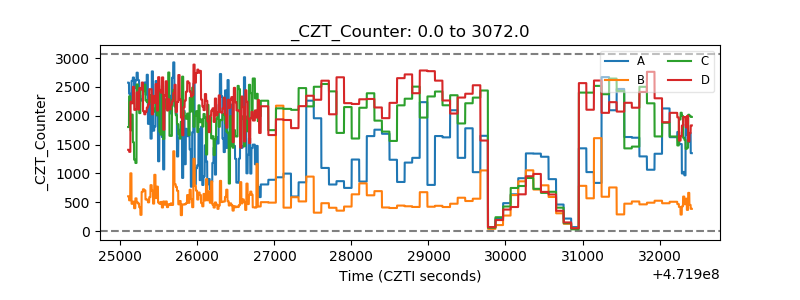 |
| +2.5 Volts monitor | 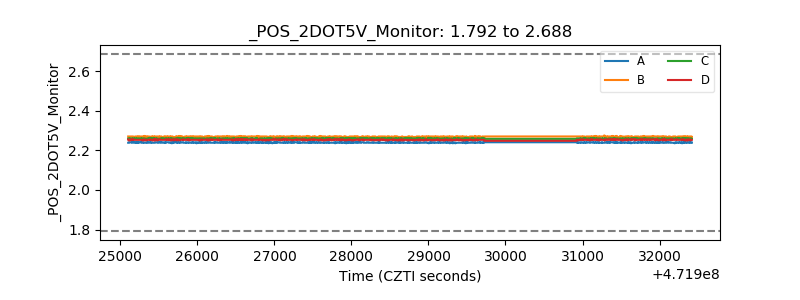 |
| +5 Volts monitor | 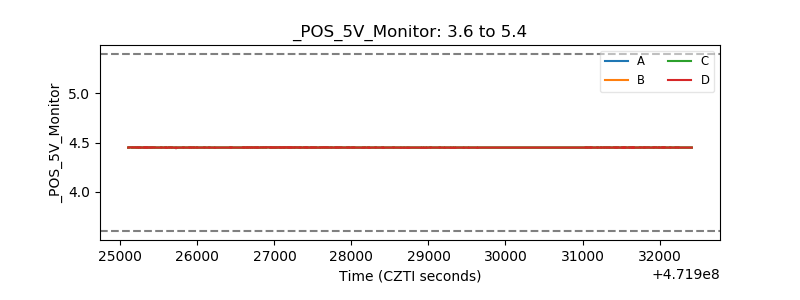 |
| _ROLL_ROT | 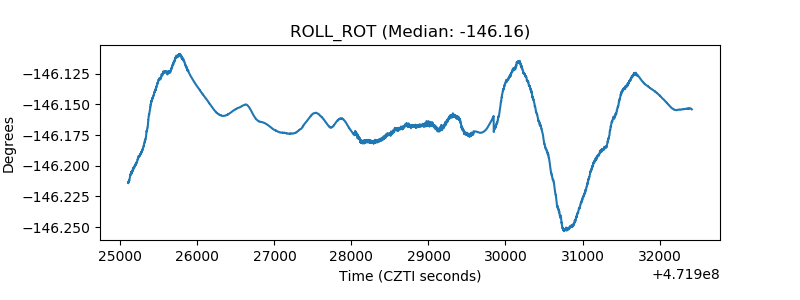 |
| _Roll_DEC | 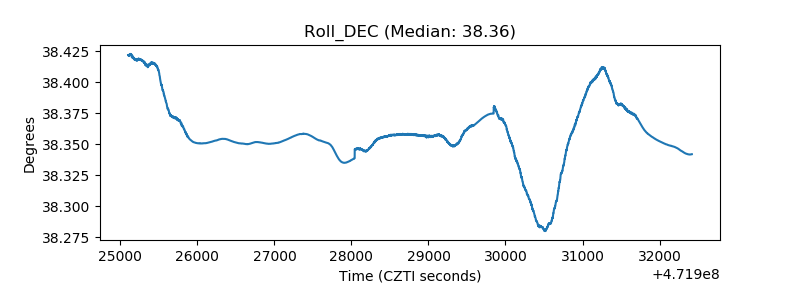 |
| _Roll_RA | 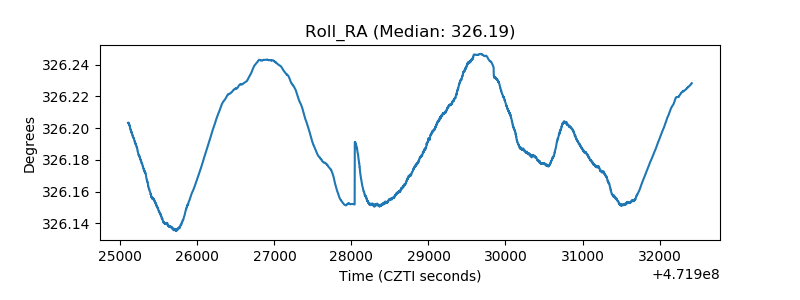 |
| Veto Counter | 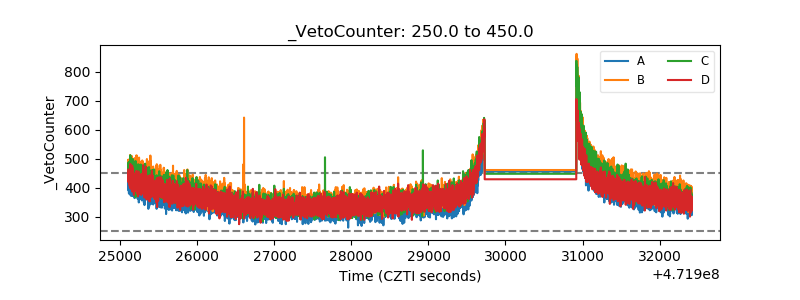 |