| Param | Original file | Final file |
|---|---|---|
| Filename | modeM0/AS1A13_037T01_9000006440_49841cztM0_level2.fits | modeM0/AS1A13_037T01_9000006440_49841cztM0_level2_quad_clean.evt |
| Size (bytes) | 1,124,726,400 | 48,139,200 |
| Size | 1.0 GB | 45.9 MB |
| Events in quadrant A | 11,833,882 | 351,968 |
| Events in quadrant B | 3,849,405 | 656,874 |
| Events in quadrant C | 11,833,066 | 14,207 |
| Events in quadrant D | 13,636,312 | 492 |
| Mode M9 | |||
|---|---|---|---|
| Quadrant | BADHDUFLAG | Total packets | Discarded packets |
| A | 0 | 11 | 0 |
| B | 0 | 11 | 0 |
| C | 0 | 11 | 0 |
| D | 0 | 11 | 0 |
| Mode SS | |||
|---|---|---|---|
| Quadrant | BADHDUFLAG | Total packets | Discarded packets |
| A | 0 | 126 | 0 |
| B | 0 | 126 | 0 |
| C | 0 | 126 | 0 |
| D | 0 | 126 | 0 |
| Mode M0 | |||
|---|---|---|---|
| Quadrant | BADHDUFLAG | Total packets | Discarded packets |
| A | 0 | 39423 | 1 |
| B | 0 | 15730 | 1 |
| C | 0 | 39443 | 1 |
| D | 0 | 44791 | 1 |
| Quadrant | Total seconds | Saturated seconds | Saturation percentage |
|---|---|---|---|
| A | 6215 | 3052 | 49.106999% |
| B | 6216 | 326 | 5.244530% |
| C | 6216 | 6102 | 98.166023% |
| D | 6216 | 6213 | 99.951737% |
Noise dominated data is calculated using 1-second bins in cleaned event files. If a bin has >2000 counts, and if more than 50% of those come from <1% of pixels, then it is considered to be noise-dominated and hence unusable.
| Quadrant | # 1 sec bins | Bins with >0 counts | Bins with >2000 counts | High rate bins dominated by noise | Noise dominated (total time) | Noise dominated (detector-on time) | Marked lightcurve |
|---|---|---|---|---|---|---|---|
| A | 7340 | 6216 | 2624 | 2624 | 35.75% | 42.21% | 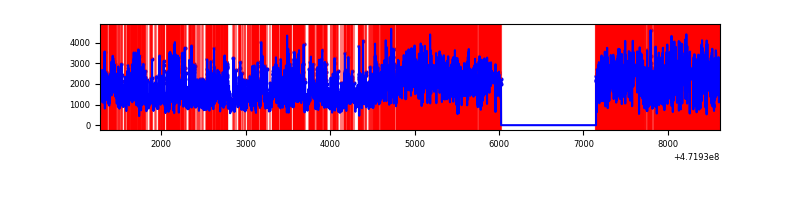 |
| B | 7341 | 6217 | 143 | 143 | 1.95% | 2.30% | 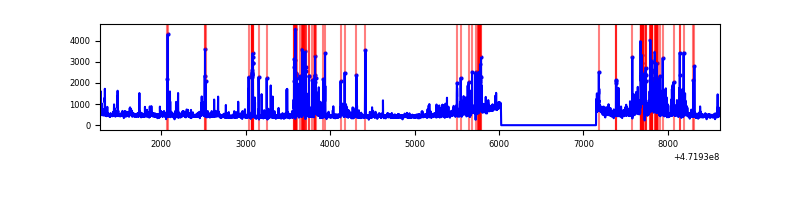 |
| C | 7340 | 6215 | 2324 | 2324 | 31.66% | 37.39% | 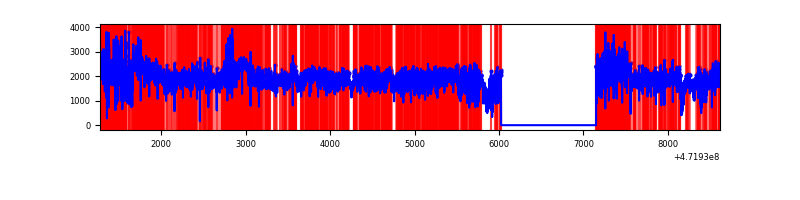 |
| D | 7340 | 6215 | 4477 | 4477 | 60.99% | 72.04% | 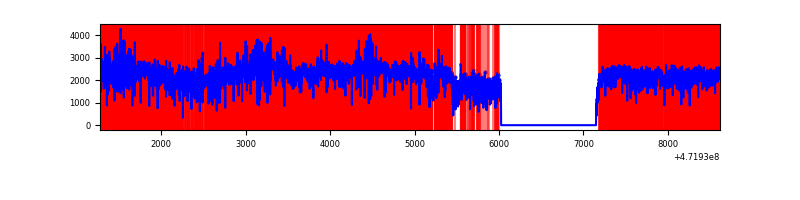 |
Top three noisy pixels from each quadrant. If the there are fewer than three noisy pixels in the level2.evt file, extra rows are filled as -1
| Pixel properties | Quadrant properties | ||||||
|---|---|---|---|---|---|---|---|
| Quadrant | DetID | PixID | Counts | Sigma | Mean | Median | Sigma |
| A | 3 | 84 | 3687332 | 25787.93 | 558 | 543 | 143.0 |
| A | 4 | 4 | 3480078 | 24338.26 | 558 | 543 | 143.0 |
| A | 3 | 130 | 377543 | 2637.0 | 558 | 543 | 143.0 |
| B | 4 | 206 | 448117 | 3033.48 | 687 | 665 | 147.5 |
| B | 5 | 185 | 245721 | 1661.35 | 687 | 665 | 147.5 |
| B | 0 | 229 | 167801 | 1133.09 | 687 | 665 | 147.5 |
| C | 15 | 197 | 3052726 | 68362.97 | 128 | 125 | 44.7 |
| C | 1 | 44 | 2116527 | 47396.8 | 128 | 125 | 44.7 |
| C | 15 | 230 | 1670993 | 37419.07 | 128 | 125 | 44.7 |
| D | 7 | 61 | 3363303 | 89113.32 | 110 | 105 | 37.7 |
| D | 8 | 176 | 3175055 | 84125.39 | 110 | 105 | 37.7 |
| D | 7 | 126 | 2475163 | 65580.63 | 110 | 105 | 37.7 |
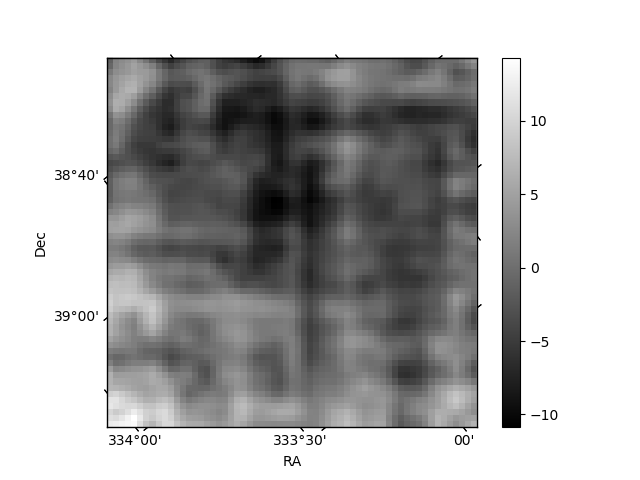
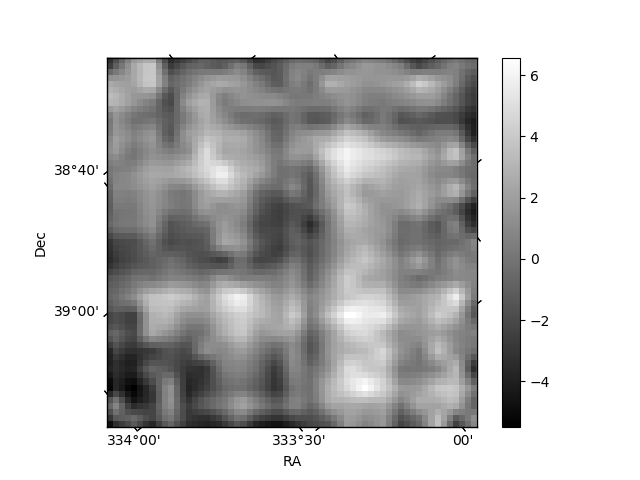
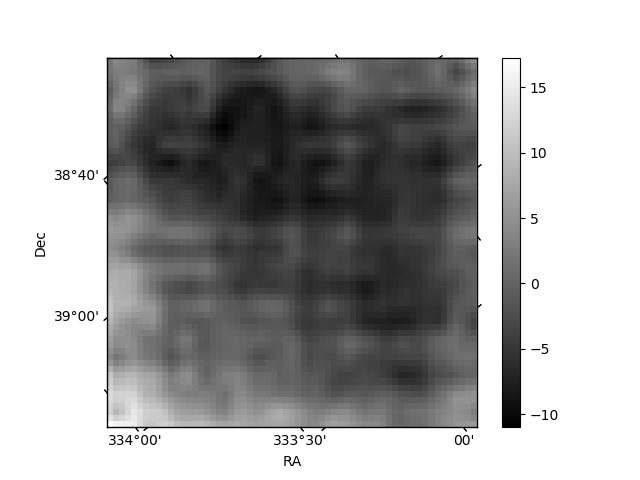
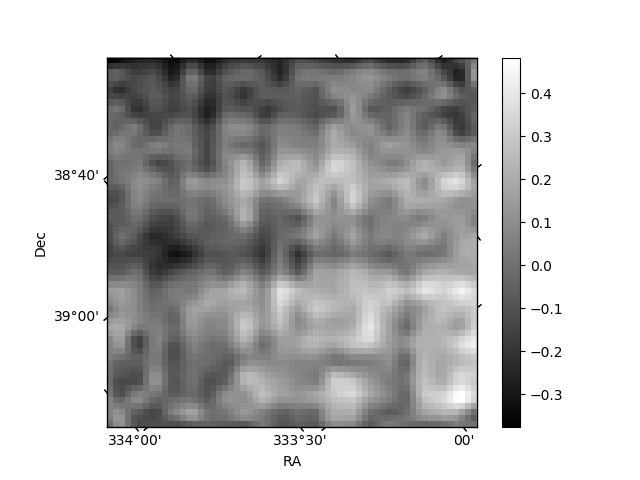
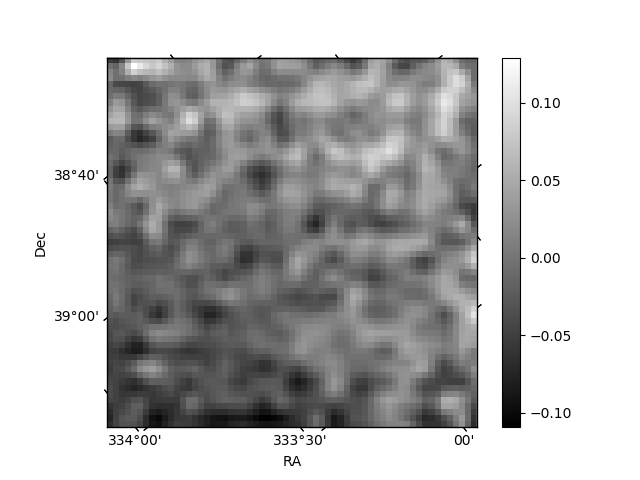
Histogram calculated using DETX and DETY for each event in the final _common_clean file
| Quadrant A | 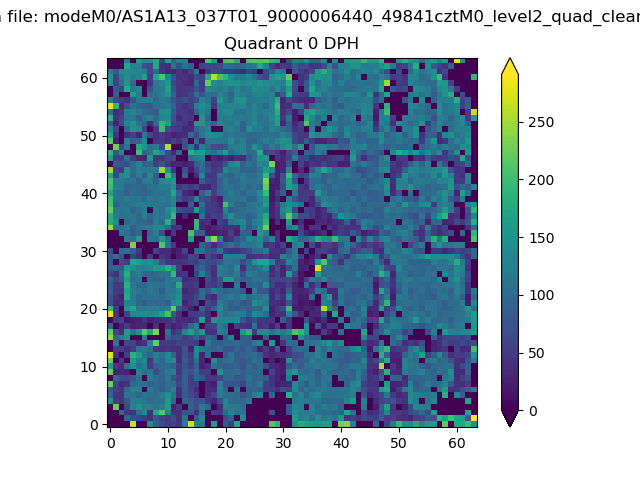 |
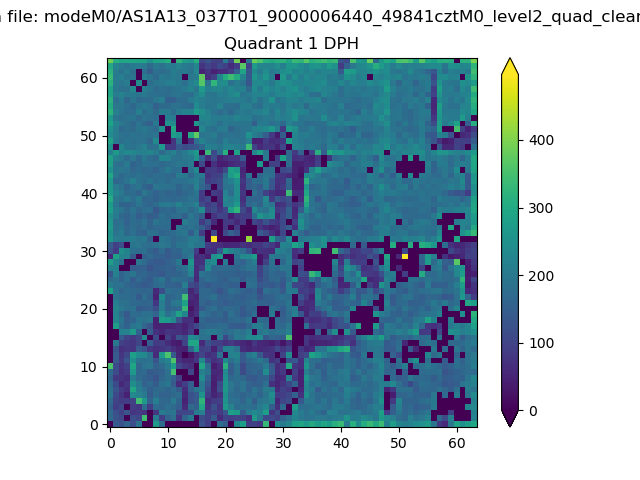 |
Quadrant B |
|---|---|---|---|
| Quadrant D | 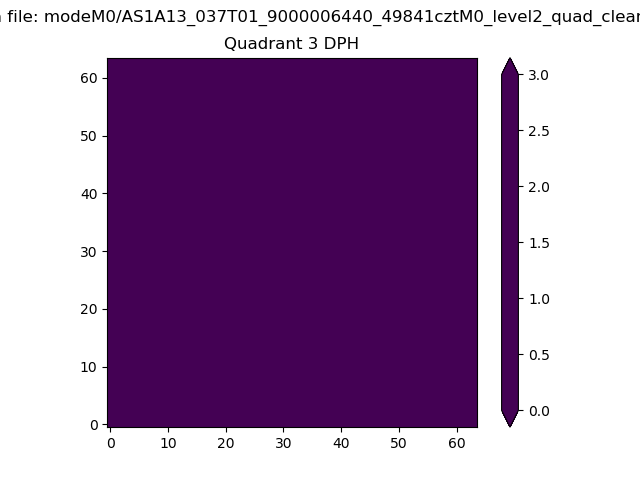 |
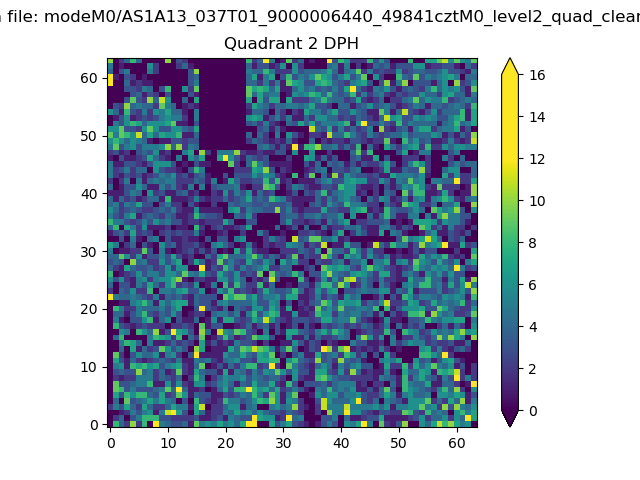 |
Quadrant C |
| Plot type | Count rate plots | Images |
|---|---|---|
| Comparison with Poisson distribution Blue bars denote a histogram of data divided into 1 sec bins. Red curve is a Poisson curve with rate = median count rate of data. |
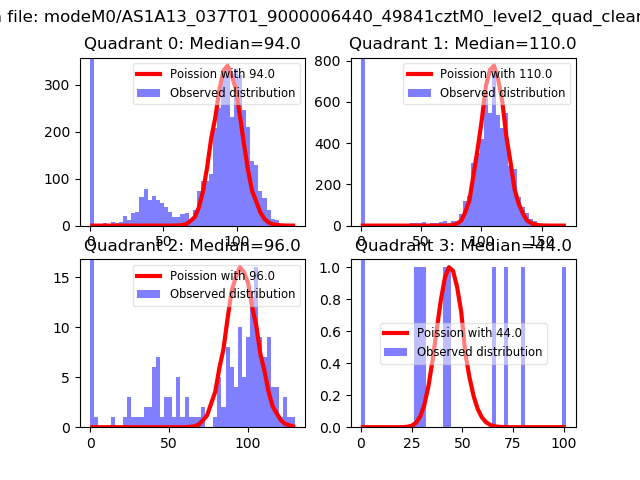 |
 |
| Quadrant-wise count rates Data is divided into 100 sec bins |
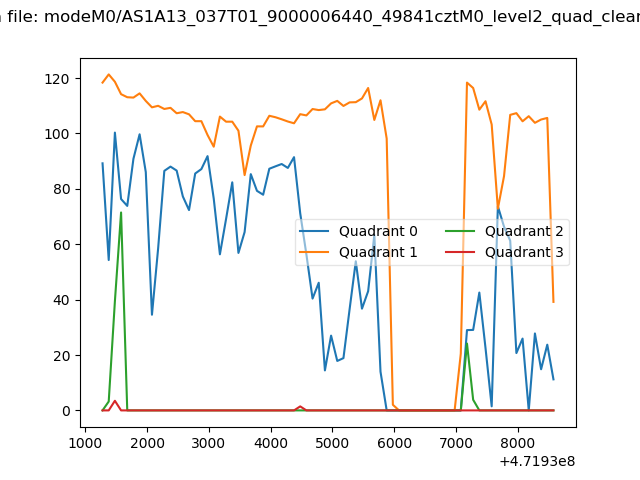 |
|
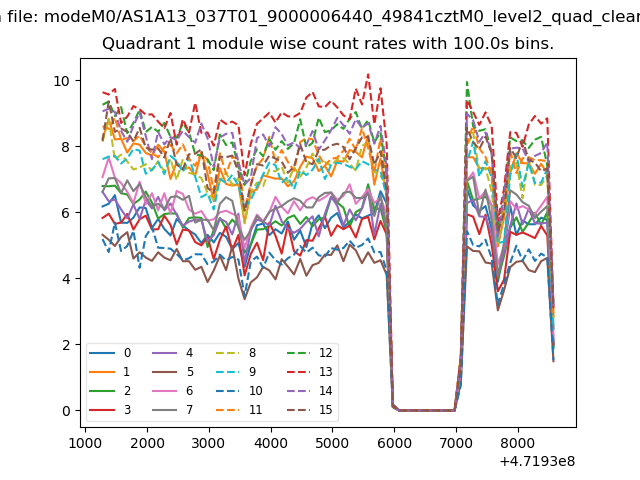
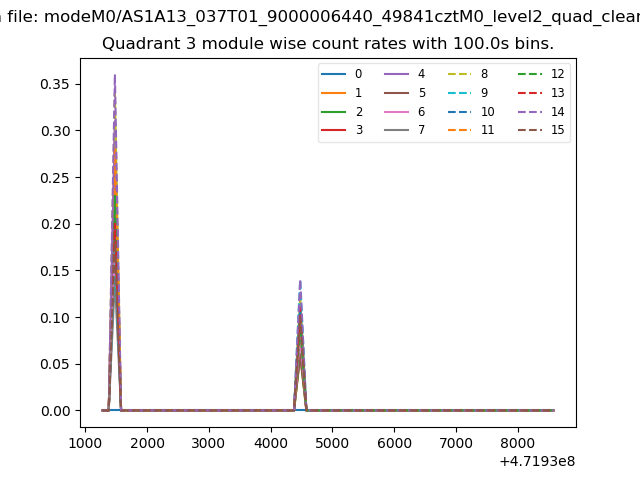
| Module-wise count rates for Quadrant A Data is divided into 100 sec bins |
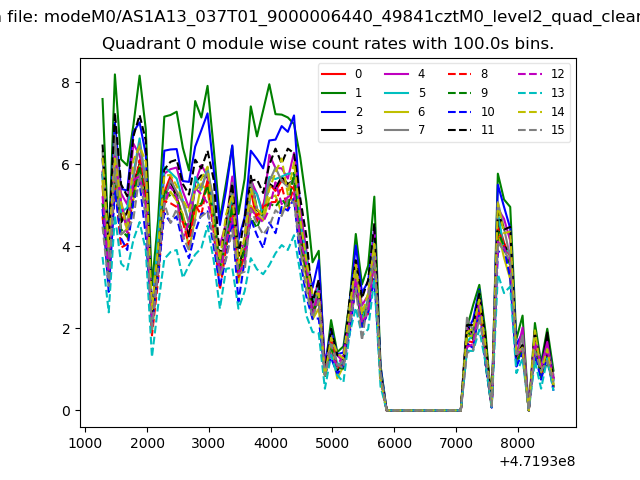 |
 |
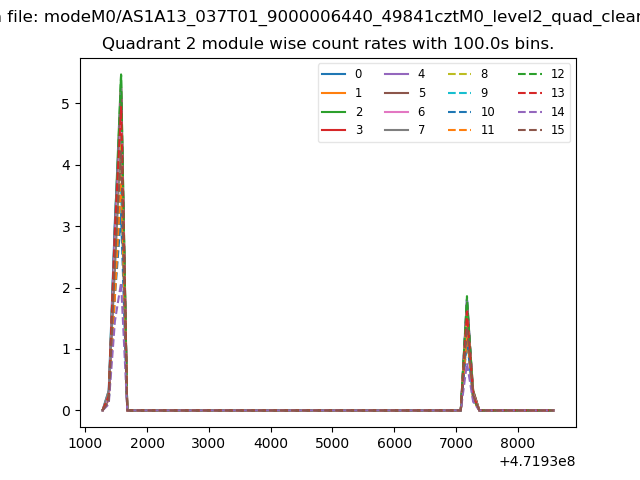
| Module-wise count rates for Quadrant B Data is divided into 100 sec bins |
 |
 |
| Module-wise count rates for Quadrant C Data is divided into 100 sec bins |
 |
 |
| Module-wise count rates for Quadrant D Data is divided into 100 sec bins |
 |
 |
| Parameter | Plot |
|---|---|
| CZT HV Monitor | 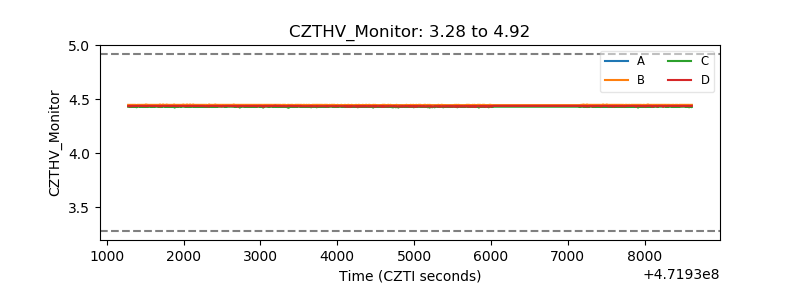 |
| D_VDD | 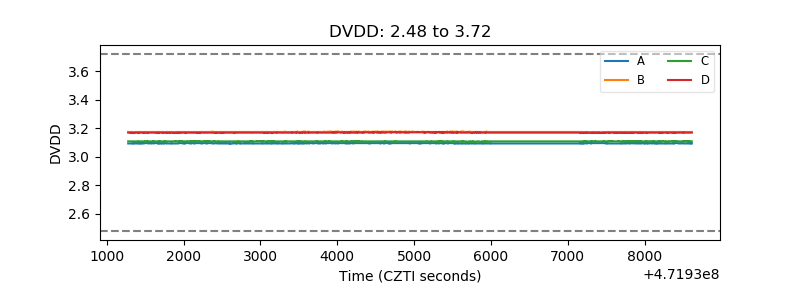 |
| Temperature 1 | 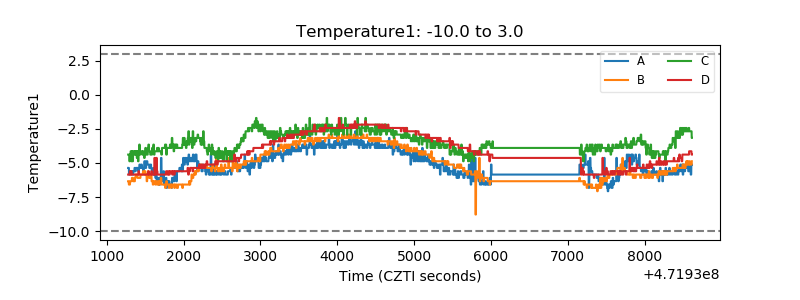 |
| Veto HV Monitor | 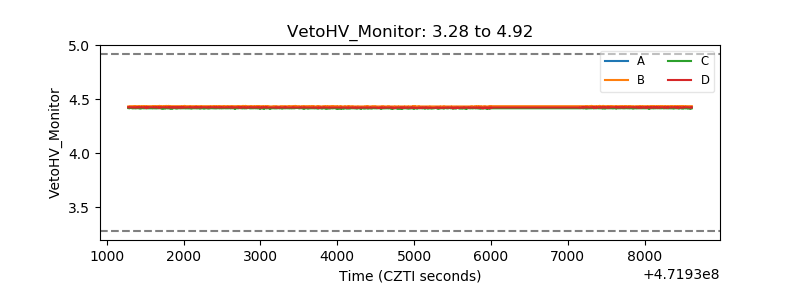 |
| Veto LLD | 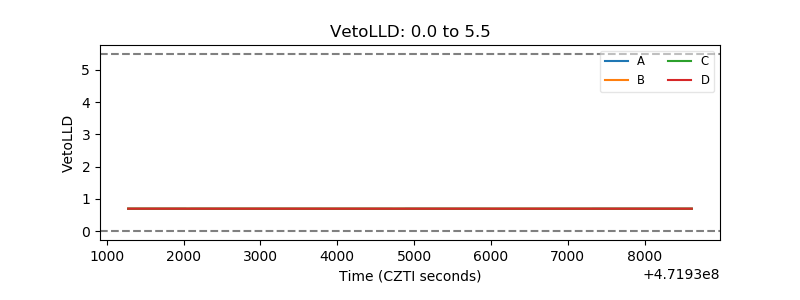 |
| Alpha Counter | 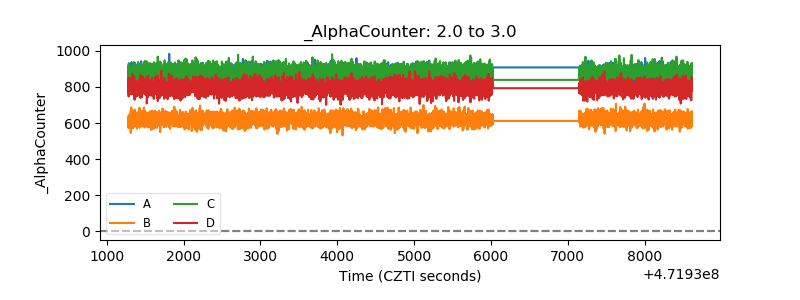 |
| _CPM_Rate | 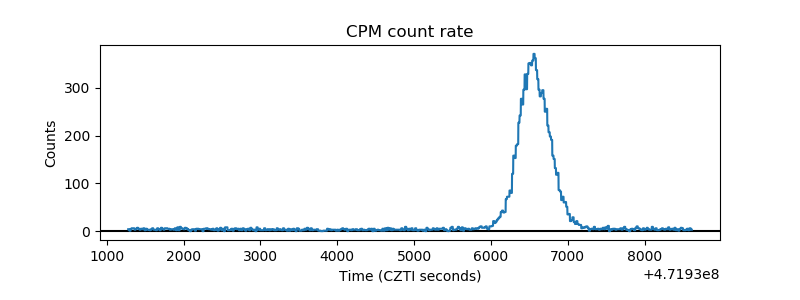 |
| CZT Counter | 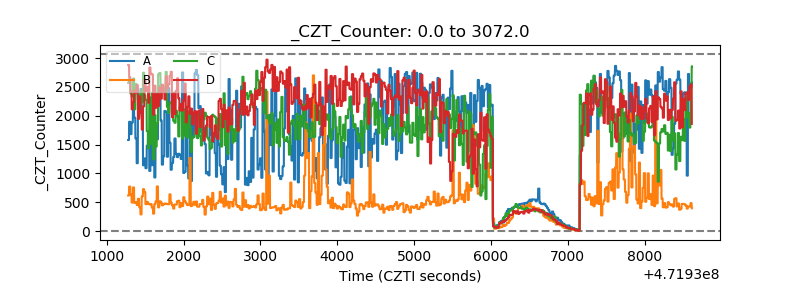 |
| +2.5 Volts monitor | 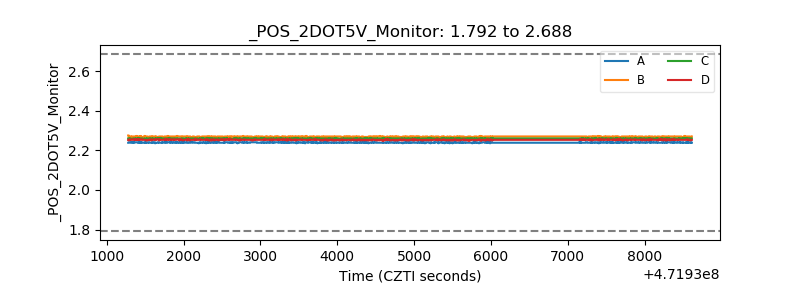 |
| +5 Volts monitor | 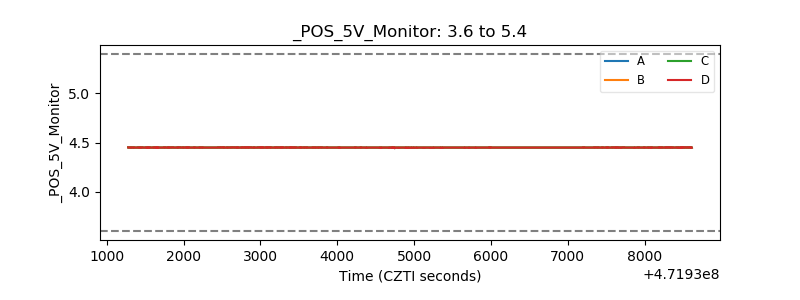 |
| _ROLL_ROT | 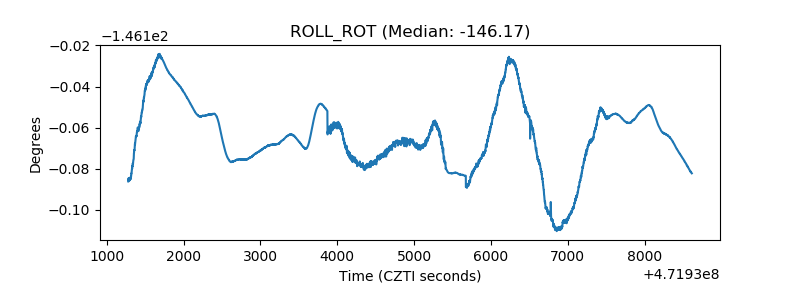 |
| _Roll_DEC | 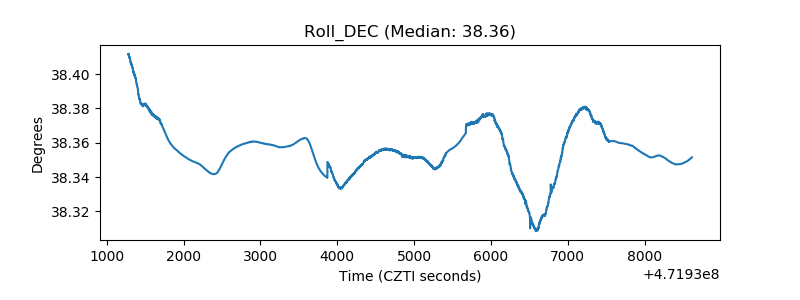 |
| _Roll_RA | 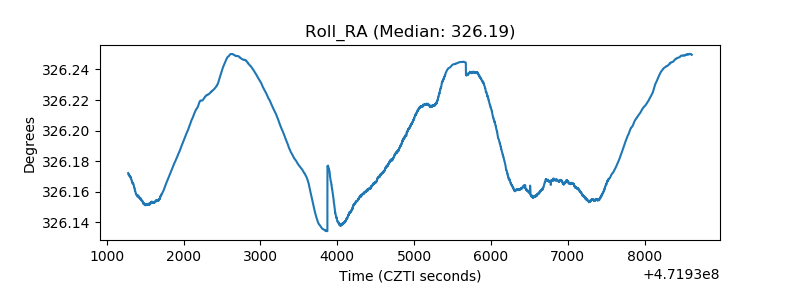 |
| Veto Counter | 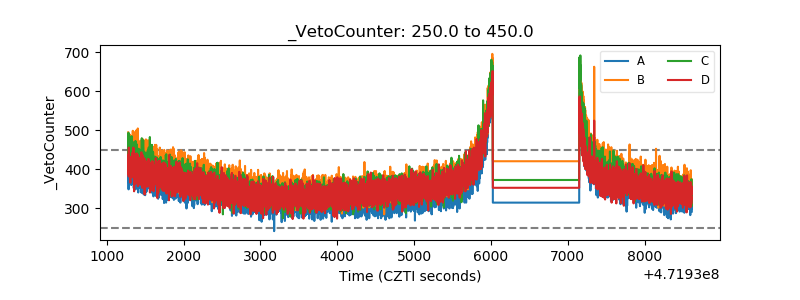 |