| Param | Original file | Final file |
|---|---|---|
| Filename | modeM0/AS1A13_037T01_9000006440_49842cztM0_level2.fits | modeM0/AS1A13_037T01_9000006440_49842cztM0_level2_quad_clean.evt |
| Size (bytes) | 1,167,001,920 | 51,065,280 |
| Size | 1.1 GB | 48.7 MB |
| Events in quadrant A | 11,437,661 | 391,059 |
| Events in quadrant B | 4,318,192 | 670,139 |
| Events in quadrant C | 12,783,893 | 8,241 |
| Events in quadrant D | 14,145,569 | 13,839 |
| Mode M9 | |||
|---|---|---|---|
| Quadrant | BADHDUFLAG | Total packets | Discarded packets |
| A | 0 | 9 | 0 |
| B | 0 | 9 | 0 |
| C | 0 | 9 | 0 |
| D | 0 | 9 | 0 |
| Mode SS | |||
|---|---|---|---|
| Quadrant | BADHDUFLAG | Total packets | Discarded packets |
| A | 0 | 136 | 0 |
| B | 0 | 136 | 0 |
| C | 0 | 136 | 0 |
| D | 0 | 136 | 0 |
| Mode M0 | |||
|---|---|---|---|
| Quadrant | BADHDUFLAG | Total packets | Discarded packets |
| A | 0 | 38610 | 1 |
| B | 0 | 17489 | 1 |
| C | 0 | 42576 | 1 |
| D | 0 | 46570 | 1 |
| Quadrant | Total seconds | Saturated seconds | Saturation percentage |
|---|---|---|---|
| A | 6630 | 2845 | 42.911011% |
| B | 6630 | 401 | 6.048265% |
| C | 6631 | 6566 | 99.019756% |
| D | 6631 | 6514 | 98.235560% |
Noise dominated data is calculated using 1-second bins in cleaned event files. If a bin has >2000 counts, and if more than 50% of those come from <1% of pixels, then it is considered to be noise-dominated and hence unusable.
| Quadrant | # 1 sec bins | Bins with >0 counts | Bins with >2000 counts | High rate bins dominated by noise | Noise dominated (total time) | Noise dominated (detector-on time) | Marked lightcurve |
|---|---|---|---|---|---|---|---|
| A | 7520 | 6630 | 2336 | 2336 | 31.06% | 35.23% | 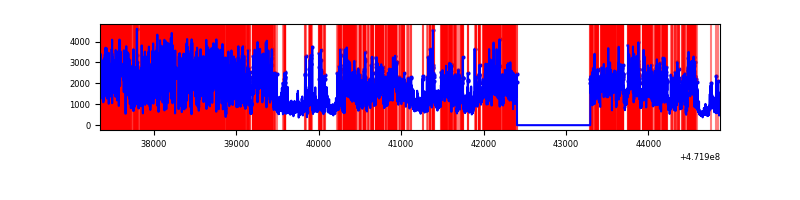 |
| B | 7520 | 6631 | 155 | 155 | 2.06% | 2.34% | 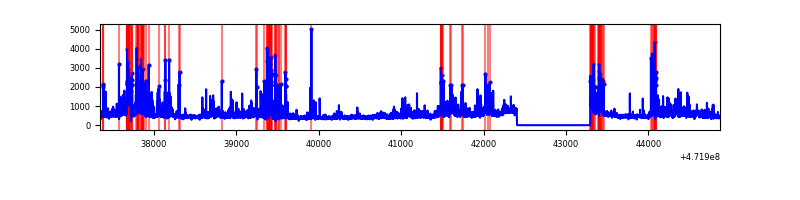 |
| C | 7521 | 6631 | 2914 | 2914 | 38.74% | 43.95% | 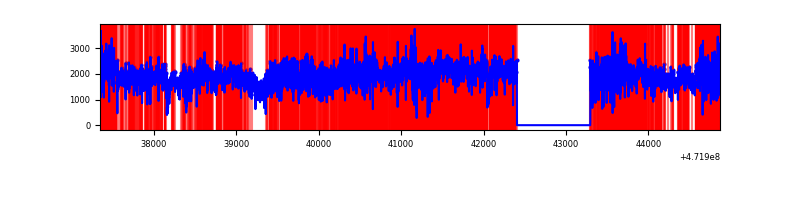 |
| D | 7520 | 6630 | 4584 | 4584 | 60.96% | 69.14% | 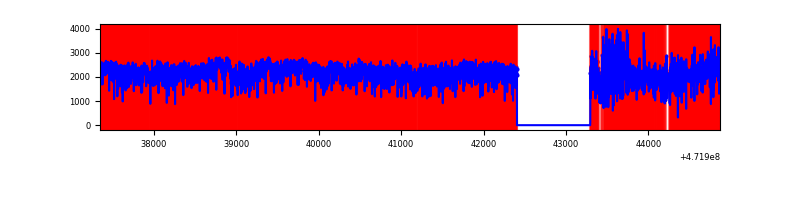 |
Top three noisy pixels from each quadrant. If the there are fewer than three noisy pixels in the level2.evt file, extra rows are filled as -1
| Pixel properties | Quadrant properties | ||||||
|---|---|---|---|---|---|---|---|
| Quadrant | DetID | PixID | Counts | Sigma | Mean | Median | Sigma |
| A | 3 | 84 | 4733778 | 29839.7 | 611 | 596 | 158.6 |
| A | 4 | 4 | 1705433 | 10747.91 | 611 | 596 | 158.6 |
| A | 3 | 130 | 323681 | 2036.85 | 611 | 596 | 158.6 |
| B | 5 | 185 | 433127 | 2837.97 | 715 | 693 | 152.4 |
| B | 4 | 206 | 372801 | 2442.06 | 715 | 693 | 152.4 |
| B | 0 | 229 | 325224 | 2129.82 | 715 | 693 | 152.4 |
| C | 15 | 230 | 3020840 | 58168.02 | 156 | 153 | 51.9 |
| C | 15 | 197 | 2792840 | 53777.53 | 156 | 153 | 51.9 |
| C | 1 | 44 | 1780893 | 34290.92 | 156 | 153 | 51.9 |
| D | 8 | 176 | 6974985 | 170739.84 | 113 | 107 | 40.9 |
| D | 7 | 61 | 2645603 | 64759.78 | 113 | 107 | 40.9 |
| D | 7 | 126 | 702971 | 17205.59 | 113 | 107 | 40.9 |
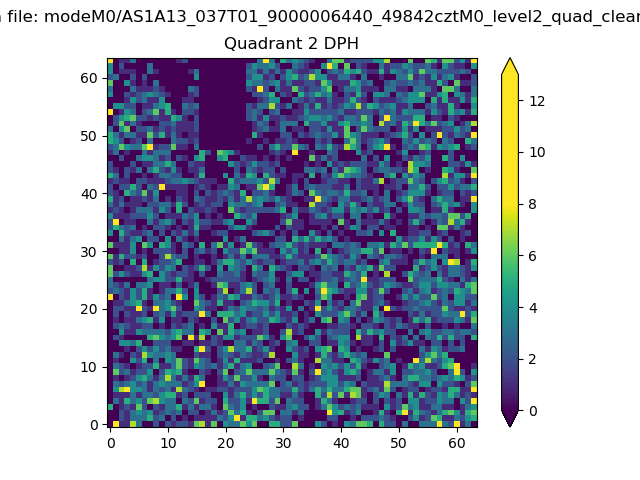
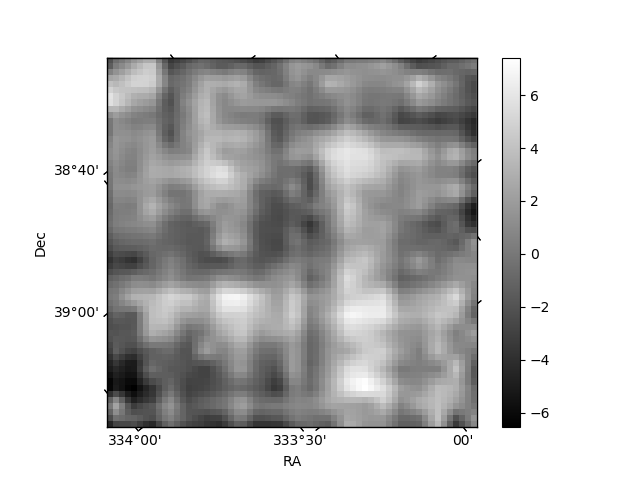
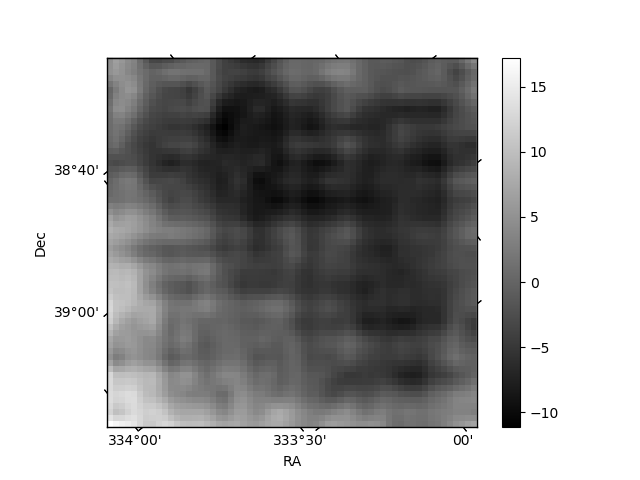
Histogram calculated using DETX and DETY for each event in the final _common_clean file
| Quadrant A | 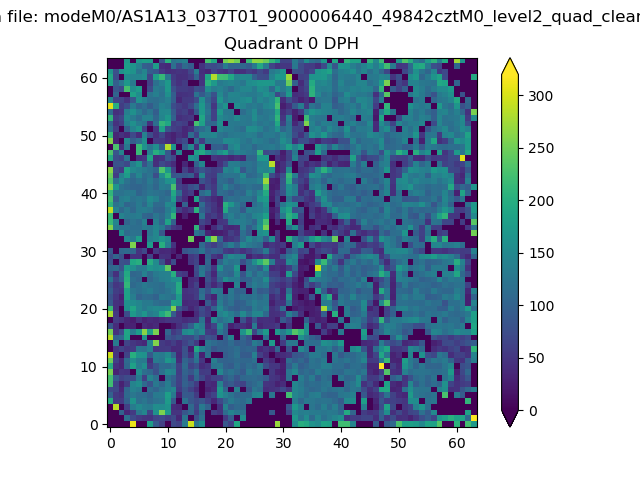 |
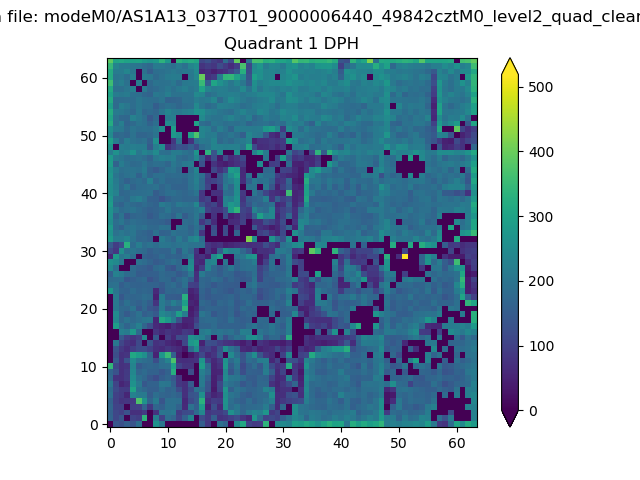 |
Quadrant B |
|---|---|---|---|
| Quadrant D | 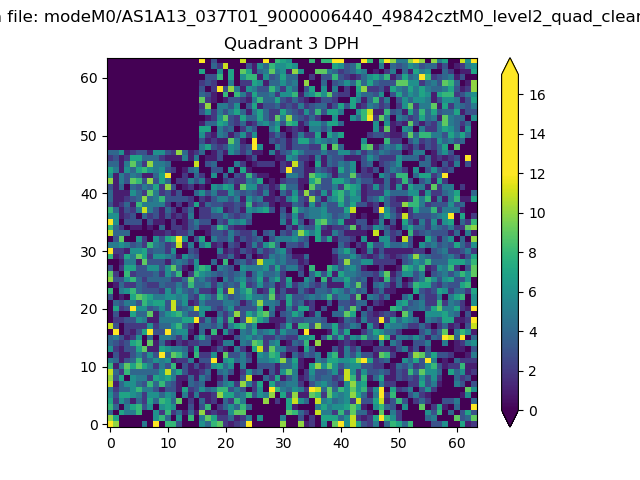 |
 |
Quadrant C |
| Plot type | Count rate plots | Images |
|---|---|---|
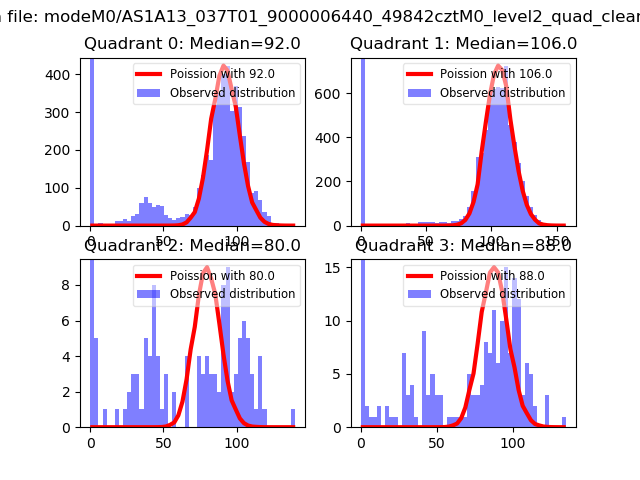
| Comparison with Poisson distribution Blue bars denote a histogram of data divided into 1 sec bins. Red curve is a Poisson curve with rate = median count rate of data. |
 |
 |
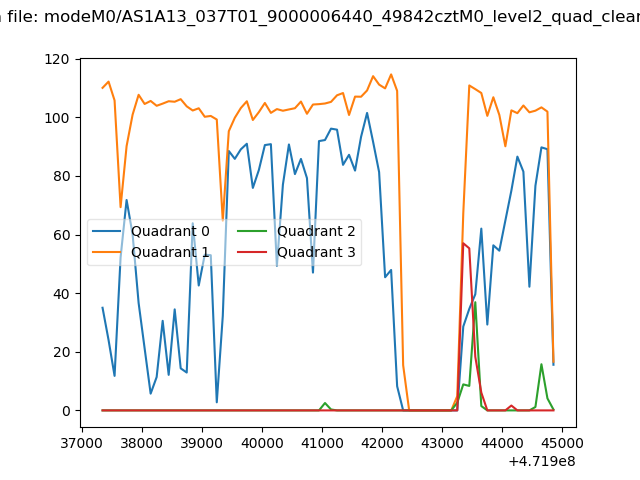
| Quadrant-wise count rates Data is divided into 100 sec bins |
 |
|
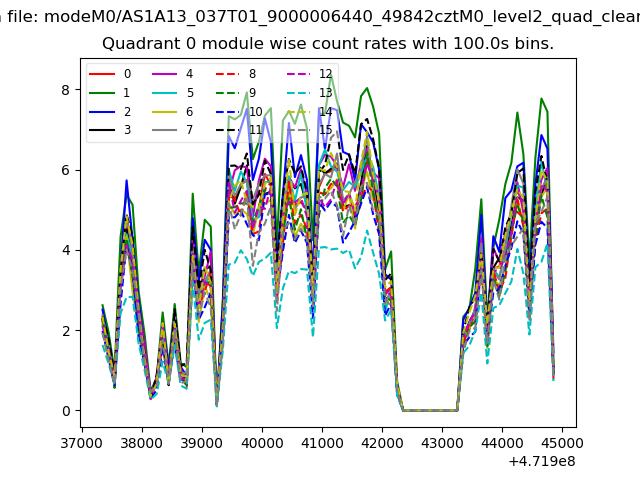
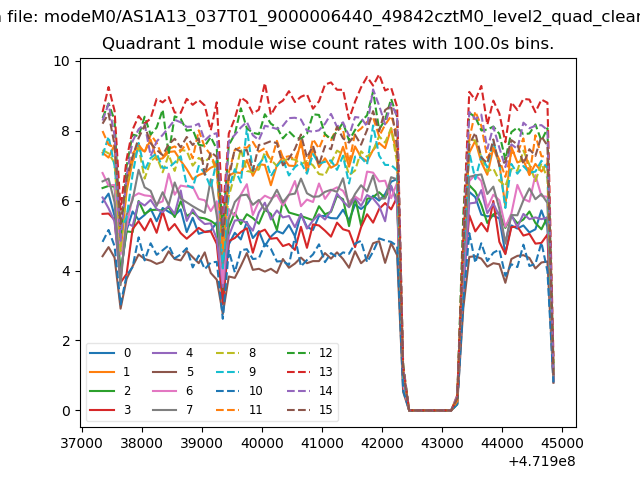
| Module-wise count rates for Quadrant A Data is divided into 100 sec bins |
 |
 |
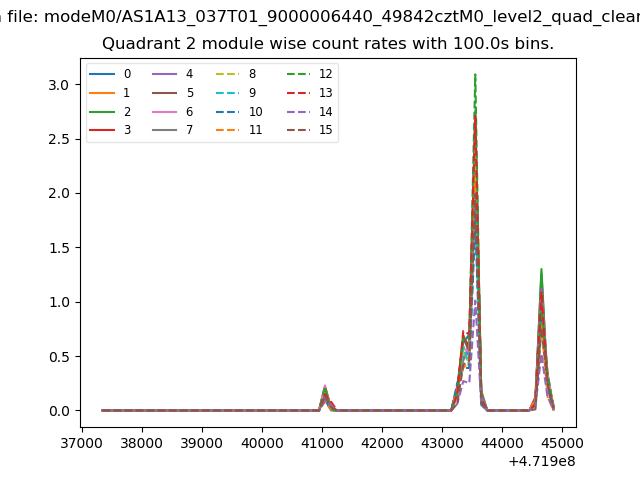
| Module-wise count rates for Quadrant B Data is divided into 100 sec bins |
 |
 |
| Module-wise count rates for Quadrant C Data is divided into 100 sec bins |
 |
 |
| Module-wise count rates for Quadrant D Data is divided into 100 sec bins |
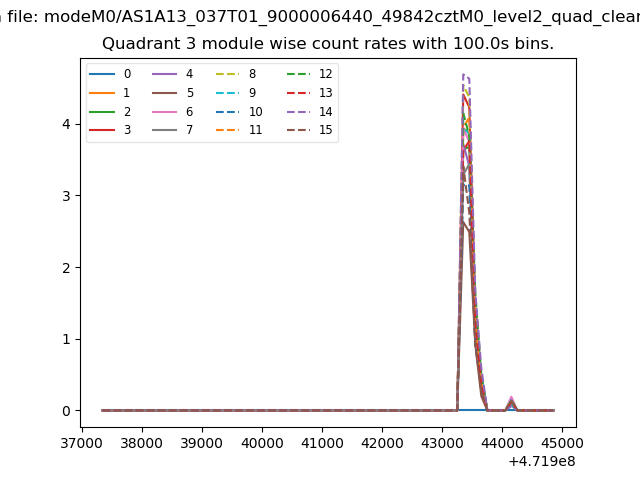 |
 |
| Parameter | Plot |
|---|---|
| CZT HV Monitor | 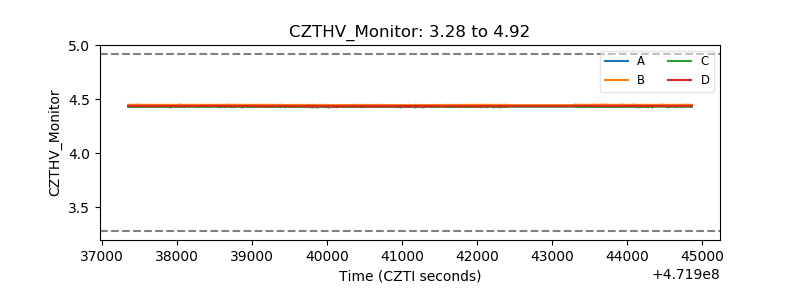 |
| D_VDD | 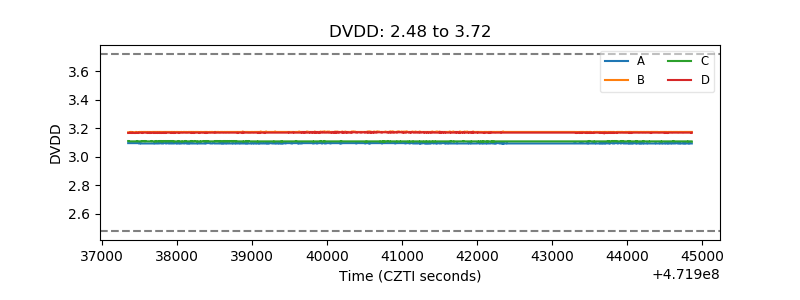 |
| Temperature 1 | 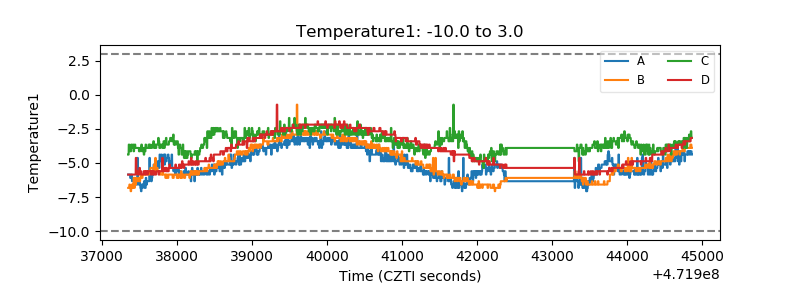 |
| Veto HV Monitor | 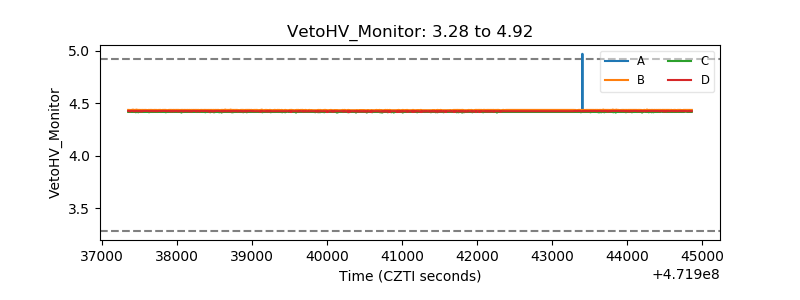 |
| Veto LLD | 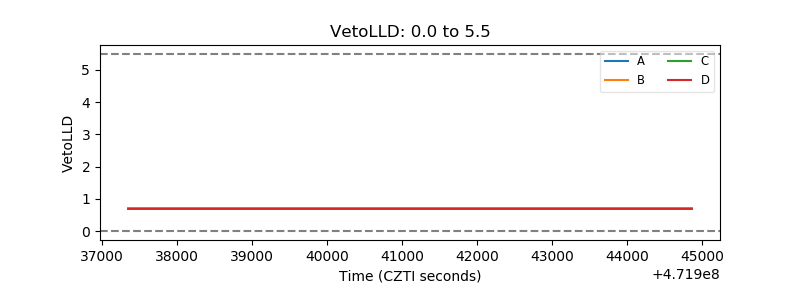 |
| Alpha Counter | 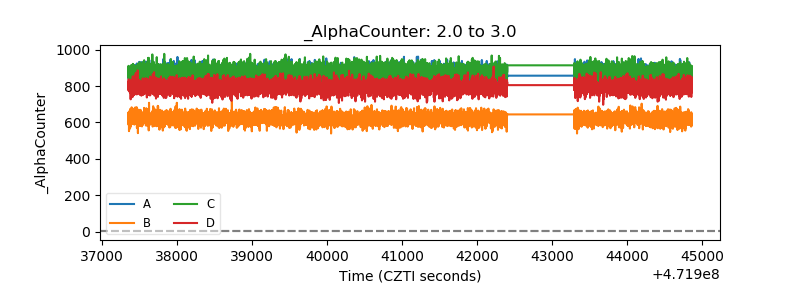 |
| _CPM_Rate | 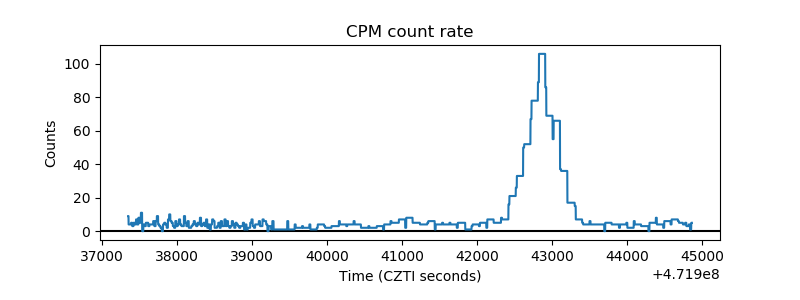 |
| CZT Counter | 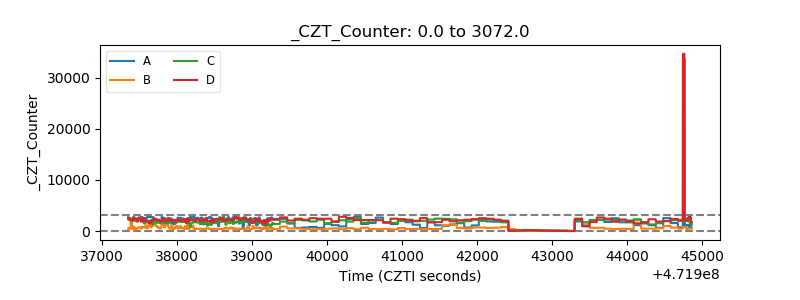 |
| +2.5 Volts monitor | 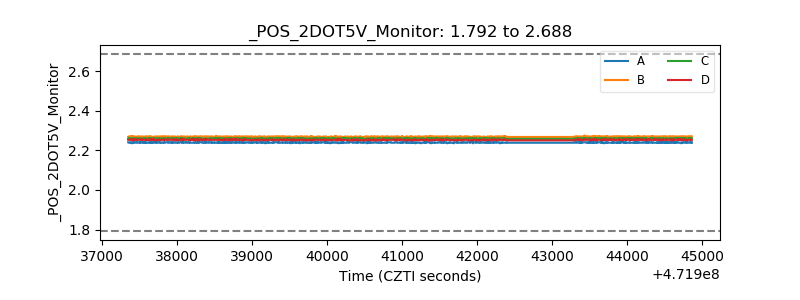 |
| +5 Volts monitor | 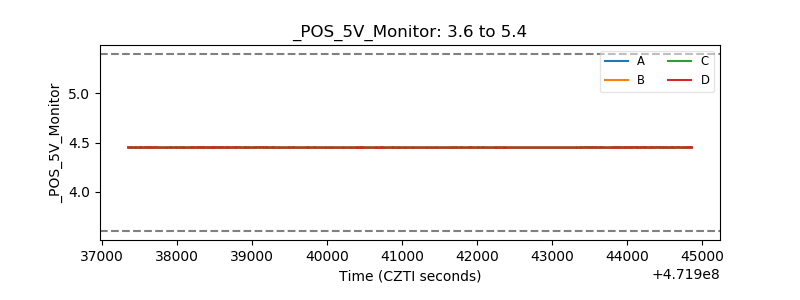 |
| _ROLL_ROT | 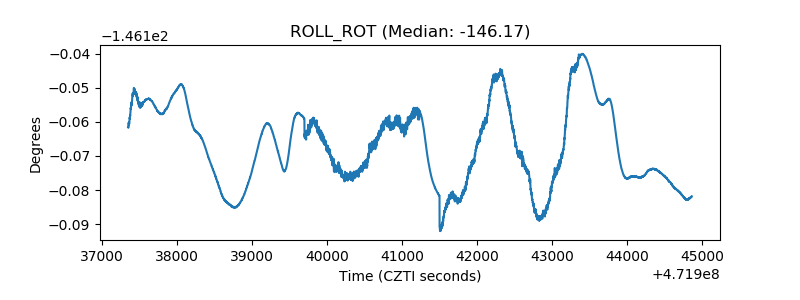 |
| _Roll_DEC | 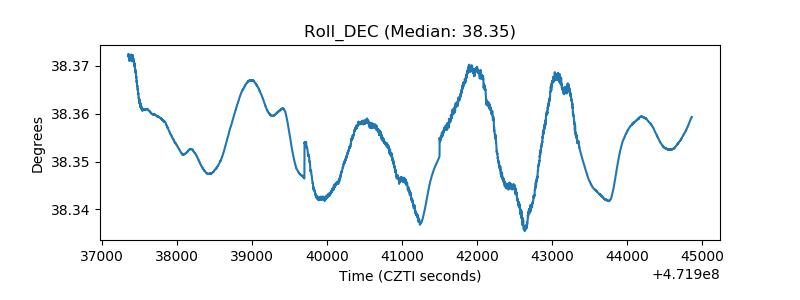 |
| _Roll_RA | 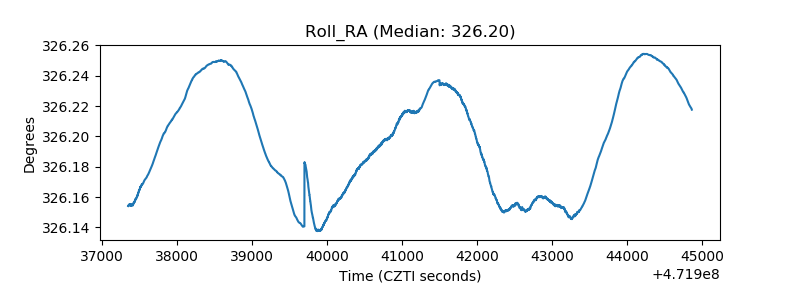 |
| Veto Counter | 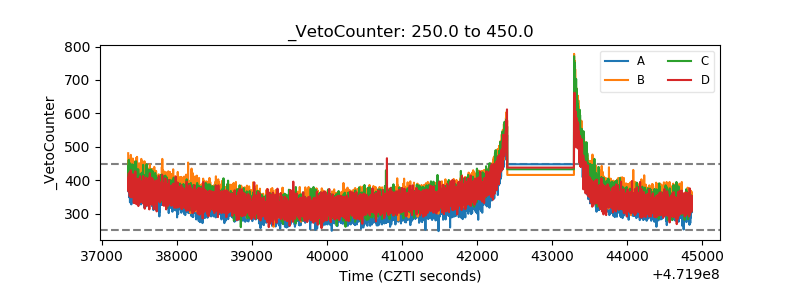 |