| Param | Original file | Final file |
|---|---|---|
| Filename | modeM0/AS1A13_037T01_9000006440_49843cztM0_level2.fits | modeM0/AS1A13_037T01_9000006440_49843cztM0_level2_quad_clean.evt |
| Size (bytes) | 1,163,283,840 | 55,552,320 |
| Size | 1.1 GB | 53.0 MB |
| Events in quadrant A | 9,103,835 | 499,830 |
| Events in quadrant B | 3,962,183 | 688,120 |
| Events in quadrant C | 14,294,366 | 12,403 |
| Events in quadrant D | 15,166,809 | 1,528 |
| Mode M9 | |||
|---|---|---|---|
| Quadrant | BADHDUFLAG | Total packets | Discarded packets |
| A | 0 | 3 | 0 |
| B | 0 | 3 | 0 |
| C | 0 | 3 | 0 |
| D | 0 | 3 | 0 |
| Mode SS | |||
|---|---|---|---|
| Quadrant | BADHDUFLAG | Total packets | Discarded packets |
| A | 0 | 138 | 0 |
| B | 0 | 138 | 0 |
| C | 0 | 138 | 0 |
| D | 0 | 138 | 0 |
| Mode M0 | |||
|---|---|---|---|
| Quadrant | BADHDUFLAG | Total packets | Discarded packets |
| A | 0 | 31916 | 1 |
| B | 0 | 16504 | 1 |
| C | 0 | 47194 | 1 |
| D | 0 | 49786 | 1 |
| Quadrant | Total seconds | Saturated seconds | Saturation percentage |
|---|---|---|---|
| A | 6893 | 1764 | 25.591179% |
| B | 6892 | 356 | 5.165409% |
| C | 6892 | 6788 | 98.491004% |
| D | 6892 | 6881 | 99.840395% |
Noise dominated data is calculated using 1-second bins in cleaned event files. If a bin has >2000 counts, and if more than 50% of those come from <1% of pixels, then it is considered to be noise-dominated and hence unusable.
| Quadrant | # 1 sec bins | Bins with >0 counts | Bins with >2000 counts | High rate bins dominated by noise | Noise dominated (total time) | Noise dominated (detector-on time) | Marked lightcurve |
|---|---|---|---|---|---|---|---|
| A | 7128 | 6894 | 1229 | 1229 | 17.24% | 17.83% | 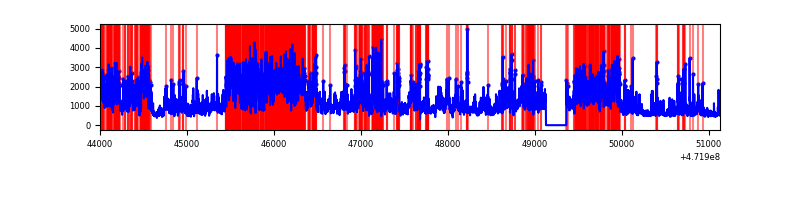 |
| B | 7127 | 6893 | 43 | 43 | 0.60% | 0.62% | 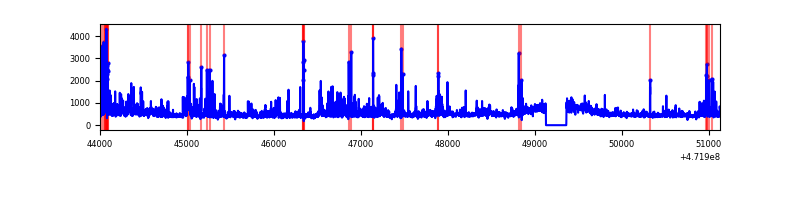 |
| C | 7127 | 6892 | 4166 | 4166 | 58.45% | 60.45% | 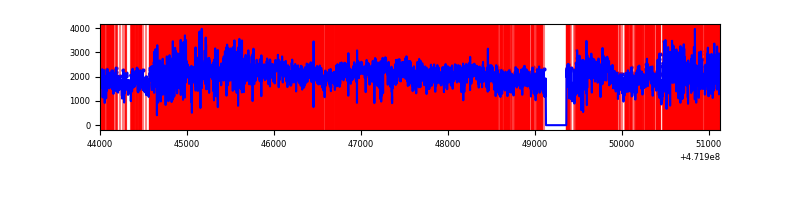 |
| D | 7126 | 6891 | 4885 | 4885 | 68.55% | 70.89% | 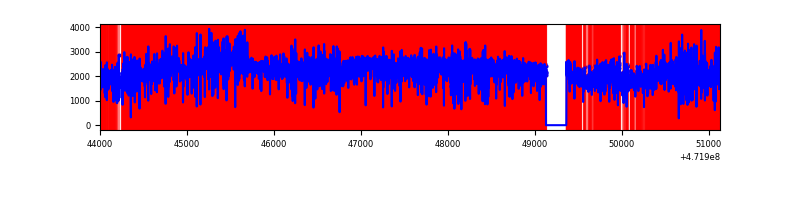 |
Top three noisy pixels from each quadrant. If the there are fewer than three noisy pixels in the level2.evt file, extra rows are filled as -1
| Pixel properties | Quadrant properties | ||||||
|---|---|---|---|---|---|---|---|
| Quadrant | DetID | PixID | Counts | Sigma | Mean | Median | Sigma |
| A | 3 | 84 | 2227034 | 12815.81 | 702 | 684 | 173.7 |
| A | 4 | 4 | 1418856 | 8163.59 | 702 | 684 | 173.7 |
| A | 3 | 14 | 483603 | 2779.88 | 702 | 684 | 173.7 |
| B | 0 | 229 | 249011 | 1524.1 | 757 | 729 | 162.9 |
| B | 10 | 28 | 240445 | 1471.52 | 757 | 729 | 162.9 |
| B | 4 | 206 | 226428 | 1385.48 | 757 | 729 | 162.9 |
| C | 15 | 230 | 3456632 | 51233.1 | 193 | 189 | 67.5 |
| C | 15 | 197 | 2484704 | 36826.7 | 193 | 189 | 67.5 |
| C | 15 | 164 | 1364217 | 20218.29 | 193 | 189 | 67.5 |
| D | 8 | 129 | 3582530 | 57433.98 | 195 | 186 | 62.4 |
| D | 7 | 61 | 3478558 | 55767.04 | 195 | 186 | 62.4 |
| D | 15 | 185 | 1489231 | 23873.13 | 195 | 186 | 62.4 |
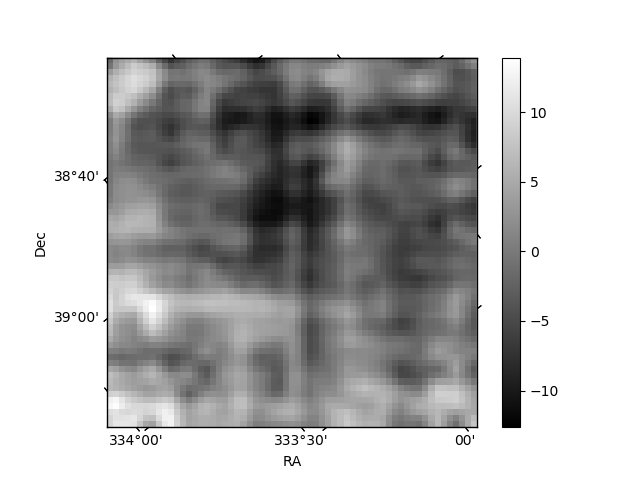
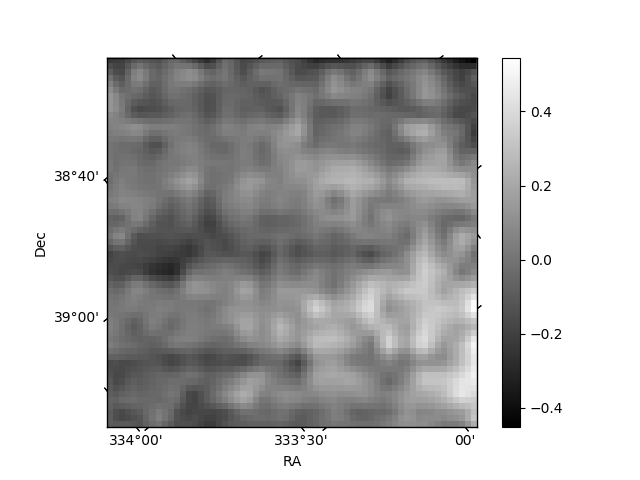
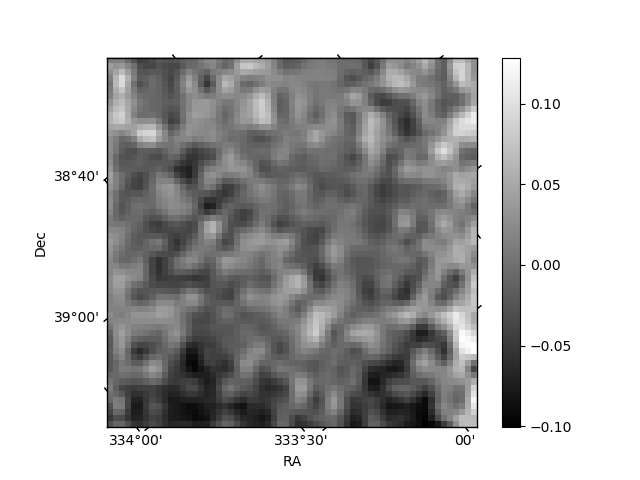
Histogram calculated using DETX and DETY for each event in the final _common_clean file
| Quadrant A | 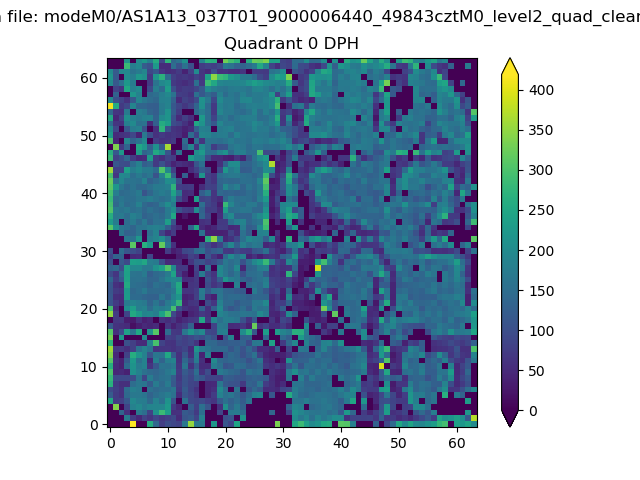 |
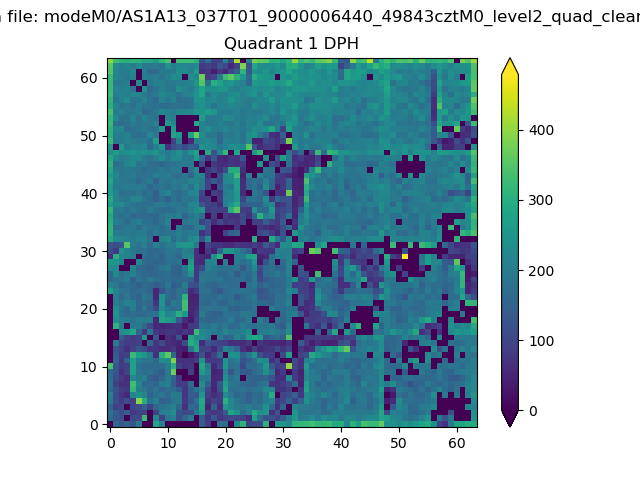 |
Quadrant B |
|---|---|---|---|
| Quadrant D | 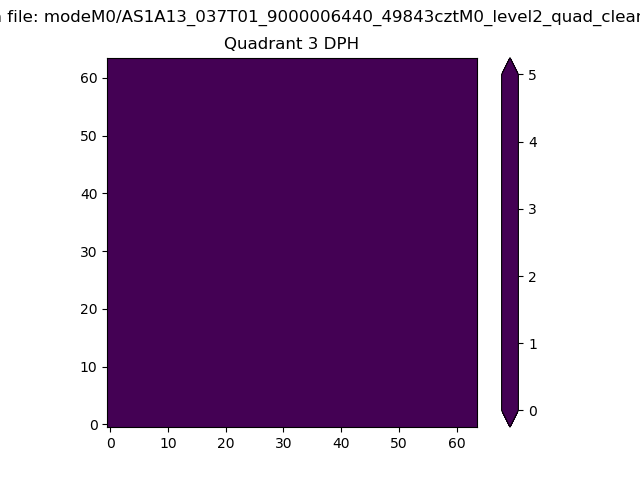 |
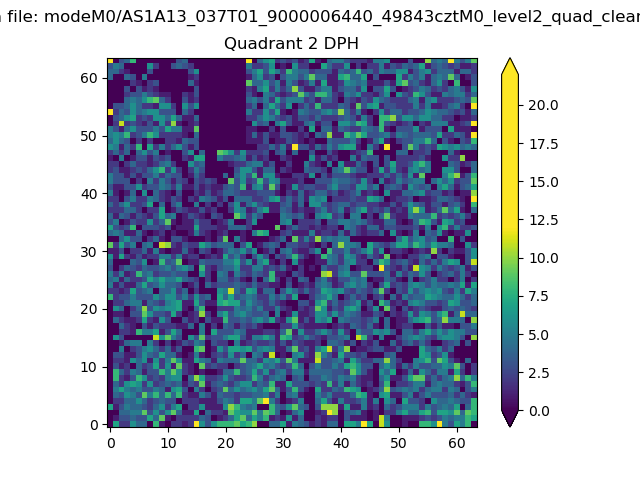 |
Quadrant C |
| Plot type | Count rate plots | Images |
|---|---|---|
| Comparison with Poisson distribution Blue bars denote a histogram of data divided into 1 sec bins. Red curve is a Poisson curve with rate = median count rate of data. |
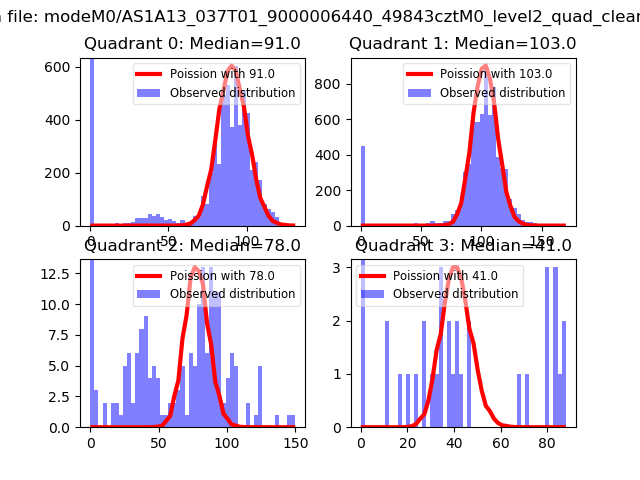 |
 |
| Quadrant-wise count rates Data is divided into 100 sec bins |
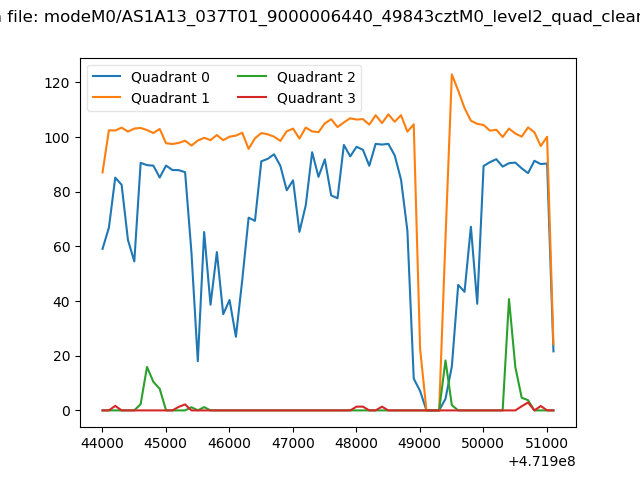 |
|
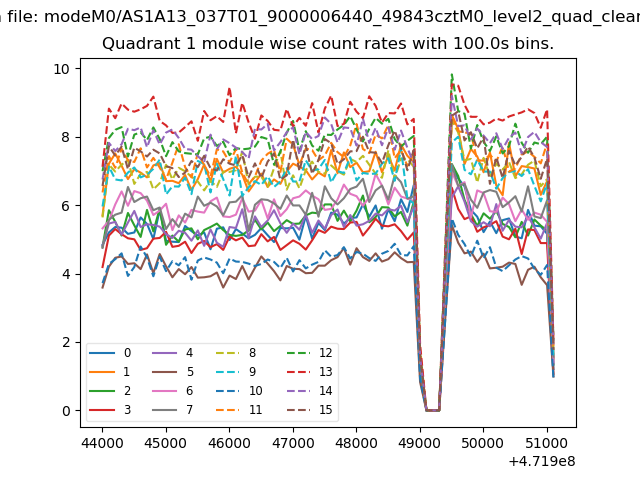
| Module-wise count rates for Quadrant A Data is divided into 100 sec bins |
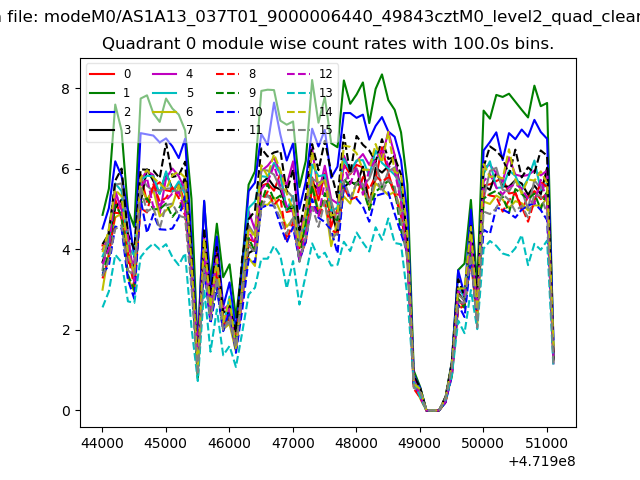 |
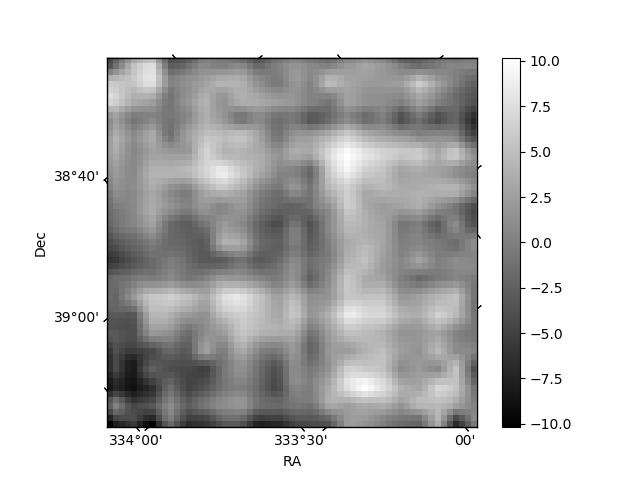 |
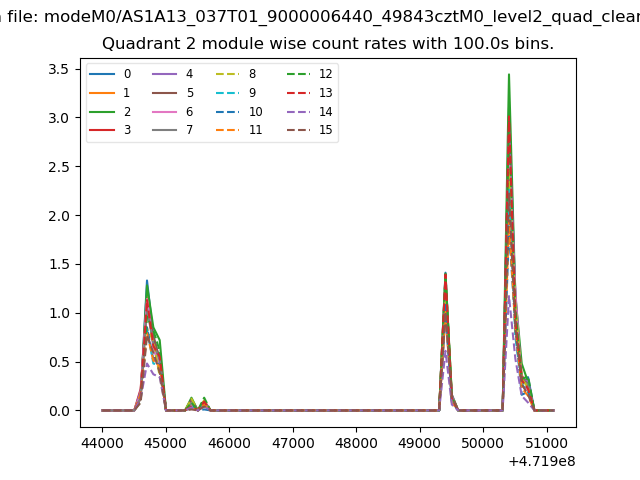
| Module-wise count rates for Quadrant B Data is divided into 100 sec bins |
 |
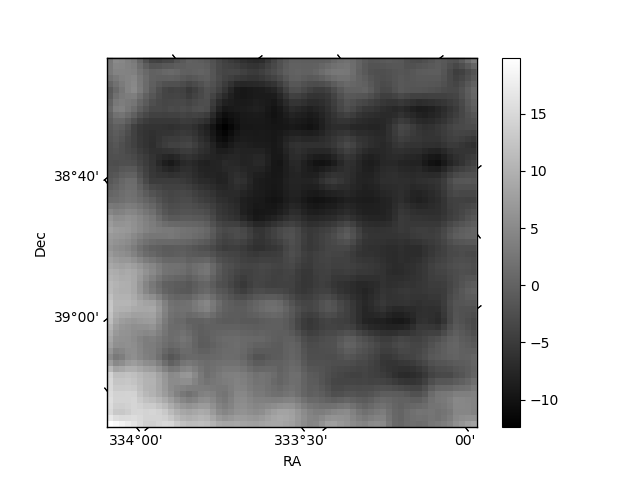 |
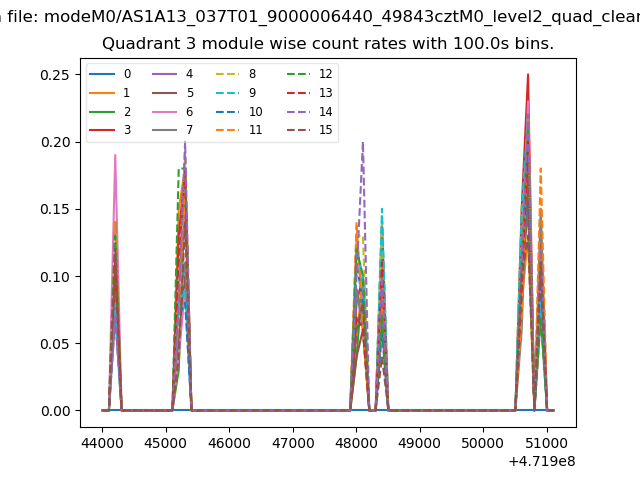
| Module-wise count rates for Quadrant C Data is divided into 100 sec bins |
 |
 |
| Module-wise count rates for Quadrant D Data is divided into 100 sec bins |
 |
 |
| Parameter | Plot |
|---|---|
| CZT HV Monitor | 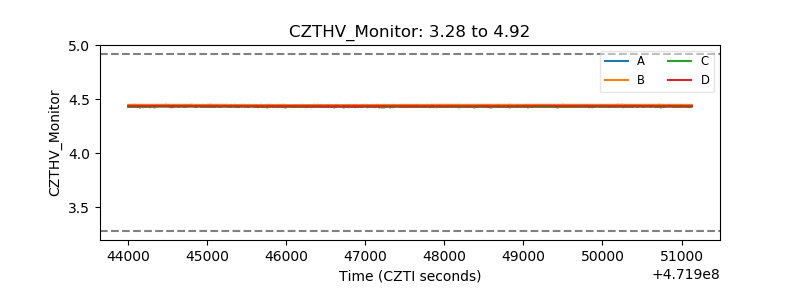 |
| D_VDD | 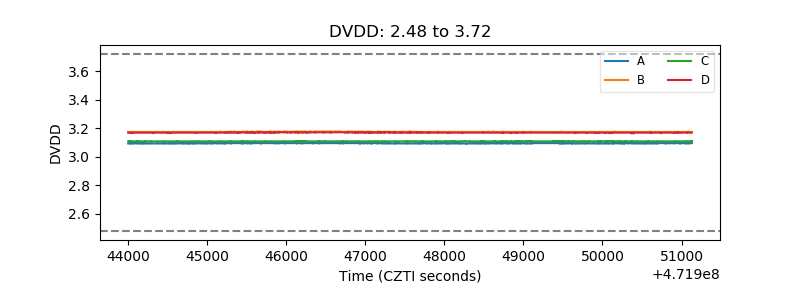 |
| Temperature 1 | 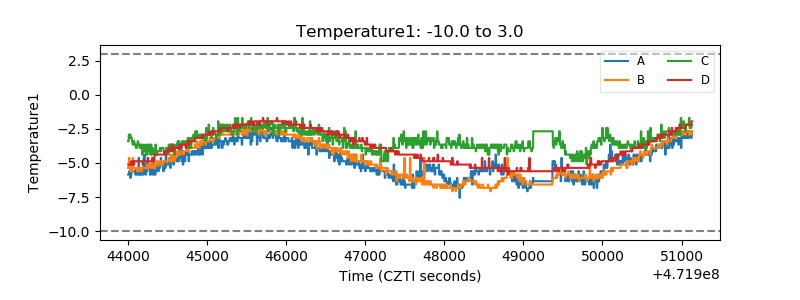 |
| Veto HV Monitor |  |
| Veto LLD | 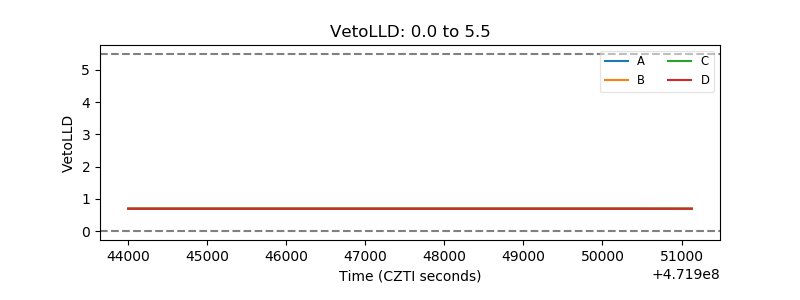 |
| Alpha Counter | 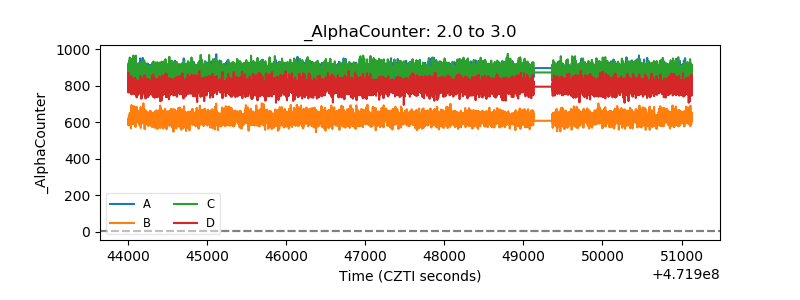 |
| _CPM_Rate | 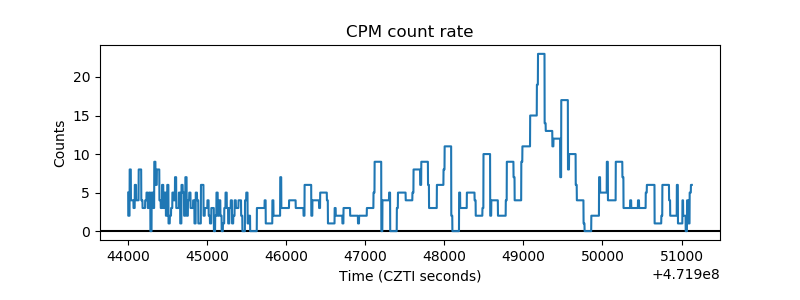 |
| CZT Counter | 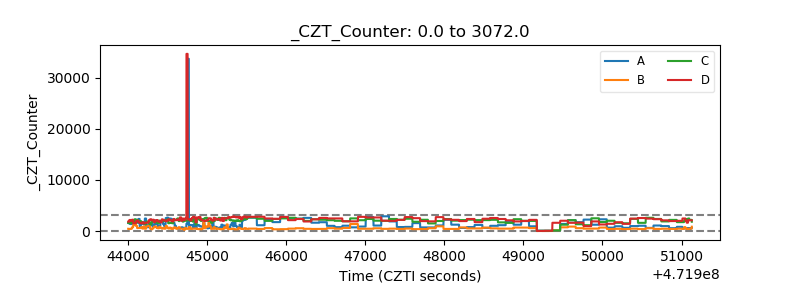 |
| +2.5 Volts monitor | 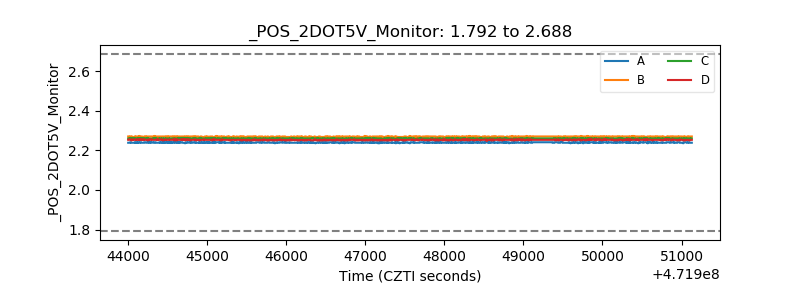 |
| +5 Volts monitor | 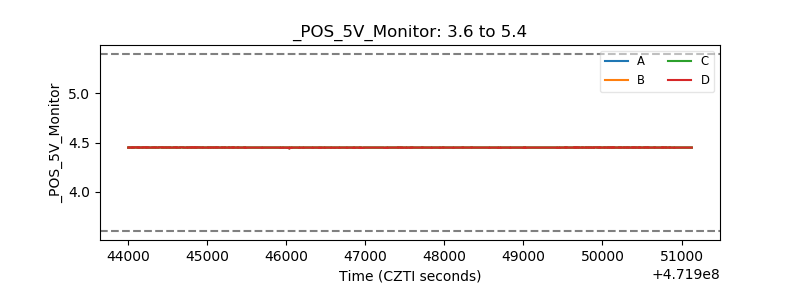 |
| _ROLL_ROT | 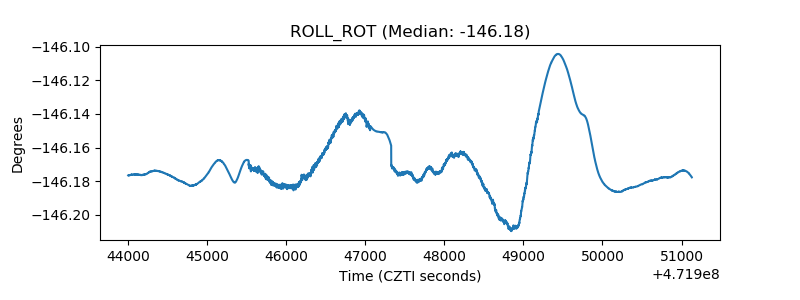 |
| _Roll_DEC | 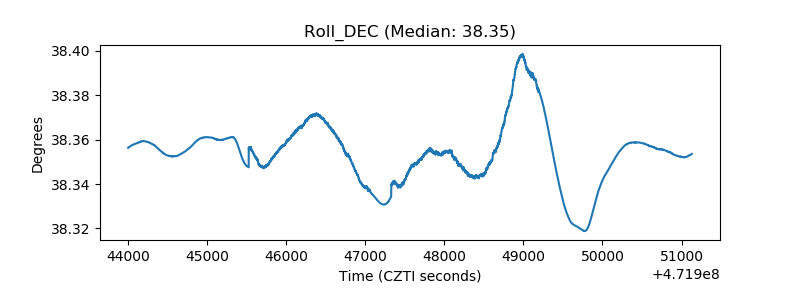 |
| _Roll_RA | 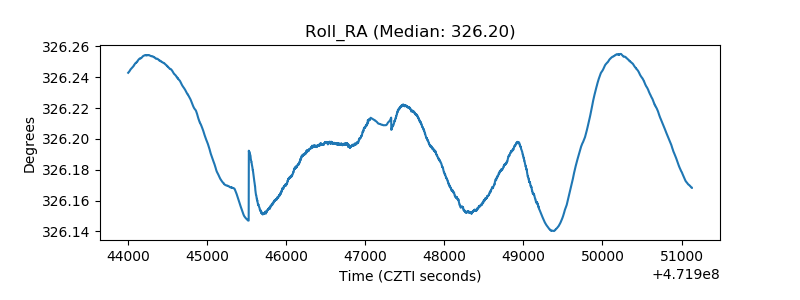 |
| Veto Counter | 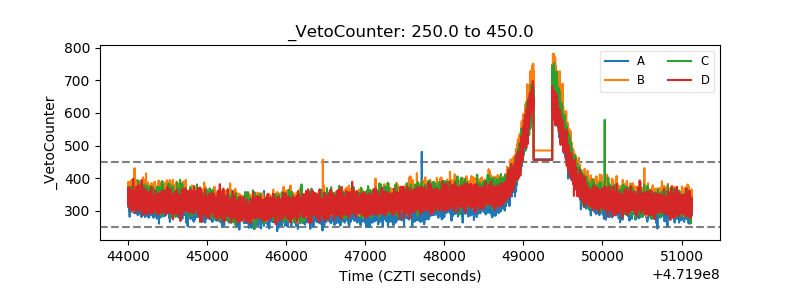 |