| Param | Original file | Final file |
|---|---|---|
| Filename | modeM0/AS1A13_037T01_9000006440_49844cztM0_level2.fits | modeM0/AS1A13_037T01_9000006440_49844cztM0_level2_quad_clean.evt |
| Size (bytes) | 1,232,660,160 | 51,295,680 |
| Size | 1.1 GB | 48.9 MB |
| Events in quadrant A | 12,173,281 | 348,136 |
| Events in quadrant B | 4,078,442 | 710,510 |
| Events in quadrant C | 13,379,156 | 6,813 |
| Events in quadrant D | 15,457,380 | 600 |
| Mode SS | |||
|---|---|---|---|
| Quadrant | BADHDUFLAG | Total packets | Discarded packets |
| A | 0 | 140 | 0 |
| B | 0 | 140 | 0 |
| C | 0 | 140 | 0 |
| D | 0 | 140 | 0 |
| Mode M0 | |||
|---|---|---|---|
| Quadrant | BADHDUFLAG | Total packets | Discarded packets |
| A | 0 | 41009 | 0 |
| B | 0 | 17030 | 0 |
| C | 0 | 44545 | 0 |
| D | 0 | 50723 | 0 |
| Quadrant | Total seconds | Saturated seconds | Saturation percentage |
|---|---|---|---|
| A | 6986 | 3443 | 49.284283% |
| B | 6987 | 131 | 1.874911% |
| C | 6987 | 6922 | 99.069701% |
| D | 6987 | 6983 | 99.942751% |
Noise dominated data is calculated using 1-second bins in cleaned event files. If a bin has >2000 counts, and if more than 50% of those come from <1% of pixels, then it is considered to be noise-dominated and hence unusable.
| Quadrant | # 1 sec bins | Bins with >0 counts | Bins with >2000 counts | High rate bins dominated by noise | Noise dominated (total time) | Noise dominated (detector-on time) | Marked lightcurve |
|---|---|---|---|---|---|---|---|
| A | 6985 | 6985 | 3073 | 3073 | 43.99% | 43.99% | 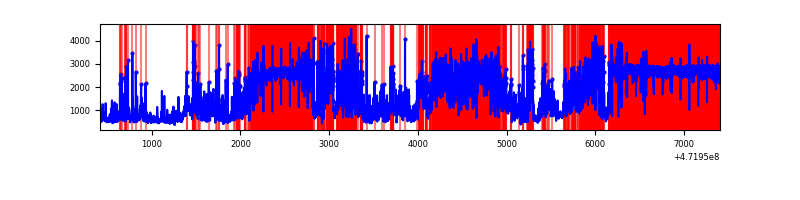 |
| B | 6987 | 6987 | 71 | 71 | 1.02% | 1.02% | 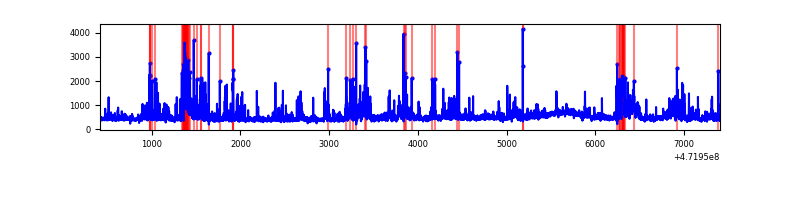 |
| C | 6986 | 6986 | 2954 | 2954 | 42.28% | 42.28% | 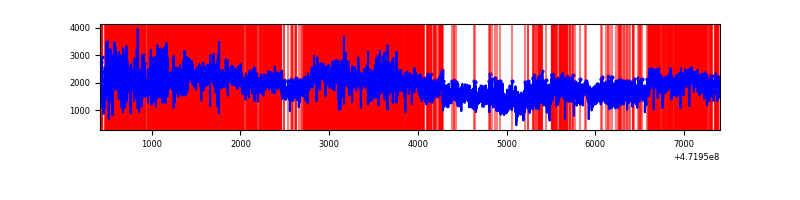 |
| D | 6986 | 6986 | 5439 | 5439 | 77.86% | 77.86% | 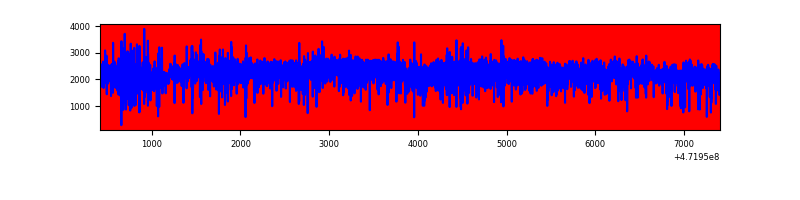 |
Top three noisy pixels from each quadrant. If the there are fewer than three noisy pixels in the level2.evt file, extra rows are filled as -1
| Pixel properties | Quadrant properties | ||||||
|---|---|---|---|---|---|---|---|
| Quadrant | DetID | PixID | Counts | Sigma | Mean | Median | Sigma |
| A | 0 | 98 | 3707732 | 26241.17 | 558 | 544 | 141.3 |
| A | 3 | 84 | 2952248 | 20893.51 | 558 | 544 | 141.3 |
| A | 3 | 99 | 1182005 | 8362.92 | 558 | 544 | 141.3 |
| B | 0 | 229 | 375578 | 2374.49 | 749 | 725 | 157.9 |
| B | 4 | 206 | 226646 | 1431.08 | 749 | 725 | 157.9 |
| B | 10 | 44 | 145642 | 917.97 | 749 | 725 | 157.9 |
| C | 15 | 230 | 2452252 | 60877.72 | 126 | 124 | 40.3 |
| C | 15 | 197 | 1781715 | 44230.64 | 126 | 124 | 40.3 |
| C | 15 | 174 | 1712516 | 42512.67 | 126 | 124 | 40.3 |
| D | 8 | 129 | 4869548 | 87703.62 | 164 | 156 | 55.5 |
| D | 7 | 126 | 2128361 | 38331.54 | 164 | 156 | 55.5 |
| D | 7 | 61 | 2100845 | 37835.94 | 164 | 156 | 55.5 |
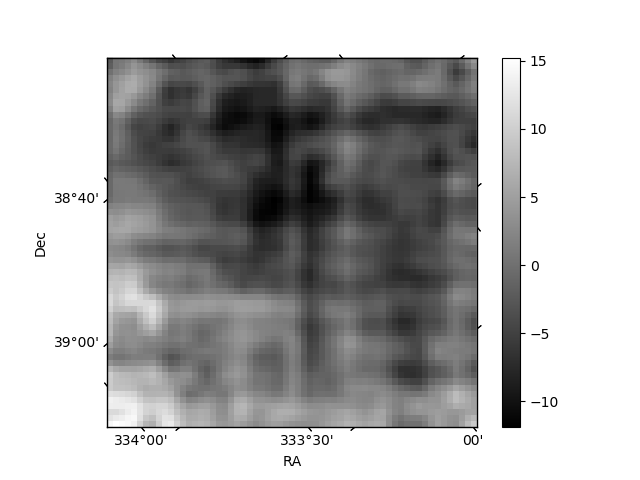
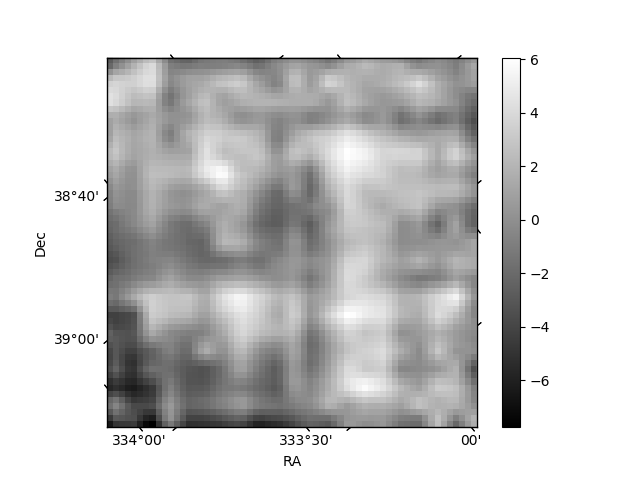
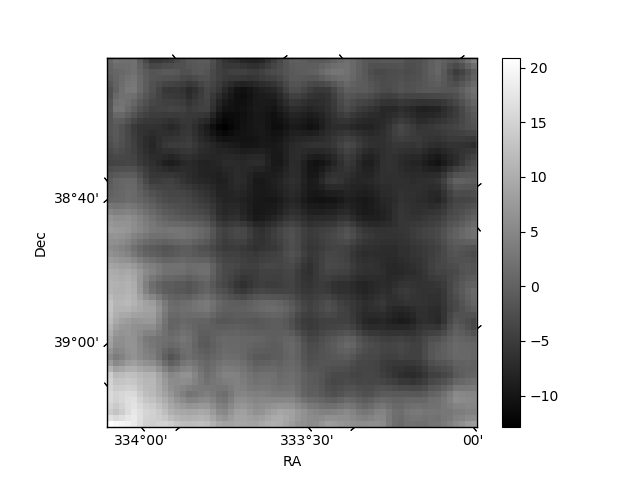
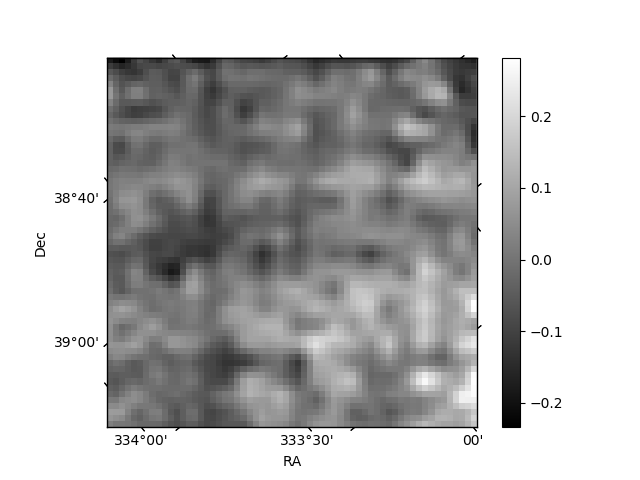
Histogram calculated using DETX and DETY for each event in the final _common_clean file
| Quadrant A | 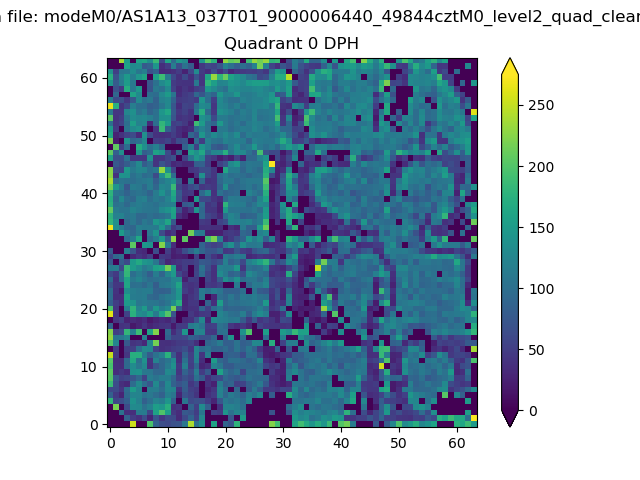 |
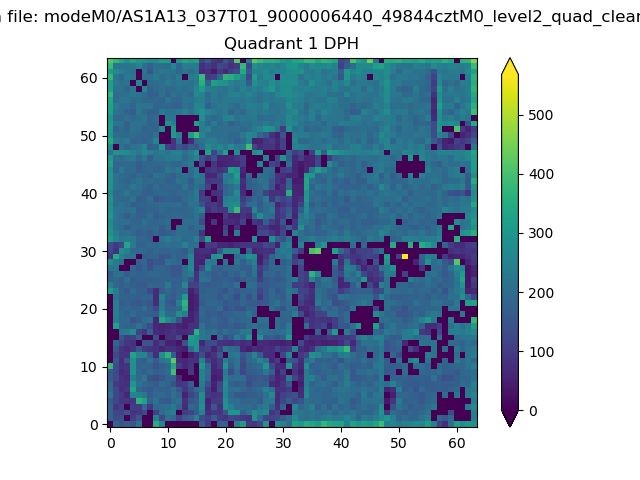 |
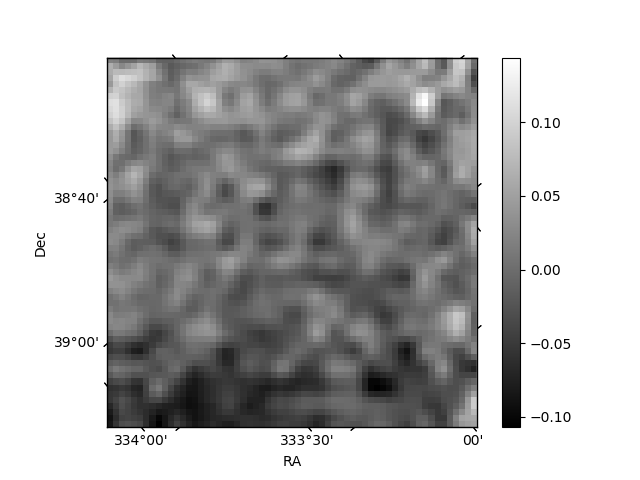
Quadrant B |
|---|---|---|---|
| Quadrant D | 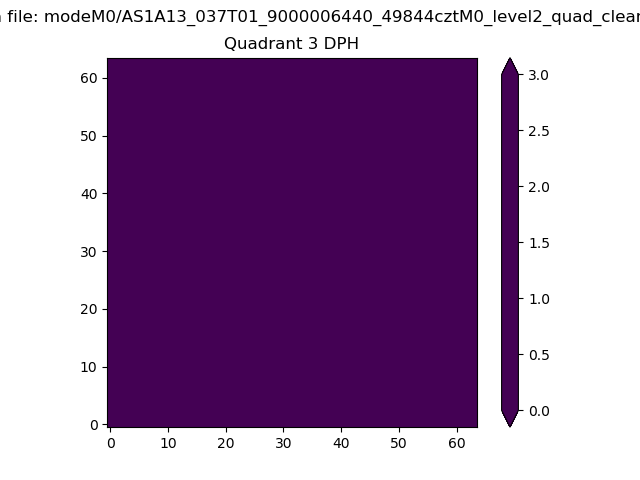 |
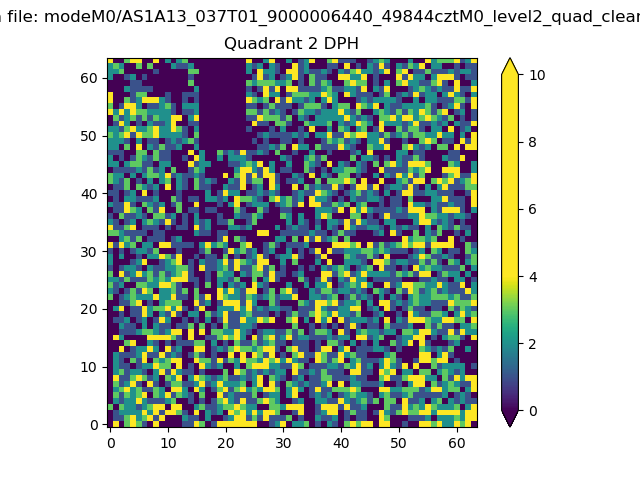 |
Quadrant C |
| Plot type | Count rate plots | Images |
|---|---|---|
| Comparison with Poisson distribution Blue bars denote a histogram of data divided into 1 sec bins. Red curve is a Poisson curve with rate = median count rate of data. |
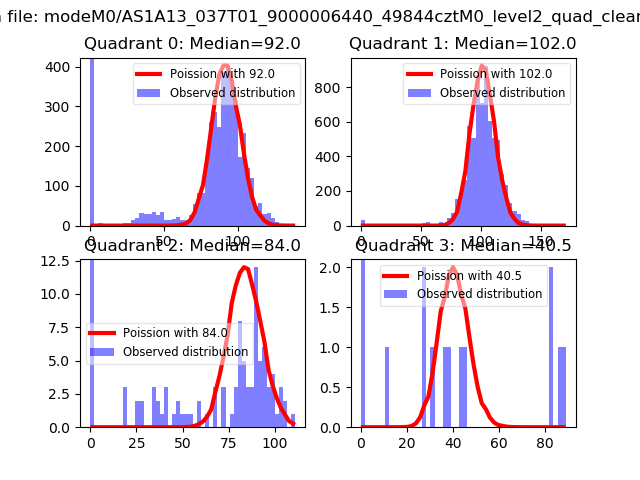 |
 |
| Quadrant-wise count rates Data is divided into 100 sec bins |
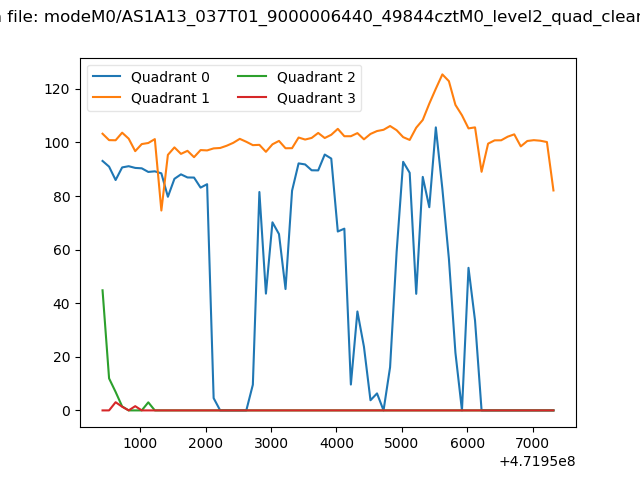 |
|
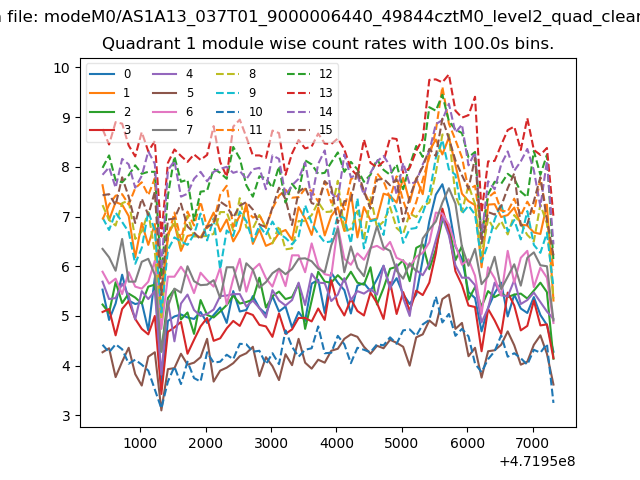
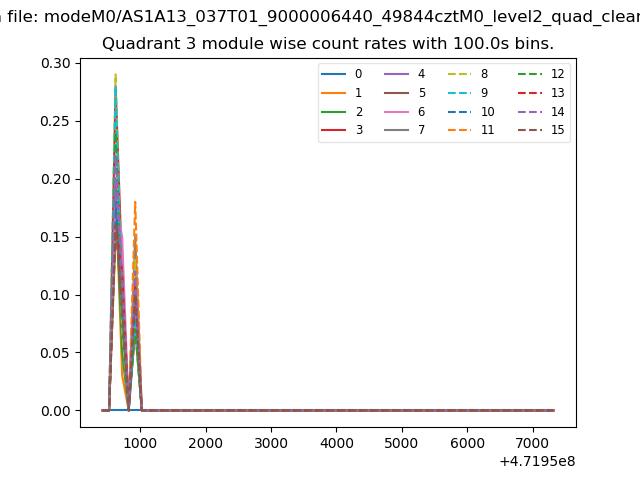
| Module-wise count rates for Quadrant A Data is divided into 100 sec bins |
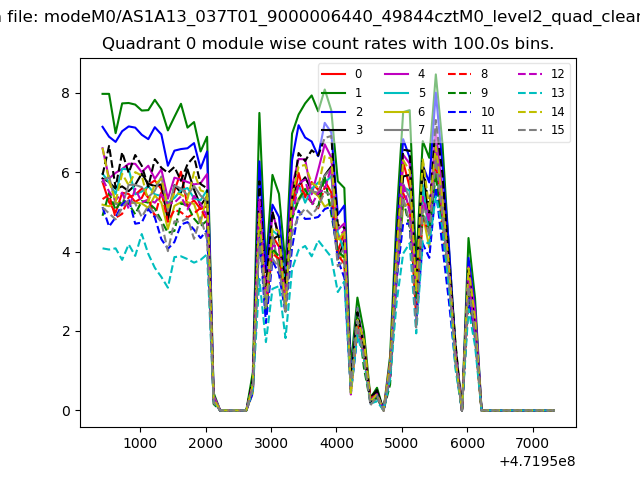 |
 |
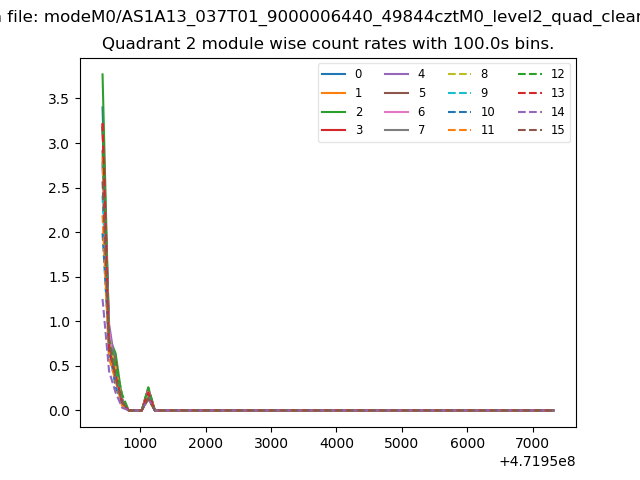
| Module-wise count rates for Quadrant B Data is divided into 100 sec bins |
 |
 |
| Module-wise count rates for Quadrant C Data is divided into 100 sec bins |
 |
 |
| Module-wise count rates for Quadrant D Data is divided into 100 sec bins |
 |
 |
| Parameter | Plot |
|---|---|
| CZT HV Monitor | 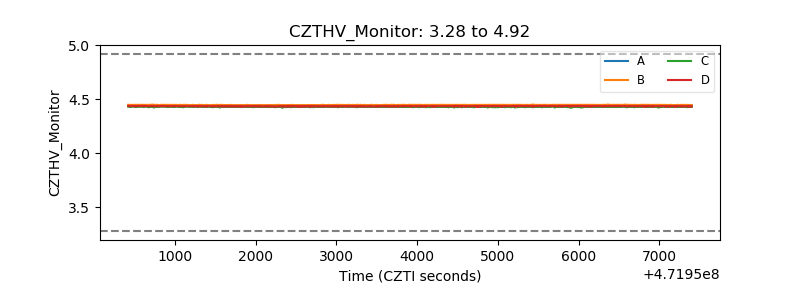 |
| D_VDD | 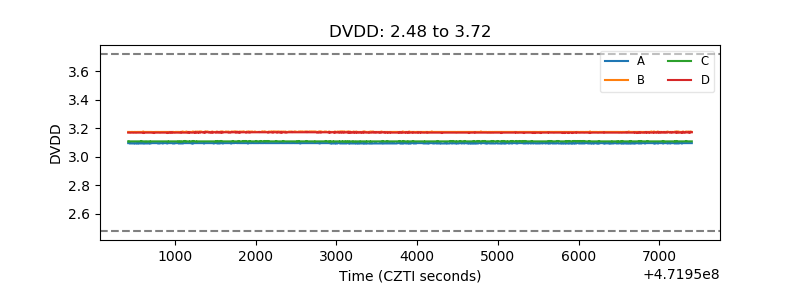 |
| Temperature 1 | 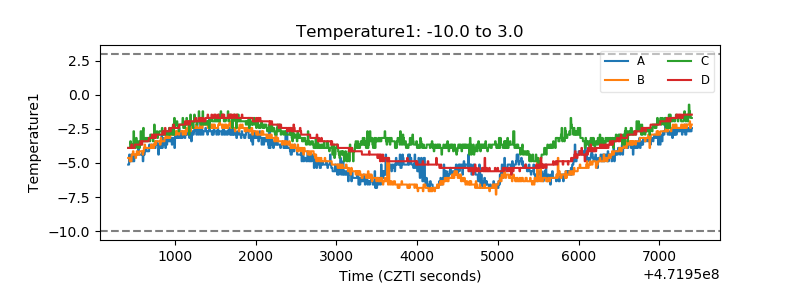 |
| Veto HV Monitor |  |
| Veto LLD | 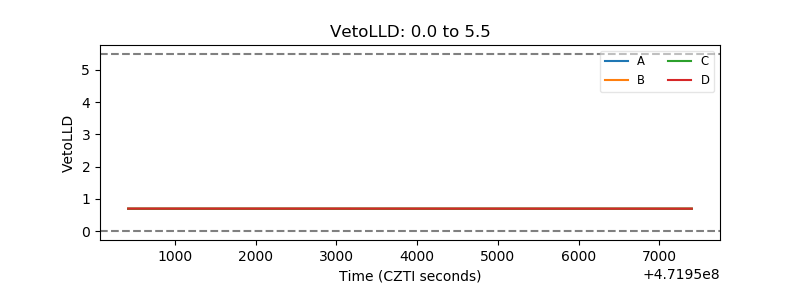 |
| Alpha Counter | 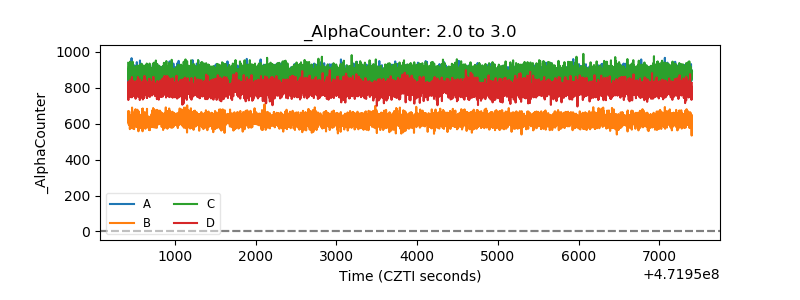 |
| _CPM_Rate | 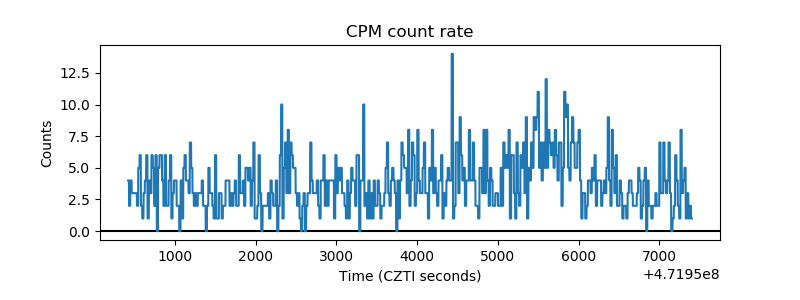 |
| CZT Counter | 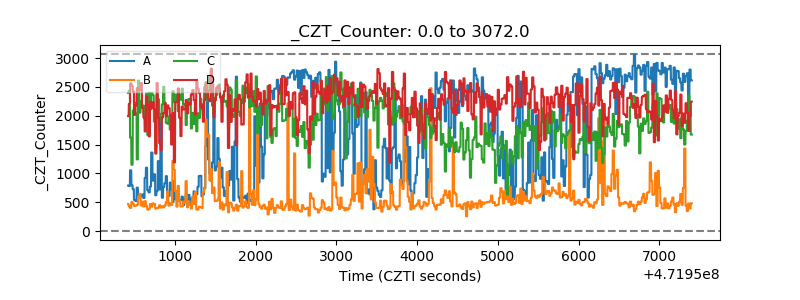 |
| +2.5 Volts monitor | 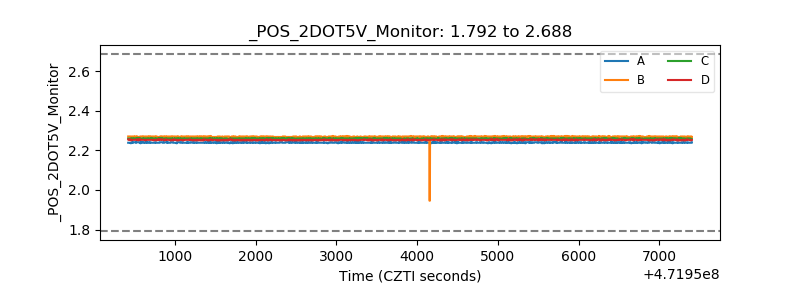 |
| +5 Volts monitor | 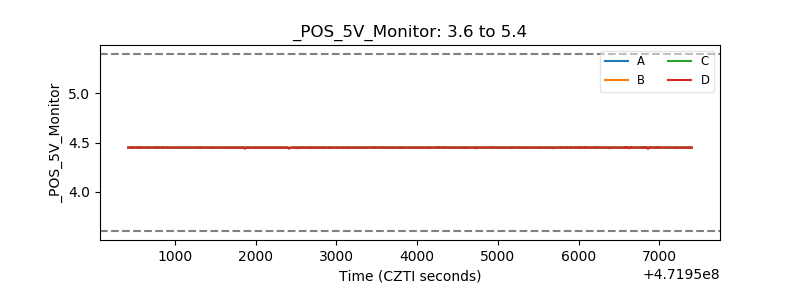 |
| _ROLL_ROT | 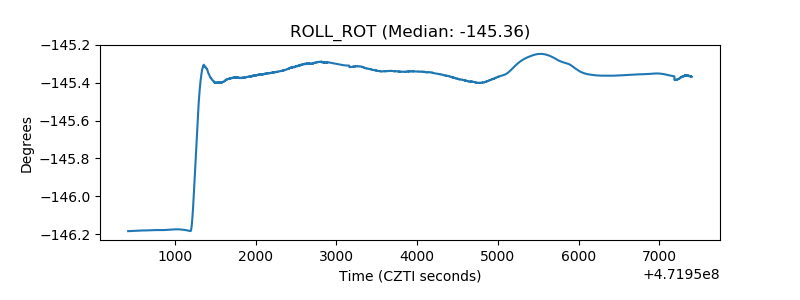 |
| _Roll_DEC | 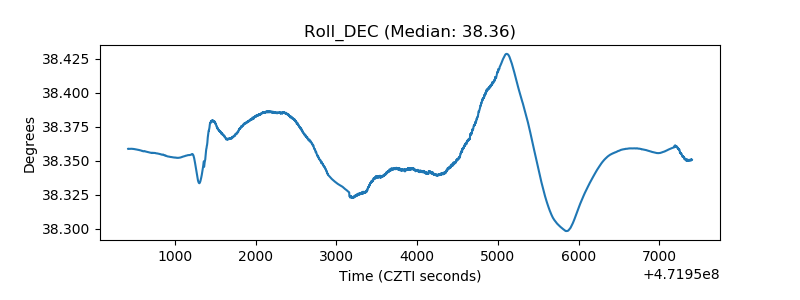 |
| _Roll_RA | 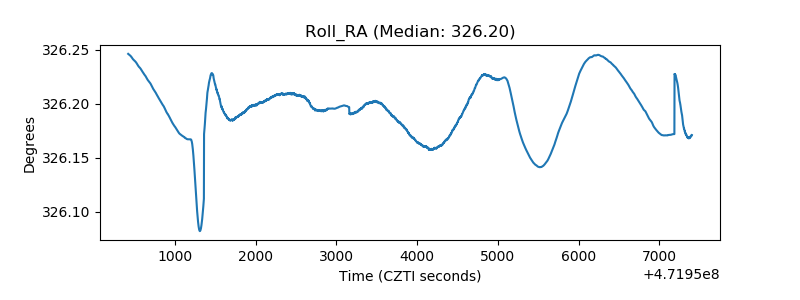 |
| Veto Counter | 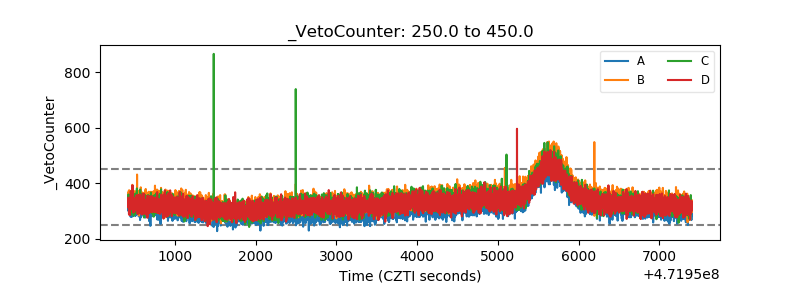 |