| Param | Original file | Final file |
|---|---|---|
| Filename | modeM0/AS1A13_037T01_9000006440_49845cztM0_level2.fits | modeM0/AS1A13_037T01_9000006440_49845cztM0_level2_quad_clean.evt |
| Size (bytes) | 1,289,560,320 | 55,186,560 |
| Size | 1.2 GB | 52.6 MB |
| Events in quadrant A | 15,932,533 | 320,331 |
| Events in quadrant B | 3,944,114 | 713,010 |
| Events in quadrant C | 12,617,479 | 40,420 |
| Events in quadrant D | 14,696,073 | 97,419 |
| Mode SS | |||
|---|---|---|---|
| Quadrant | BADHDUFLAG | Total packets | Discarded packets |
| A | 0 | 140 | 0 |
| B | 0 | 140 | 0 |
| C | 0 | 140 | 0 |
| D | 0 | 140 | 0 |
| Mode M0 | |||
|---|---|---|---|
| Quadrant | BADHDUFLAG | Total packets | Discarded packets |
| A | 0 | 52112 | 0 |
| B | 0 | 16590 | 0 |
| C | 0 | 42383 | 0 |
| D | 0 | 48450 | 0 |
| Quadrant | Total seconds | Saturated seconds | Saturation percentage |
|---|---|---|---|
| A | 7042 | 5423 | 77.009372% |
| B | 7043 | 108 | 1.533437% |
| C | 7043 | 7043 | 100.000000% |
| D | 7043 | 7043 | 100.000000% |
Noise dominated data is calculated using 1-second bins in cleaned event files. If a bin has >2000 counts, and if more than 50% of those come from <1% of pixels, then it is considered to be noise-dominated and hence unusable.
| Quadrant | # 1 sec bins | Bins with >0 counts | Bins with >2000 counts | High rate bins dominated by noise | Noise dominated (total time) | Noise dominated (detector-on time) | Marked lightcurve |
|---|---|---|---|---|---|---|---|
| A | 7041 | 7041 | 5110 | 5110 | 72.57% | 72.57% | 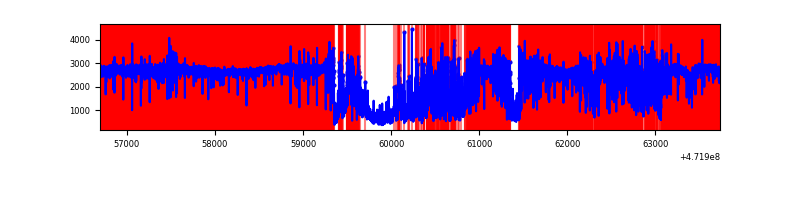 |
| B | 7043 | 7043 | 75 | 75 | 1.06% | 1.06% | 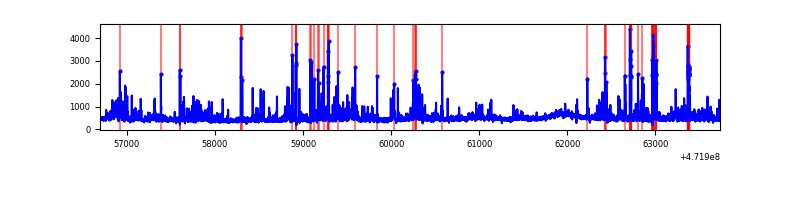 |
| C | 7042 | 7042 | 2099 | 2099 | 29.81% | 29.81% | 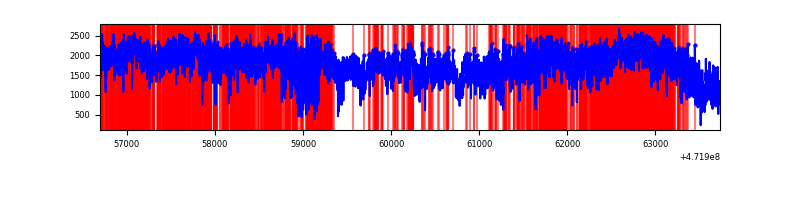 |
| D | 7042 | 7042 | 4535 | 4535 | 64.40% | 64.40% | 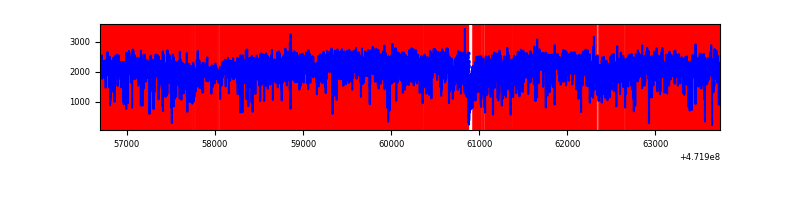 |
Top three noisy pixels from each quadrant. If the there are fewer than three noisy pixels in the level2.evt file, extra rows are filled as -1
| Pixel properties | Quadrant properties | ||||||
|---|---|---|---|---|---|---|---|
| Quadrant | DetID | PixID | Counts | Sigma | Mean | Median | Sigma |
| A | 0 | 98 | 10222373 | 96471.53 | 379 | 368 | 106.0 |
| A | 3 | 84 | 857664 | 8090.84 | 379 | 368 | 106.0 |
| A | 3 | 130 | 628545 | 5928.5 | 379 | 368 | 106.0 |
| B | 0 | 229 | 402948 | 2540.09 | 743 | 719 | 158.4 |
| B | 4 | 206 | 256065 | 1612.52 | 743 | 719 | 158.4 |
| B | 10 | 44 | 72591 | 453.87 | 743 | 719 | 158.4 |
| C | 15 | 236 | 2091730 | 59679.12 | 63 | 60 | 35.0 |
| C | 15 | 174 | 1713387 | 48884.31 | 63 | 60 | 35.0 |
| C | 15 | 197 | 1401565 | 39987.47 | 63 | 60 | 35.0 |
| D | 8 | 129 | 4522256 | 67539.2 | 139 | 130 | 67.0 |
| D | 7 | 61 | 2137571 | 31923.27 | 139 | 130 | 67.0 |
| D | 7 | 126 | 1034302 | 15445.64 | 139 | 130 | 67.0 |
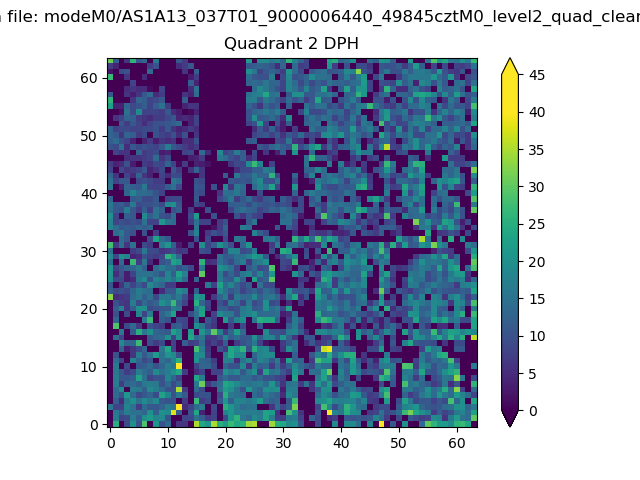
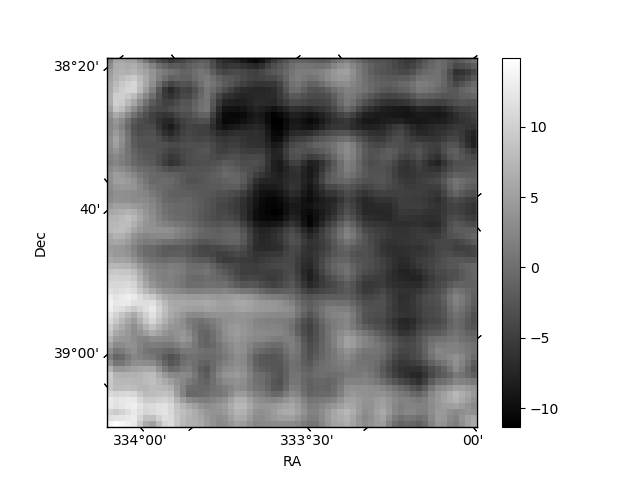
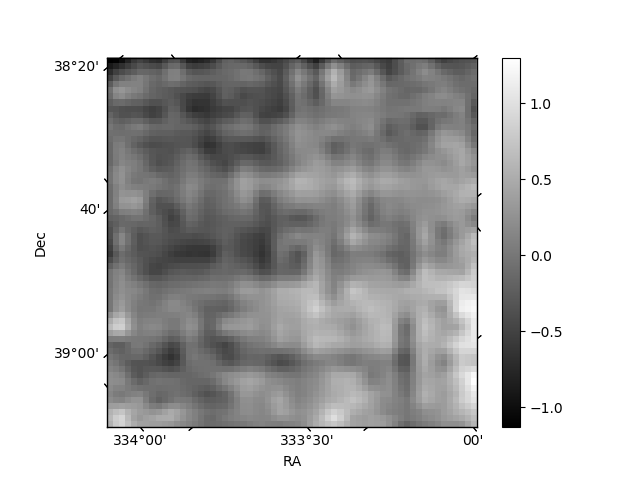
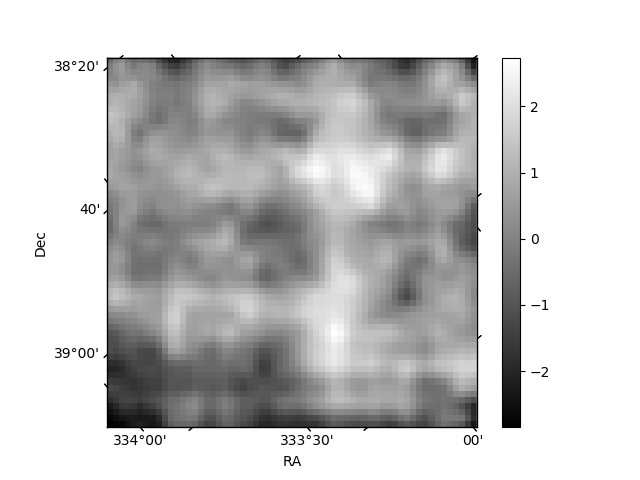
Histogram calculated using DETX and DETY for each event in the final _common_clean file
| Quadrant A | 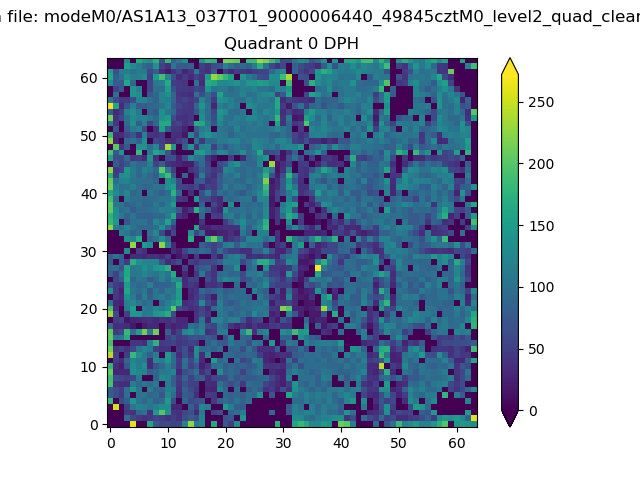 |
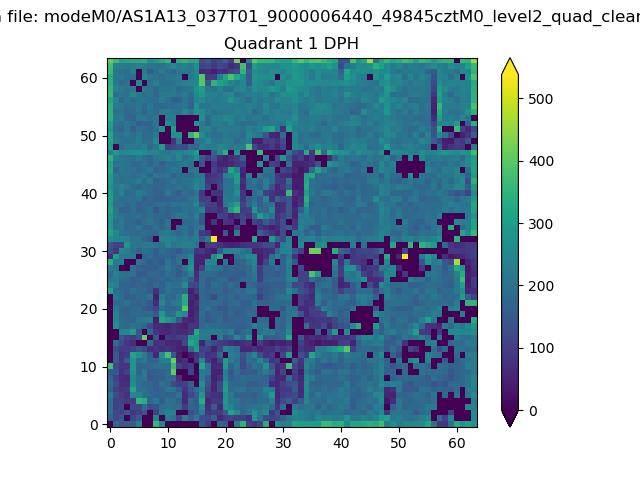 |
Quadrant B |
|---|---|---|---|
| Quadrant D | 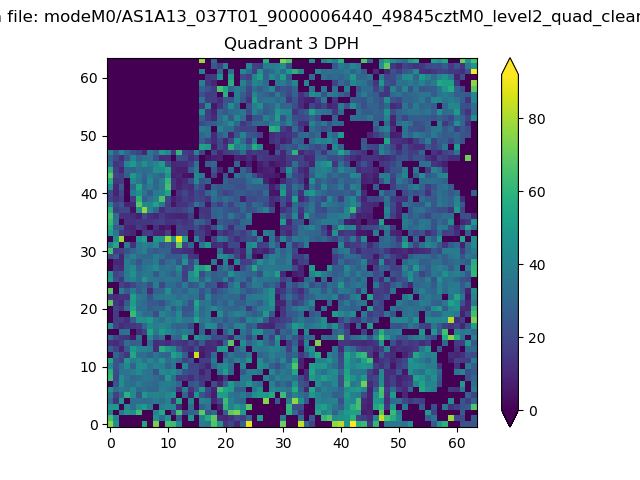 |
 |
Quadrant C |
| Plot type | Count rate plots | Images |
|---|---|---|
| Comparison with Poisson distribution Blue bars denote a histogram of data divided into 1 sec bins. Red curve is a Poisson curve with rate = median count rate of data. |
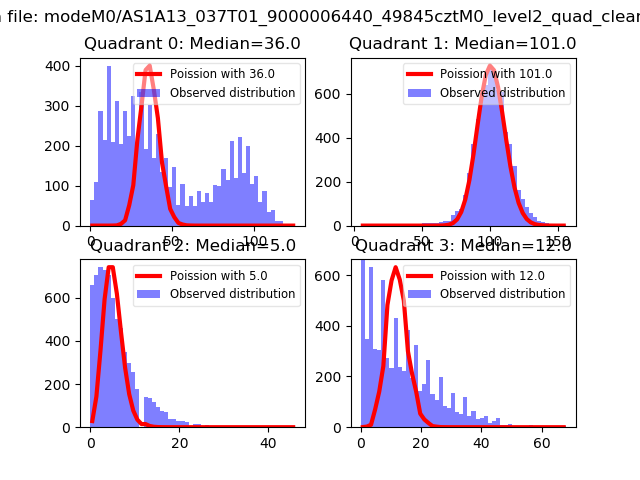 |
 |
| Quadrant-wise count rates Data is divided into 100 sec bins |
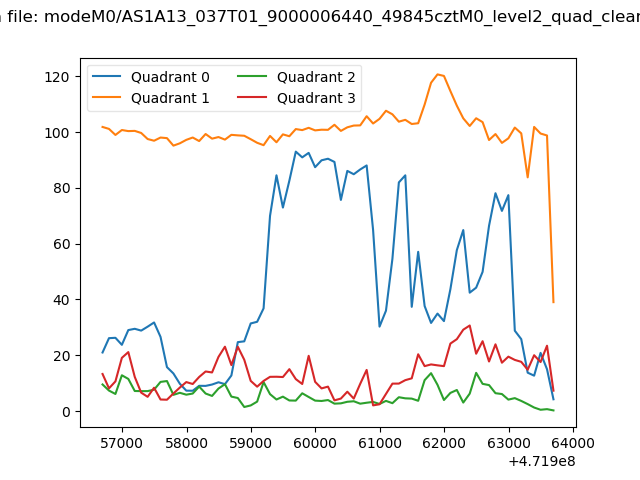 |
|
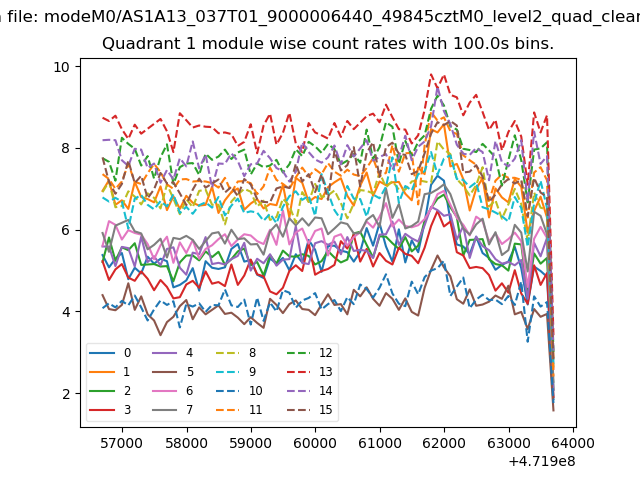
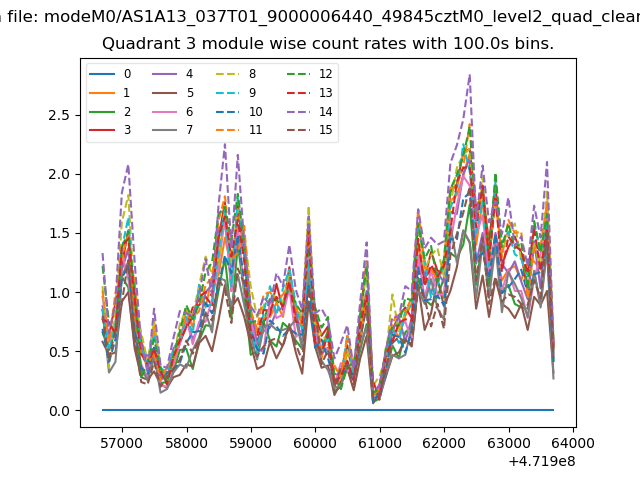
| Module-wise count rates for Quadrant A Data is divided into 100 sec bins |
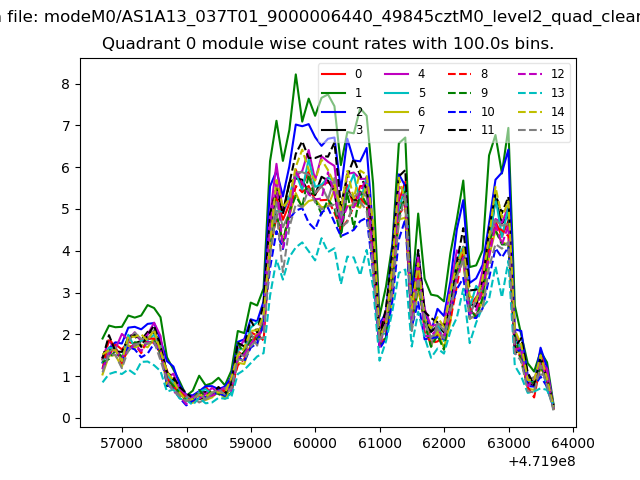 |
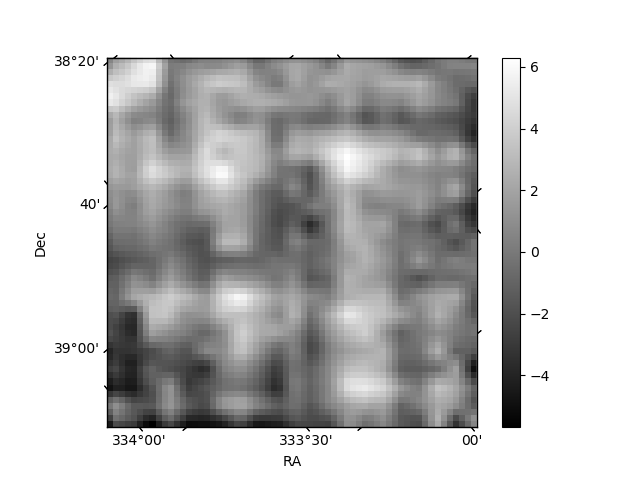 |
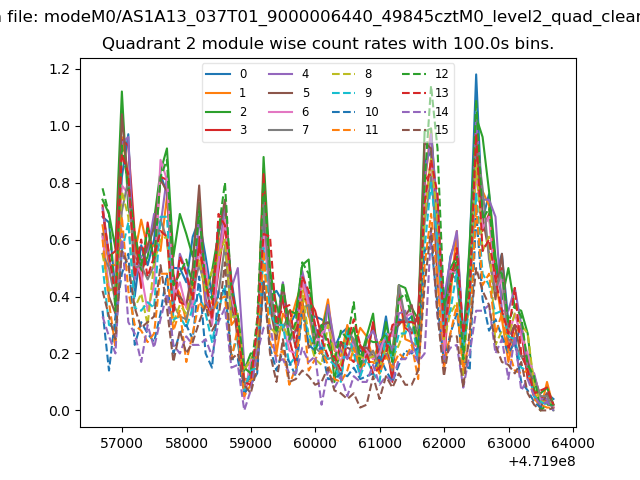
| Module-wise count rates for Quadrant B Data is divided into 100 sec bins |
 |
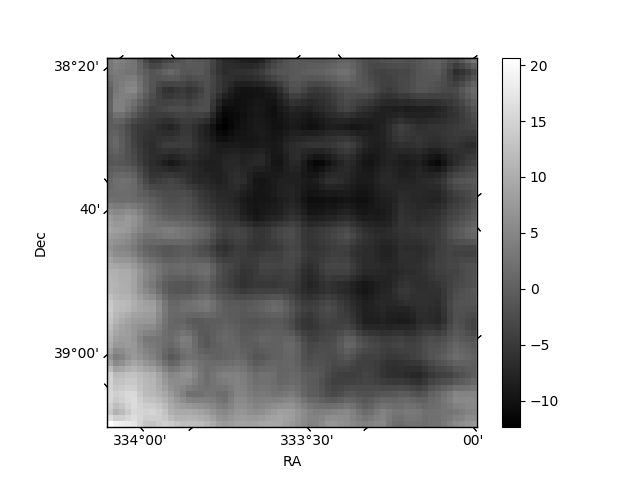 |
| Module-wise count rates for Quadrant C Data is divided into 100 sec bins |
 |
 |
| Module-wise count rates for Quadrant D Data is divided into 100 sec bins |
 |
 |
| Parameter | Plot |
|---|---|
| CZT HV Monitor | 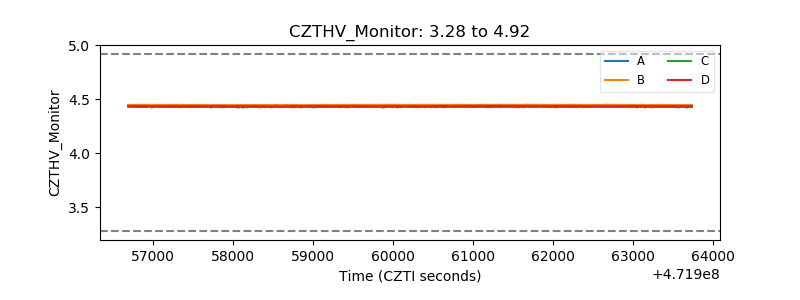 |
| D_VDD | 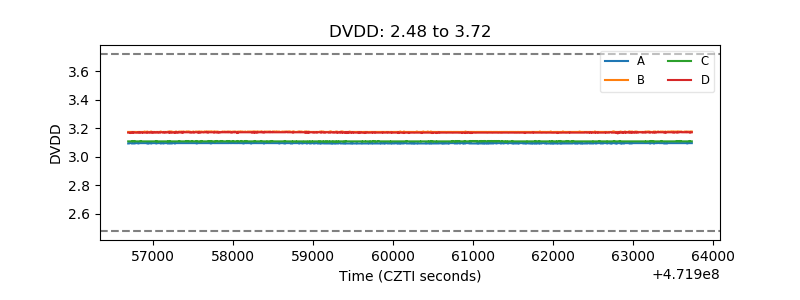 |
| Temperature 1 | 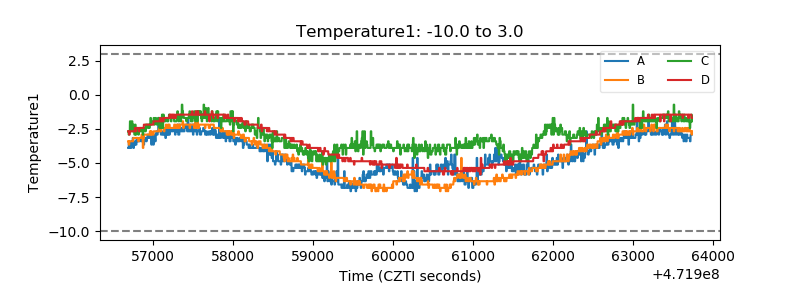 |
| Veto HV Monitor | 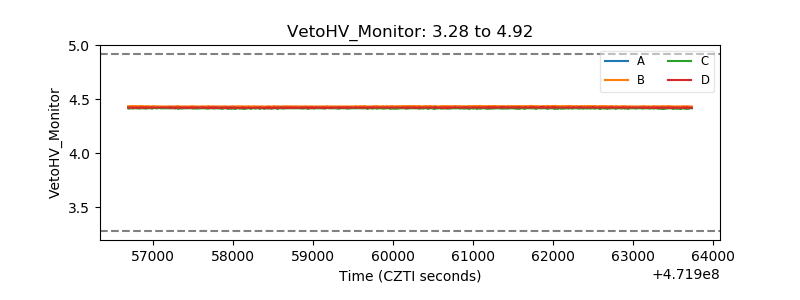 |
| Veto LLD | 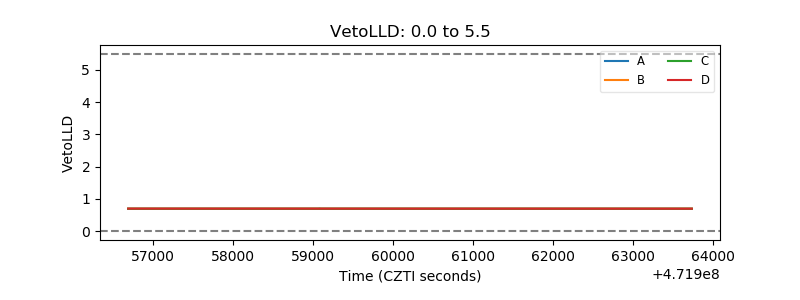 |
| Alpha Counter | 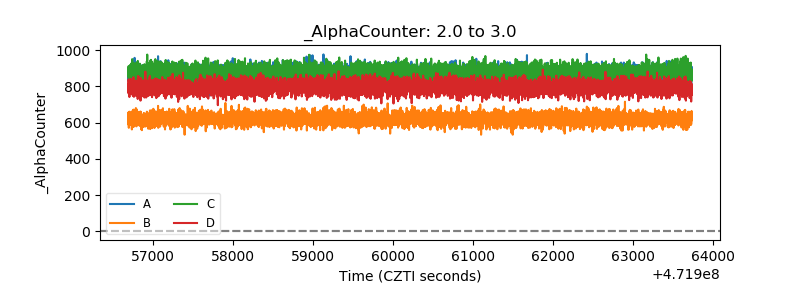 |
| _CPM_Rate | 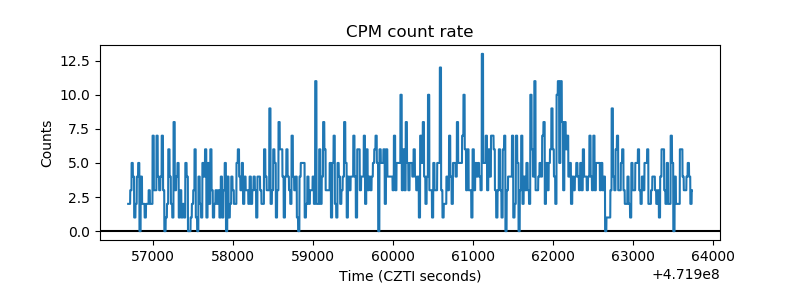 |
| CZT Counter | 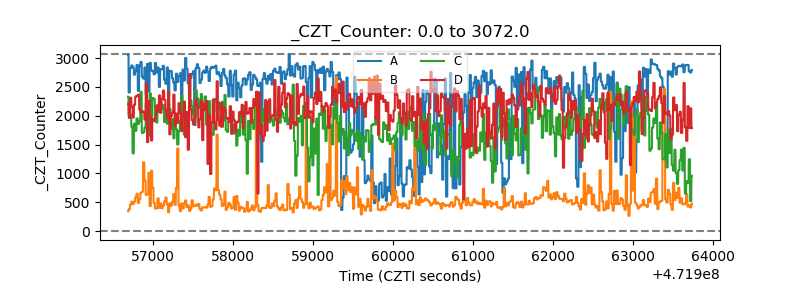 |
| +2.5 Volts monitor | 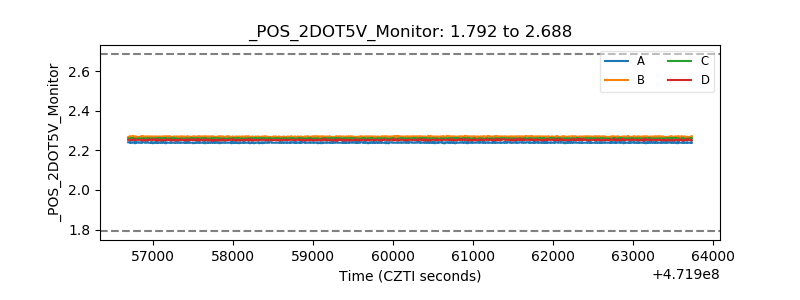 |
| +5 Volts monitor | 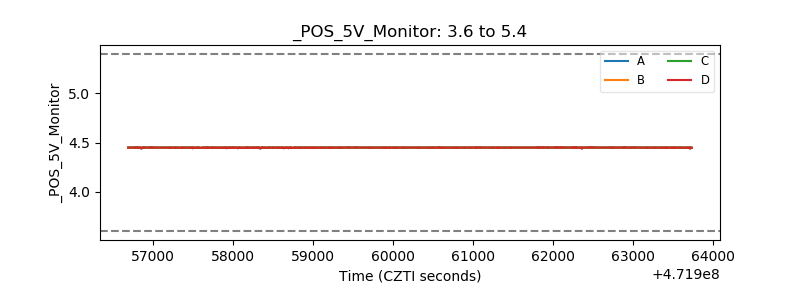 |
| _ROLL_ROT | 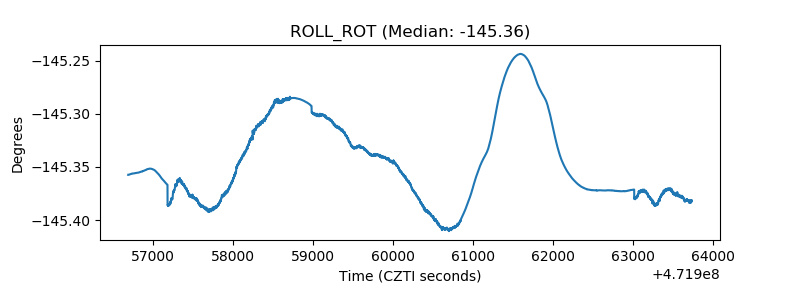 |
| _Roll_DEC | 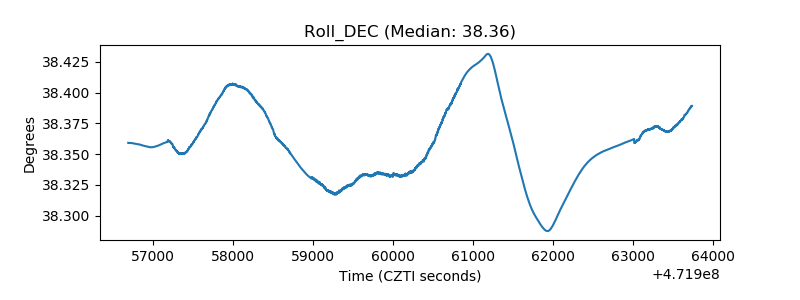 |
| _Roll_RA | 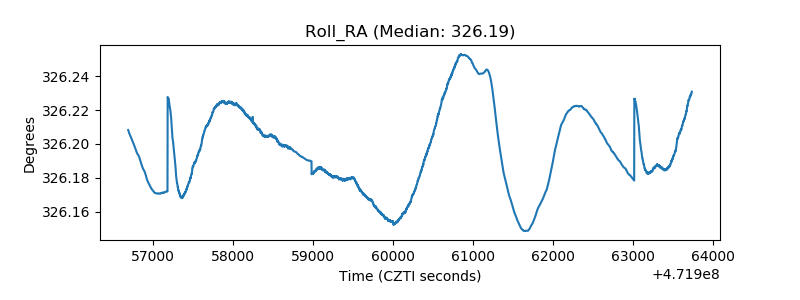 |
| Veto Counter | 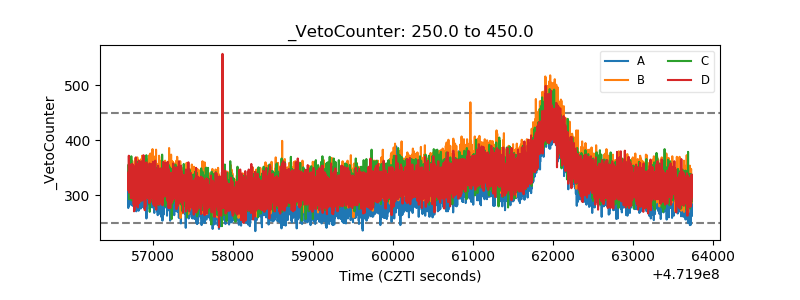 |