| Param | Original file | Final file |
|---|---|---|
| Filename | modeM0/AS1A13_037T01_9000006440_49848cztM0_level2.fits | modeM0/AS1A13_037T01_9000006440_49848cztM0_level2_quad_clean.evt |
| Size (bytes) | 2,782,759,680 | 119,946,240 |
| Size | 2.6 GB | 114.4 MB |
| Events in quadrant A | 32,842,312 | 705,927 |
| Events in quadrant B | 10,899,827 | 1,500,349 |
| Events in quadrant C | 25,548,018 | 126,038 |
| Events in quadrant D | 32,523,738 | 209,861 |
| Mode M9 | |||
|---|---|---|---|
| Quadrant | BADHDUFLAG | Total packets | Discarded packets |
| A | 0 | 2 | 0 |
| B | 0 | 2 | 0 |
| C | 0 | 2 | 0 |
| D | 0 | 2 | 0 |
| Mode SS | |||
|---|---|---|---|
| Quadrant | BADHDUFLAG | Total packets | Discarded packets |
| A | 0 | 314 | 0 |
| B | 0 | 314 | 0 |
| C | 0 | 314 | 0 |
| D | 0 | 314 | 0 |
| Mode M0 | |||
|---|---|---|---|
| Quadrant | BADHDUFLAG | Total packets | Discarded packets |
| A | 0 | 108216 | 0 |
| B | 0 | 43352 | 0 |
| C | 0 | 86673 | 0 |
| D | 0 | 107147 | 0 |
| Quadrant | Total seconds | Saturated seconds | Saturation percentage |
|---|---|---|---|
| A | 15480 | 10820 | 69.896641% |
| B | 15480 | 1116 | 7.209302% |
| C | 15480 | 15213 | 98.275194% |
| D | 15479 | 15479 | 100.000000% |
Noise dominated data is calculated using 1-second bins in cleaned event files. If a bin has >2000 counts, and if more than 50% of those come from <1% of pixels, then it is considered to be noise-dominated and hence unusable.
| Quadrant | # 1 sec bins | Bins with >0 counts | Bins with >2000 counts | High rate bins dominated by noise | Noise dominated (total time) | Noise dominated (detector-on time) | Marked lightcurve |
|---|---|---|---|---|---|---|---|
| A | 15724 | 15479 | 10112 | 10112 | 64.31% | 65.33% | 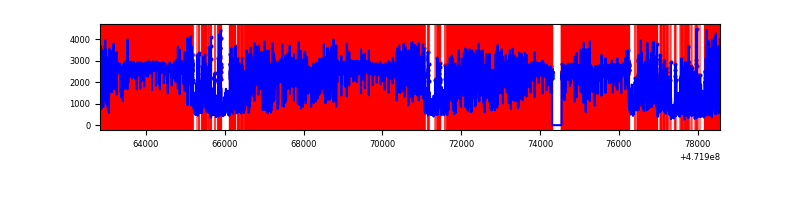 |
| B | 15725 | 15481 | 732 | 732 | 4.66% | 4.73% | 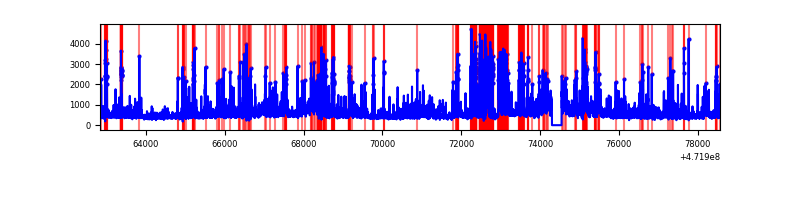 |
| C | 15724 | 15479 | 4001 | 4001 | 25.45% | 25.85% | 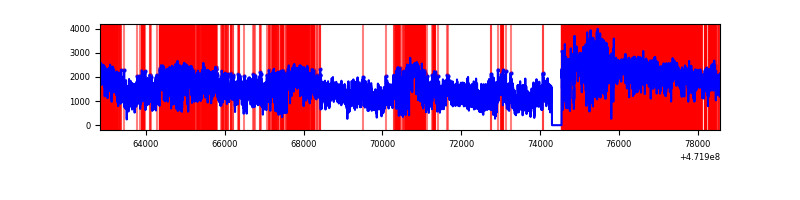 |
| D | 15724 | 15479 | 10165 | 10165 | 64.65% | 65.67% | 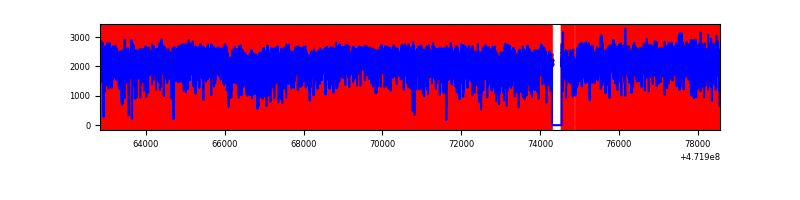 |
Top three noisy pixels from each quadrant. If the there are fewer than three noisy pixels in the level2.evt file, extra rows are filled as -1
| Pixel properties | Quadrant properties | ||||||
|---|---|---|---|---|---|---|---|
| Quadrant | DetID | PixID | Counts | Sigma | Mean | Median | Sigma |
| A | 0 | 98 | 16211918 | 68120.24 | 931 | 908 | 238.0 |
| A | 4 | 4 | 3411888 | 14333.27 | 931 | 908 | 238.0 |
| A | 3 | 84 | 2171404 | 9120.64 | 931 | 908 | 238.0 |
| B | 0 | 229 | 2414309 | 7154.02 | 1592 | 1537 | 337.3 |
| B | 4 | 206 | 528676 | 1563.0 | 1592 | 1537 | 337.3 |
| B | 4 | 190 | 311105 | 917.89 | 1592 | 1537 | 337.3 |
| C | 1 | 44 | 4653235 | 61895.48 | 179 | 173 | 75.2 |
| C | 15 | 147 | 3485001 | 46355.51 | 179 | 173 | 75.2 |
| C | 15 | 236 | 2420149 | 32190.75 | 179 | 173 | 75.2 |
| D | 8 | 129 | 10614653 | 52731.48 | 325 | 295 | 201.3 |
| D | 7 | 61 | 3428288 | 17030.06 | 325 | 295 | 201.3 |
| D | 7 | 60 | 1845218 | 9165.46 | 325 | 295 | 201.3 |
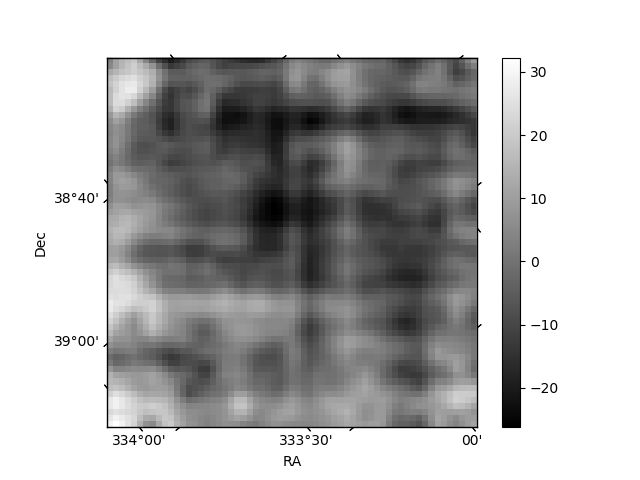
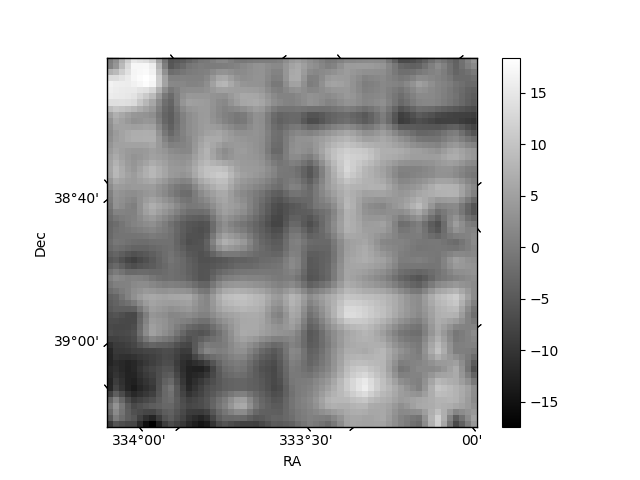
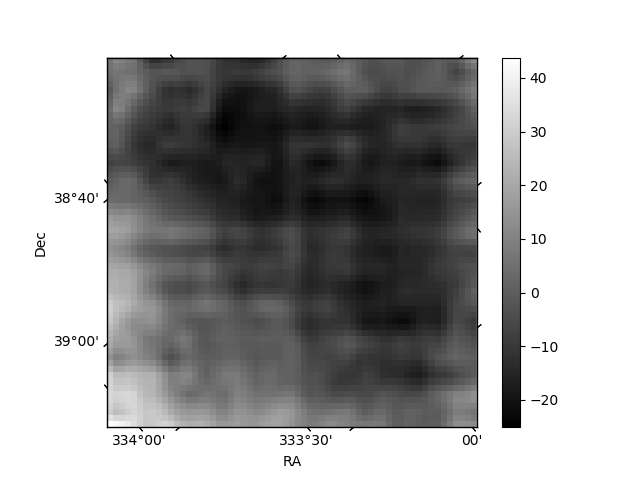
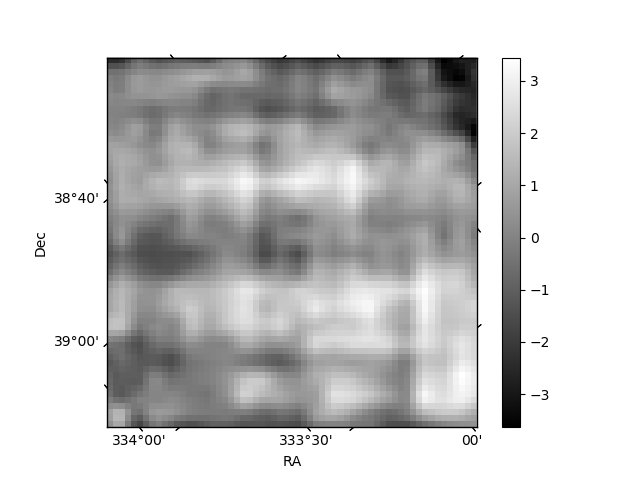
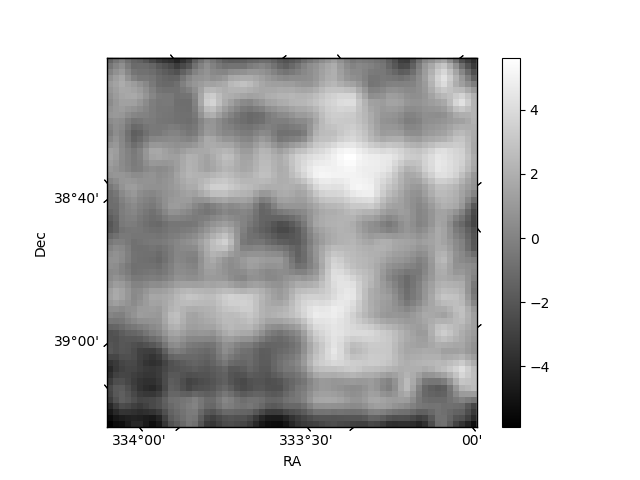
Histogram calculated using DETX and DETY for each event in the final _common_clean file
| Quadrant A | 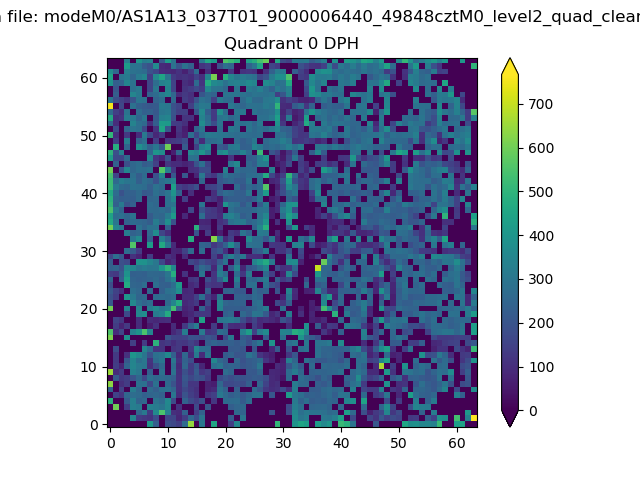 |
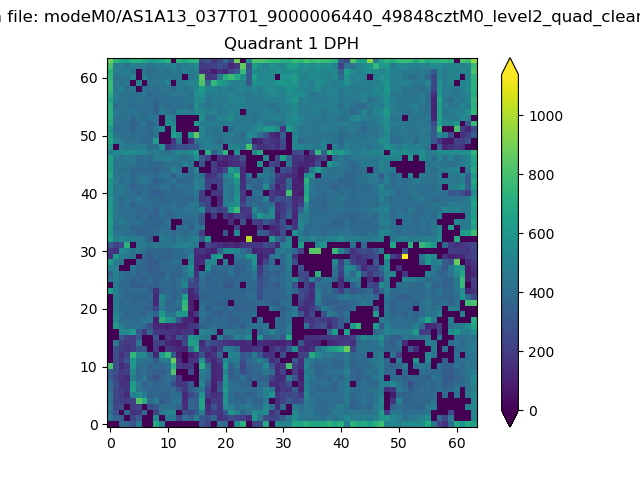 |
Quadrant B |
|---|---|---|---|
| Quadrant D | 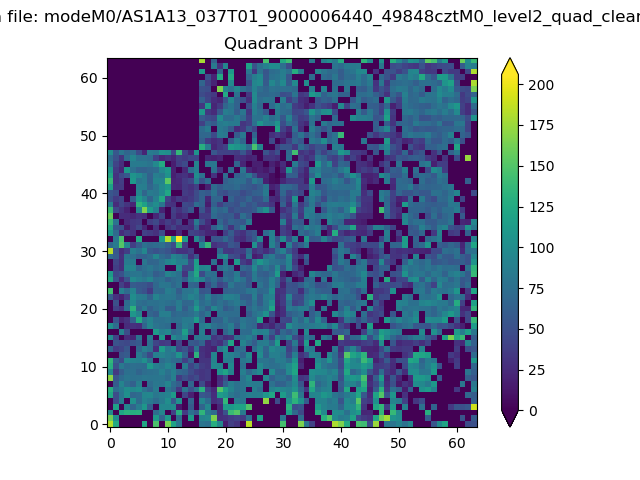 |
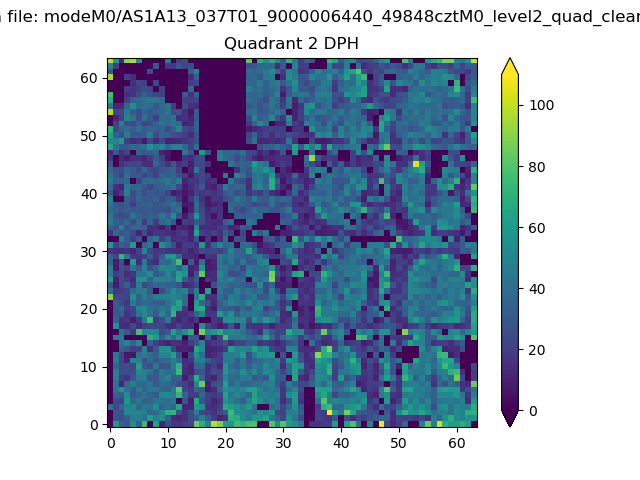 |
Quadrant C |
| Plot type | Count rate plots | Images |
|---|---|---|
| Comparison with Poisson distribution Blue bars denote a histogram of data divided into 1 sec bins. Red curve is a Poisson curve with rate = median count rate of data. |
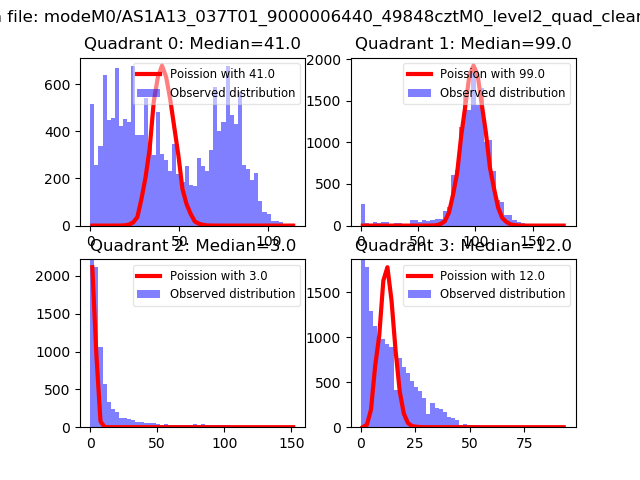 |
 |
| Quadrant-wise count rates Data is divided into 100 sec bins |
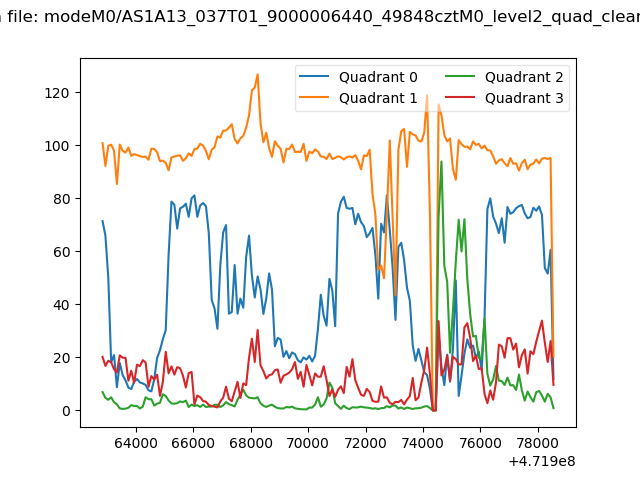 |
|
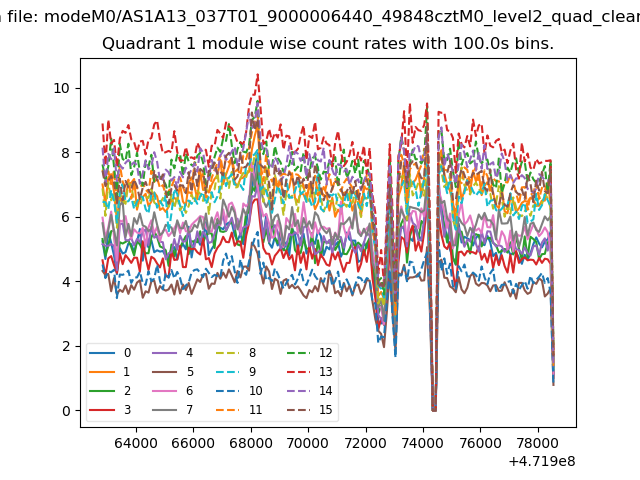
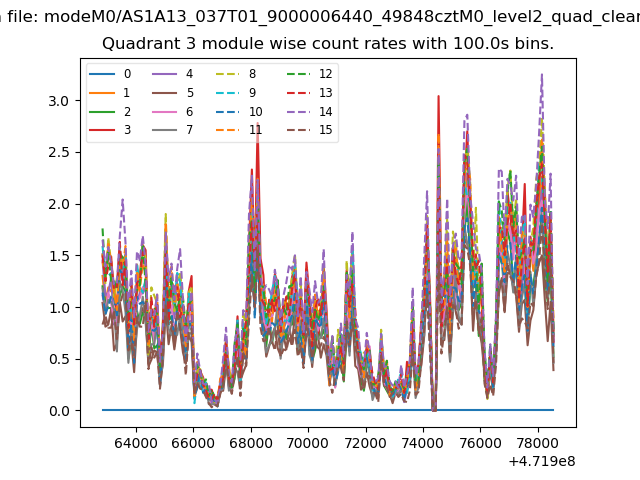
| Module-wise count rates for Quadrant A Data is divided into 100 sec bins |
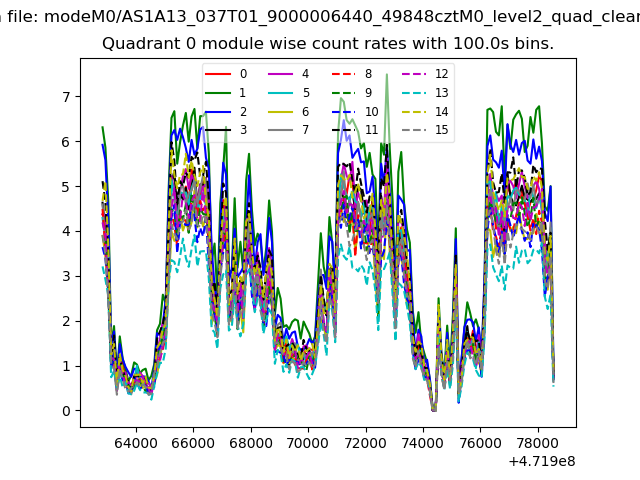 |
 |
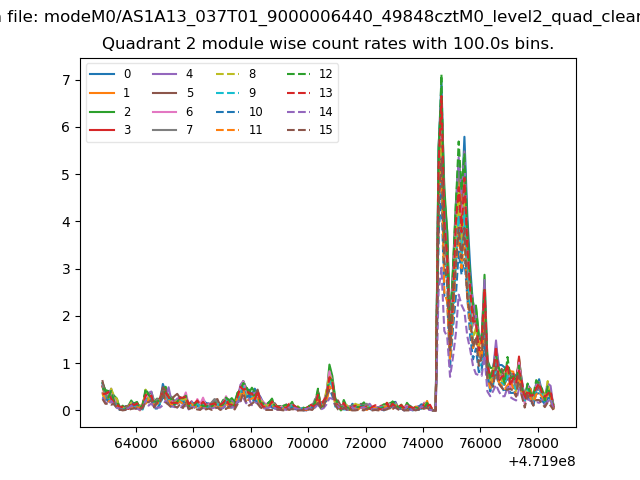
| Module-wise count rates for Quadrant B Data is divided into 100 sec bins |
 |
 |
| Module-wise count rates for Quadrant C Data is divided into 100 sec bins |
 |
 |
| Module-wise count rates for Quadrant D Data is divided into 100 sec bins |
 |
 |
| Parameter | Plot |
|---|---|
| CZT HV Monitor | 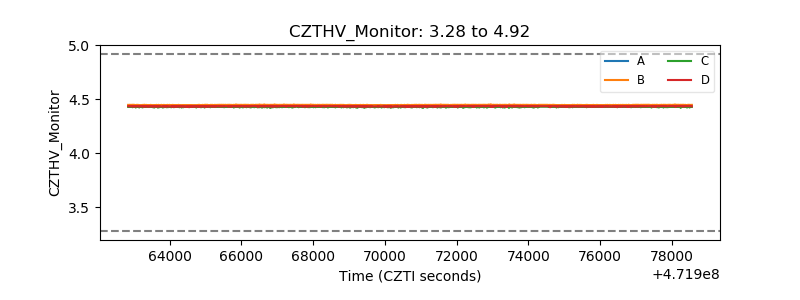 |
| D_VDD | 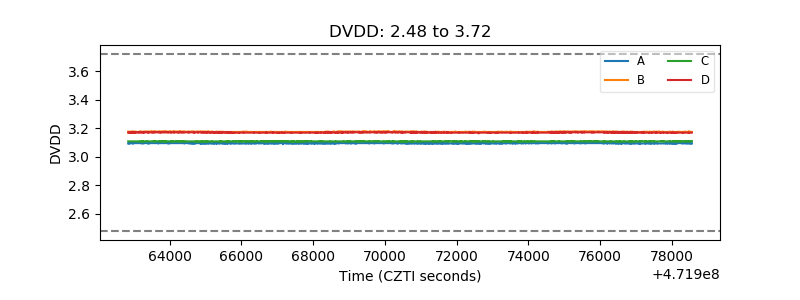 |
| Temperature 1 | 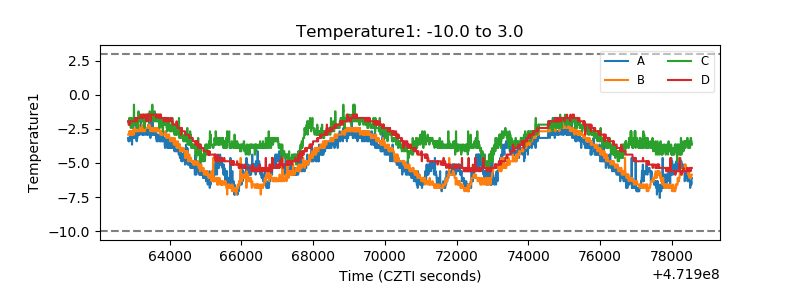 |
| Veto HV Monitor | 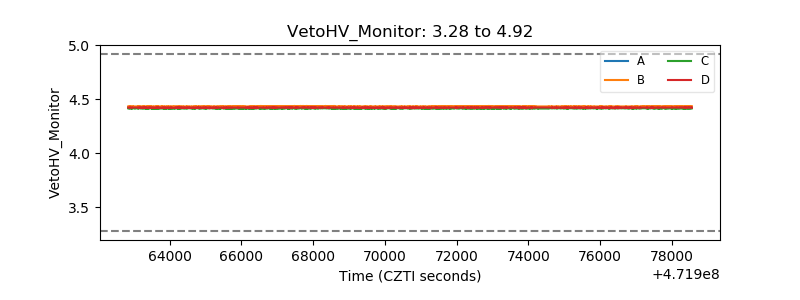 |
| Veto LLD | 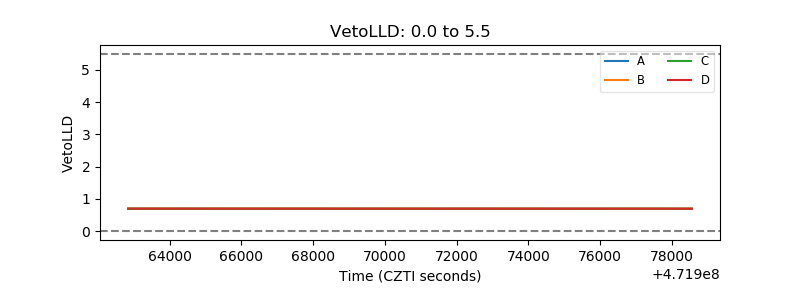 |
| Alpha Counter | 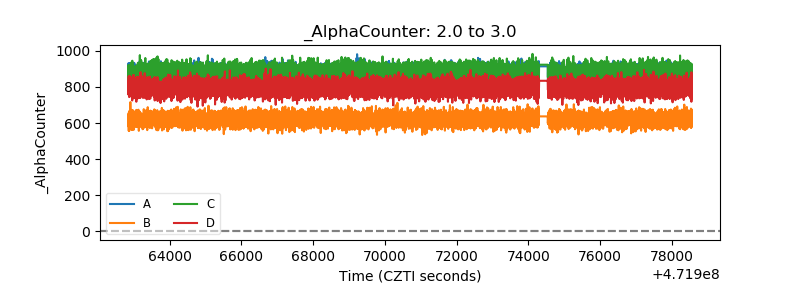 |
| _CPM_Rate | 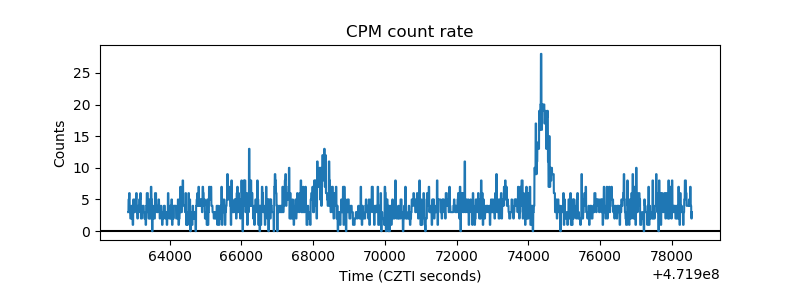 |
| CZT Counter | 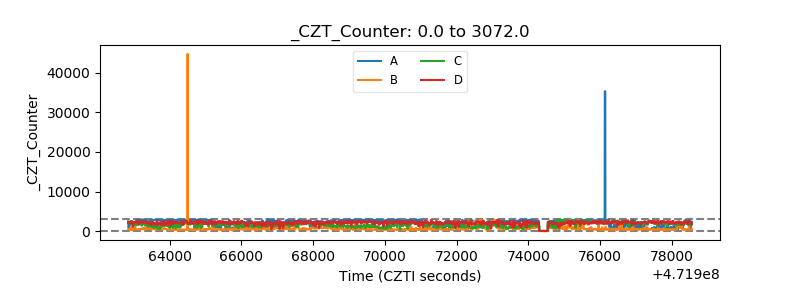 |
| +2.5 Volts monitor | 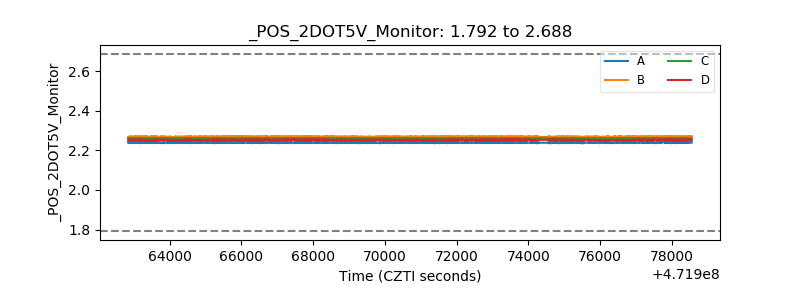 |
| +5 Volts monitor | 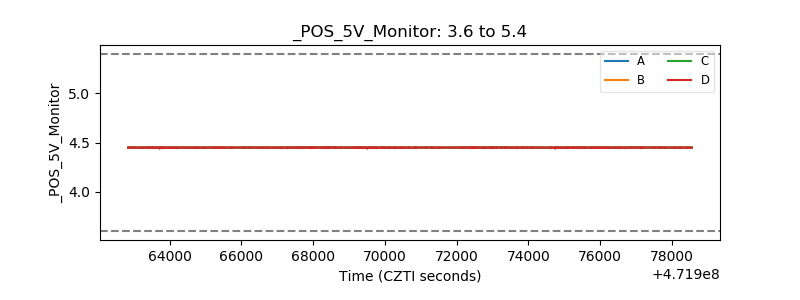 |
| _ROLL_ROT | 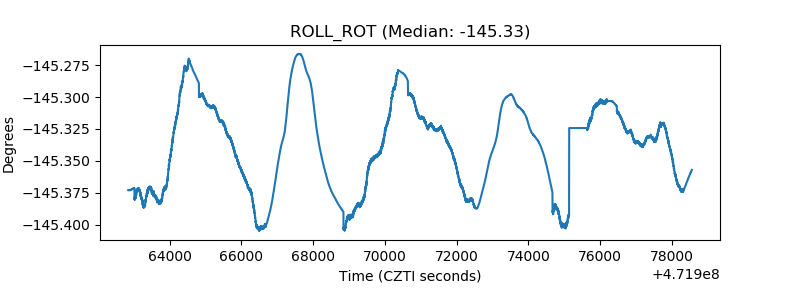 |
| _Roll_DEC | 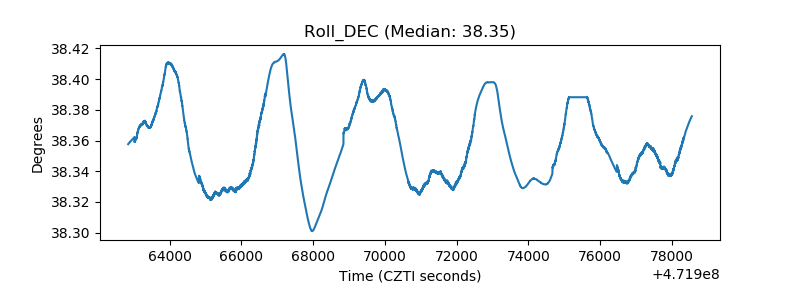 |
| _Roll_RA | 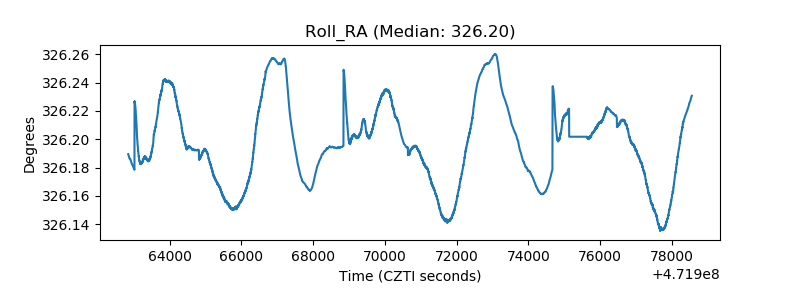 |
| Veto Counter | 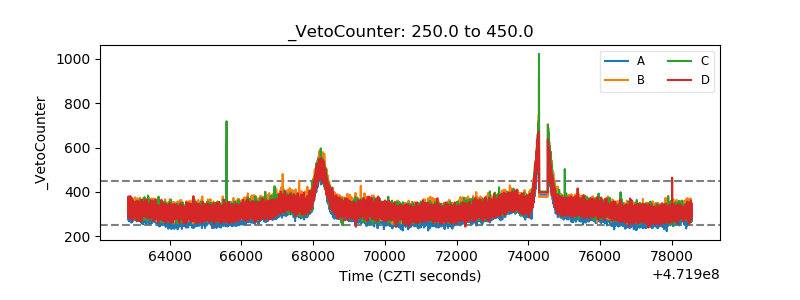 |