| Param | Original file | Final file |
|---|---|---|
| Filename | modeM0/AS1A13_037T01_9000006440_49849cztM0_level2.fits | modeM0/AS1A13_037T01_9000006440_49849cztM0_level2_quad_clean.evt |
| Size (bytes) | 1,576,549,440 | 76,947,840 |
| Size | 1.5 GB | 73.4 MB |
| Events in quadrant A | 13,320,539 | 645,877 |
| Events in quadrant B | 5,482,762 | 940,199 |
| Events in quadrant C | 19,366,294 | 83,848 |
| Events in quadrant D | 19,465,280 | 9,262 |
| Mode M9 | |||
|---|---|---|---|
| Quadrant | BADHDUFLAG | Total packets | Discarded packets |
| A | 0 | 13 | 0 |
| B | 0 | 13 | 0 |
| C | 0 | 13 | 0 |
| D | 0 | 13 | 0 |
| Mode SS | |||
|---|---|---|---|
| Quadrant | BADHDUFLAG | Total packets | Discarded packets |
| A | 0 | 192 | 0 |
| B | 0 | 192 | 0 |
| C | 0 | 192 | 0 |
| D | 0 | 192 | 0 |
| Mode M0 | |||
|---|---|---|---|
| Quadrant | BADHDUFLAG | Total packets | Discarded packets |
| A | 0 | 46124 | 2 |
| B | 0 | 22611 | 2 |
| C | 0 | 63990 | 2 |
| D | 0 | 64244 | 7 |
| Quadrant | Total seconds | Saturated seconds | Saturation percentage |
|---|---|---|---|
| A | 9369 | 2722 | 29.053261% |
| B | 9370 | 213 | 2.273212% |
| C | 9370 | 8597 | 91.750267% |
| D | 9369 | 9287 | 99.124773% |
Noise dominated data is calculated using 1-second bins in cleaned event files. If a bin has >2000 counts, and if more than 50% of those come from <1% of pixels, then it is considered to be noise-dominated and hence unusable.
| Quadrant | # 1 sec bins | Bins with >0 counts | Bins with >2000 counts | High rate bins dominated by noise | Noise dominated (total time) | Noise dominated (detector-on time) | Marked lightcurve |
|---|---|---|---|---|---|---|---|
| A | 10724 | 9371 | 2263 | 2263 | 21.10% | 24.15% | 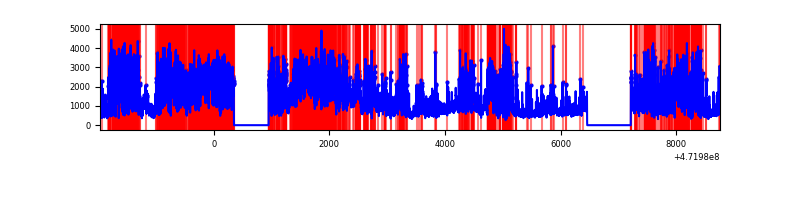 |
| B | 10725 | 9372 | 110 | 110 | 1.03% | 1.17% | 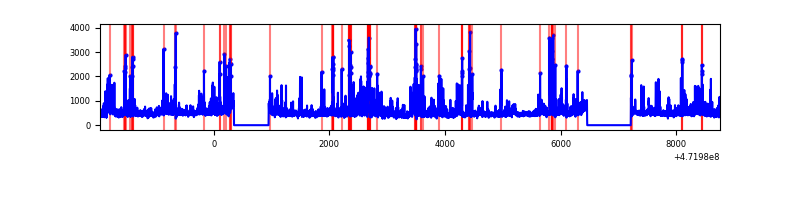 |
| C | 10724 | 9369 | 5490 | 5490 | 51.19% | 58.60% | 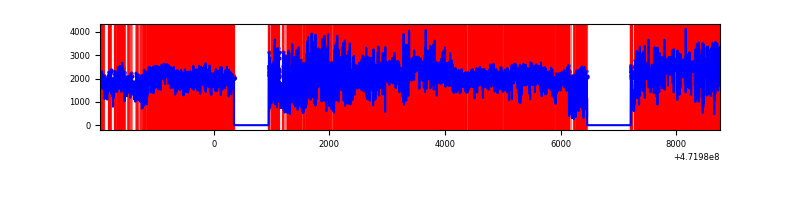 |
| D | 10723 | 9368 | 5546 | 5546 | 51.72% | 59.20% | 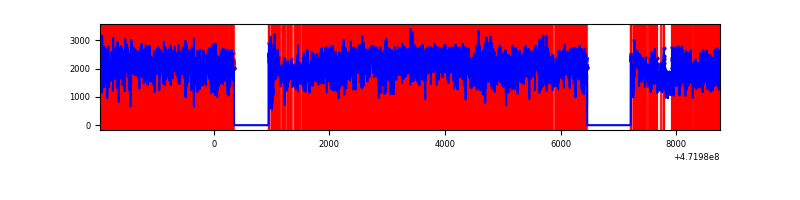 |
Top three noisy pixels from each quadrant. If the there are fewer than three noisy pixels in the level2.evt file, extra rows are filled as -1
| Pixel properties | Quadrant properties | ||||||
|---|---|---|---|---|---|---|---|
| Quadrant | DetID | PixID | Counts | Sigma | Mean | Median | Sigma |
| A | 4 | 4 | 2976783 | 13169.77 | 891 | 870 | 226.0 |
| A | 3 | 84 | 2236203 | 9892.36 | 891 | 870 | 226.0 |
| A | 3 | 14 | 1168112 | 5165.58 | 891 | 870 | 226.0 |
| B | 0 | 229 | 531410 | 2486.76 | 1007 | 972 | 213.3 |
| B | 4 | 206 | 493470 | 2308.89 | 1007 | 972 | 213.3 |
| B | 10 | 28 | 147288 | 685.95 | 1007 | 972 | 213.3 |
| C | 1 | 44 | 3524381 | 32879.9 | 327 | 323 | 107.2 |
| C | 15 | 197 | 2827003 | 26373.28 | 327 | 323 | 107.2 |
| C | 15 | 164 | 1914330 | 17857.92 | 327 | 323 | 107.2 |
| D | 8 | 129 | 6956541 | 71232.11 | 269 | 256 | 97.7 |
| D | 7 | 61 | 3858624 | 39509.55 | 269 | 256 | 97.7 |
| D | 15 | 185 | 1355707 | 13879.77 | 269 | 256 | 97.7 |
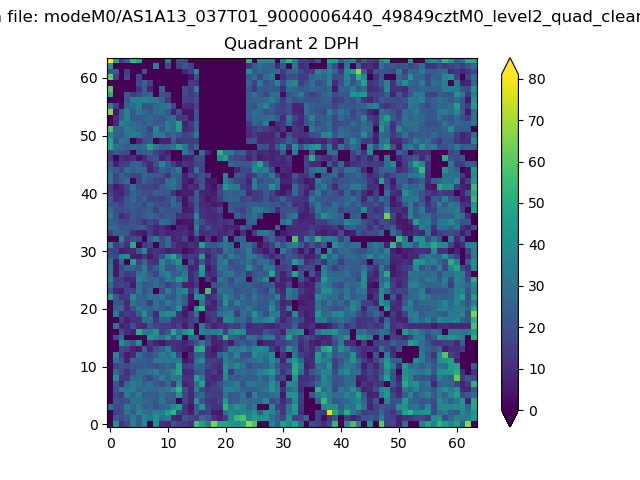
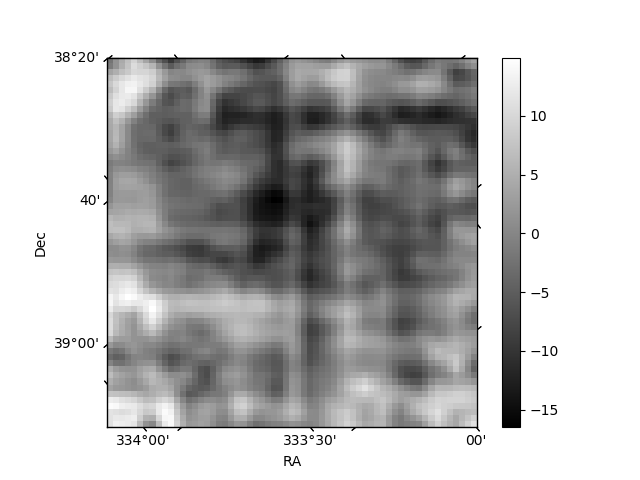
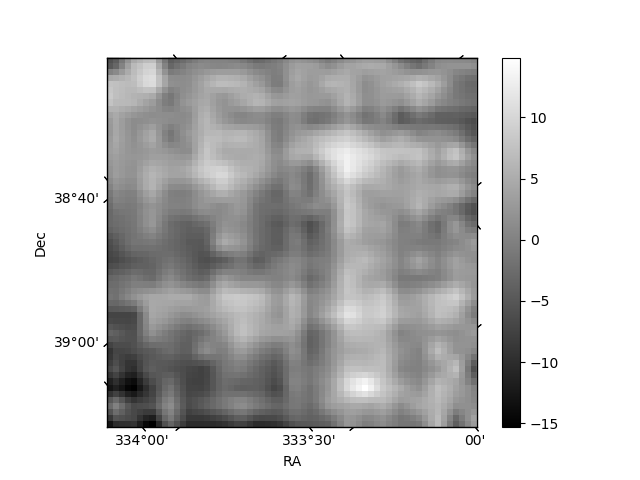
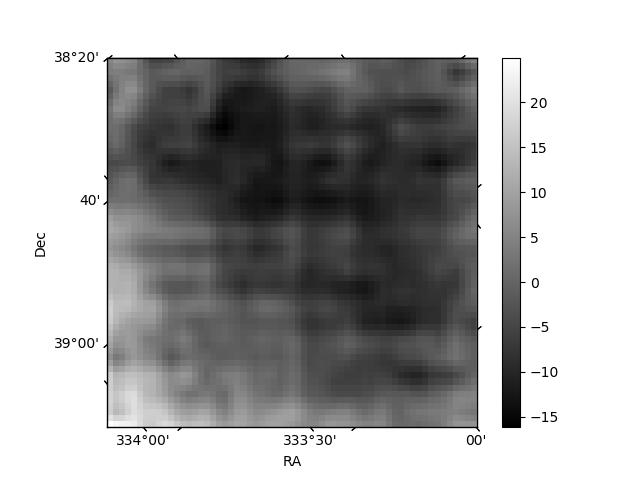
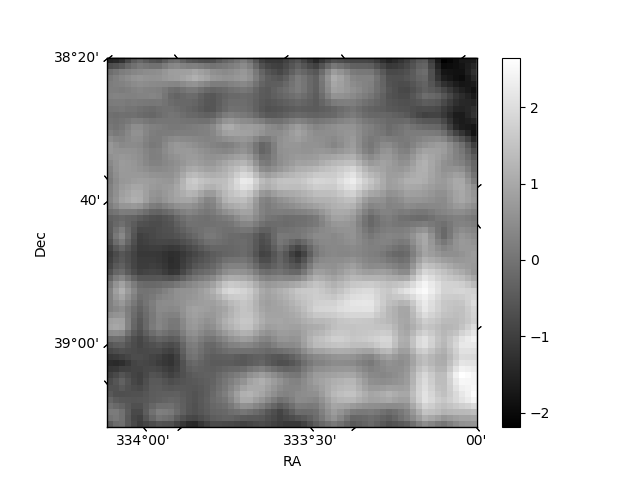
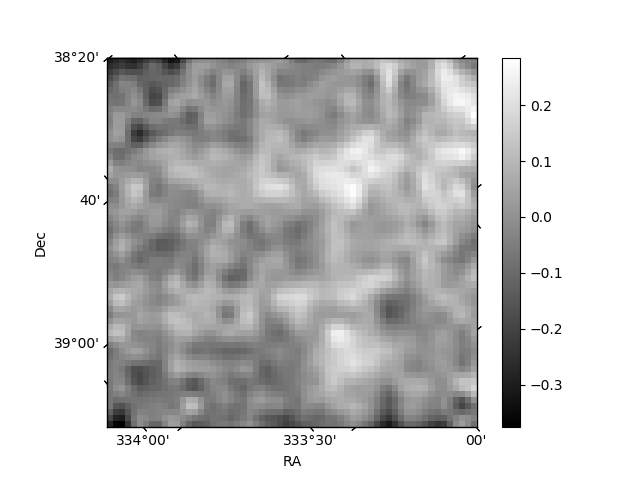
Histogram calculated using DETX and DETY for each event in the final _common_clean file
| Quadrant A | 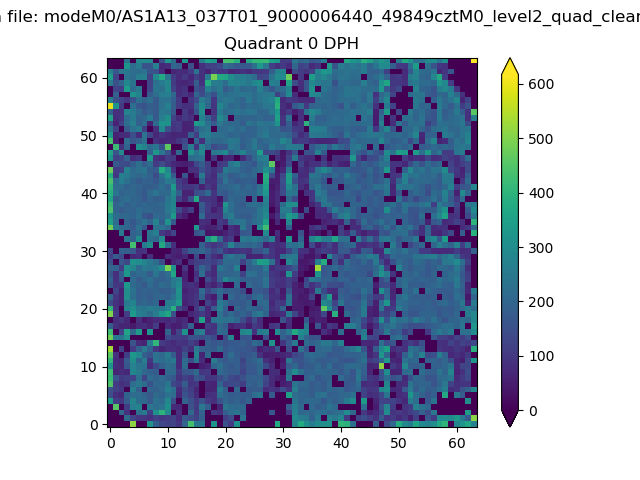 |
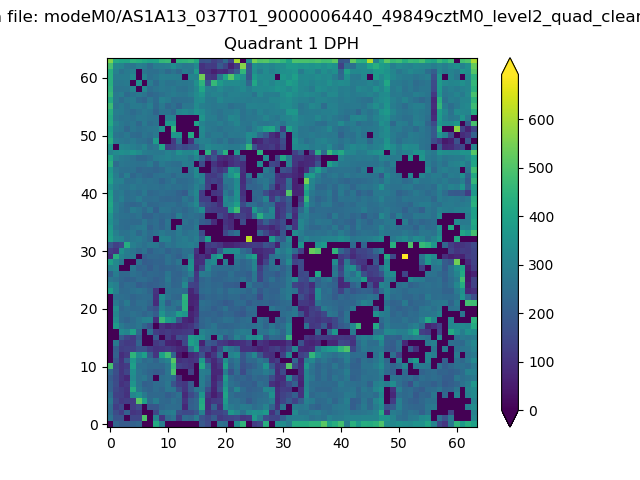 |
Quadrant B |
|---|---|---|---|
| Quadrant D | 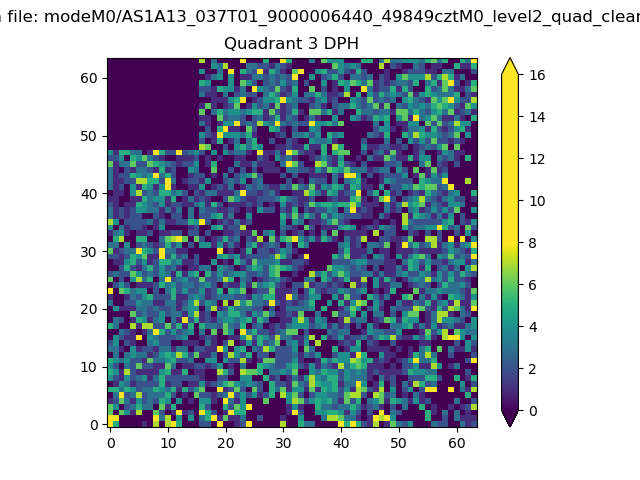 |
 |
Quadrant C |
| Plot type | Count rate plots | Images |
|---|---|---|
| Comparison with Poisson distribution Blue bars denote a histogram of data divided into 1 sec bins. Red curve is a Poisson curve with rate = median count rate of data. |
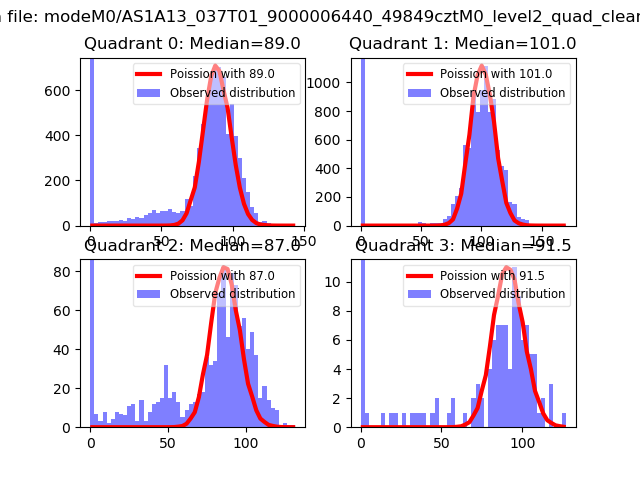 |
 |
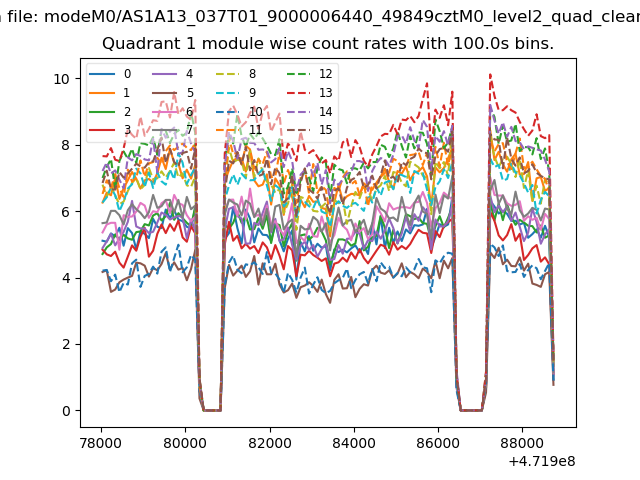
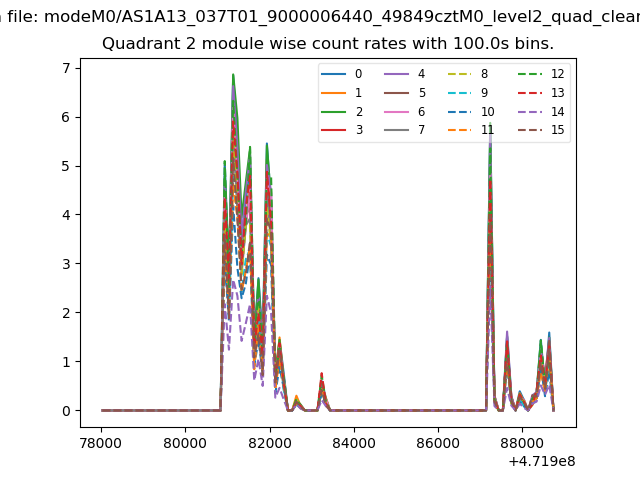
| Quadrant-wise count rates Data is divided into 100 sec bins |
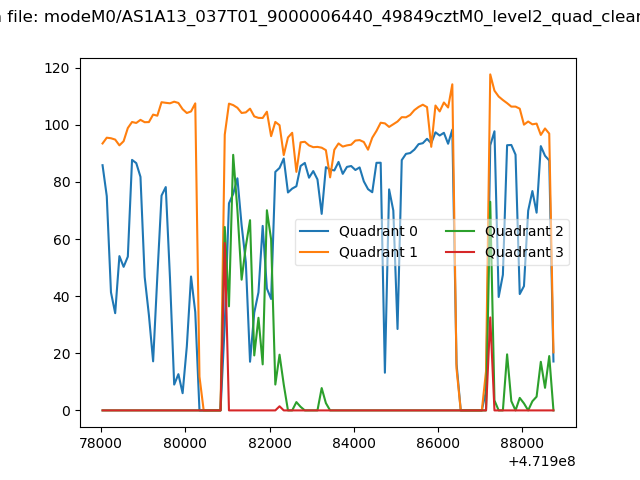 |
|
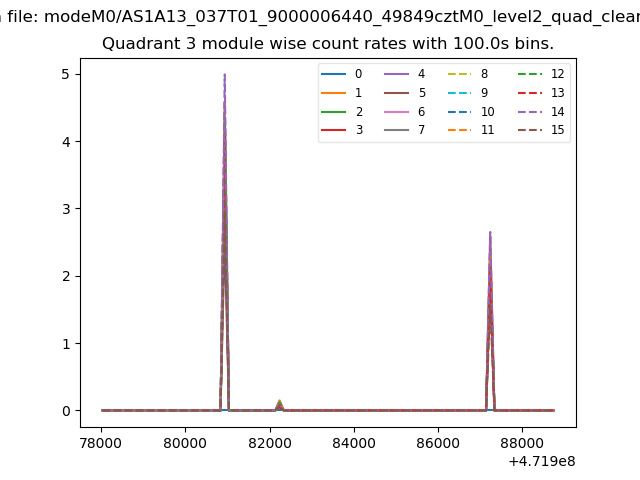
| Module-wise count rates for Quadrant A Data is divided into 100 sec bins |
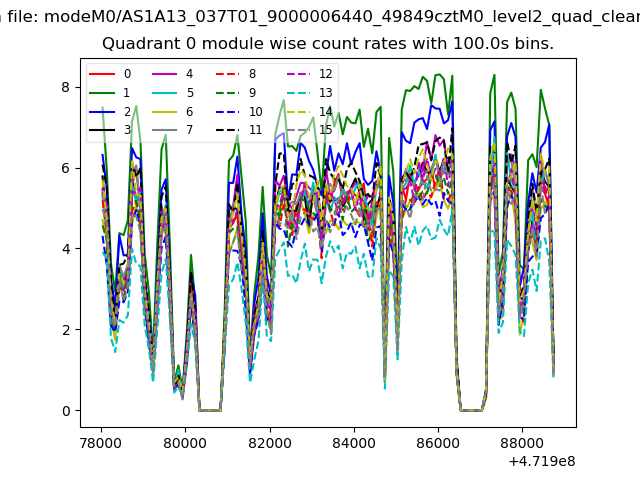 |
 |
| Module-wise count rates for Quadrant B Data is divided into 100 sec bins |
 |
 |
| Module-wise count rates for Quadrant C Data is divided into 100 sec bins |
 |
 |
| Module-wise count rates for Quadrant D Data is divided into 100 sec bins |
 |
 |
| Parameter | Plot |
|---|---|
| CZT HV Monitor | 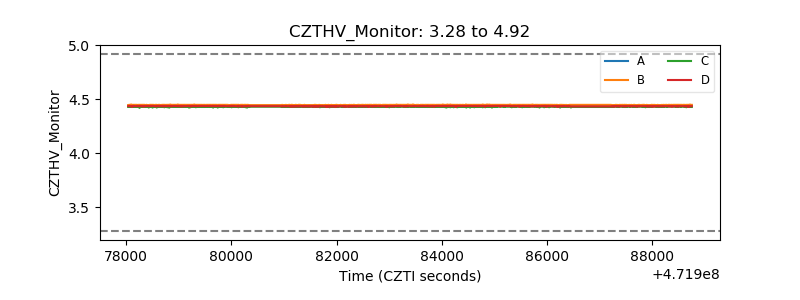 |
| D_VDD | 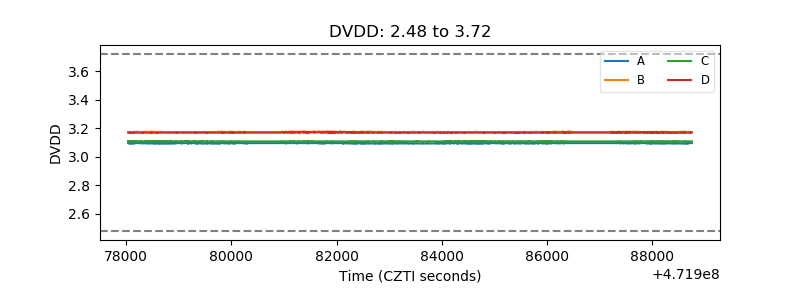 |
| Temperature 1 | 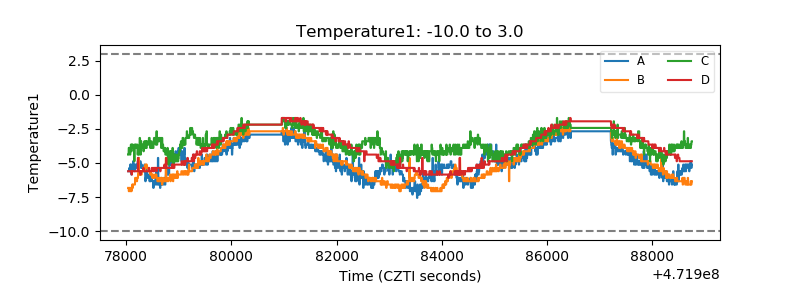 |
| Veto HV Monitor | 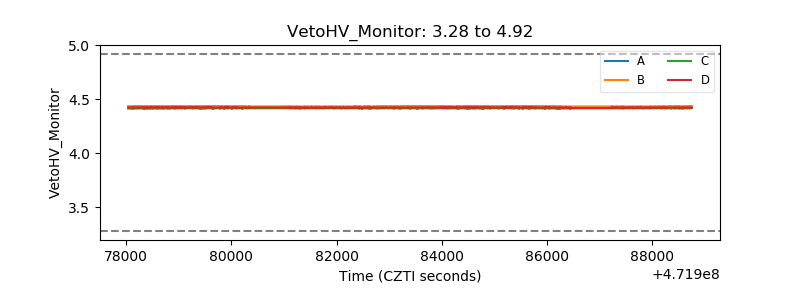 |
| Veto LLD | 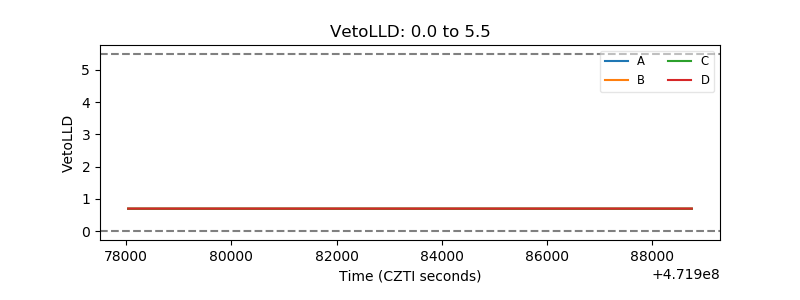 |
| Alpha Counter | 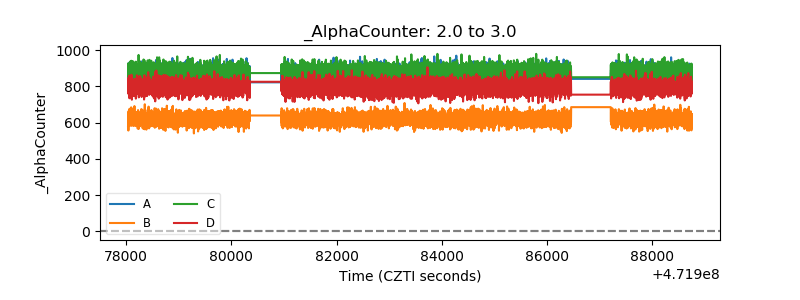 |
| _CPM_Rate | 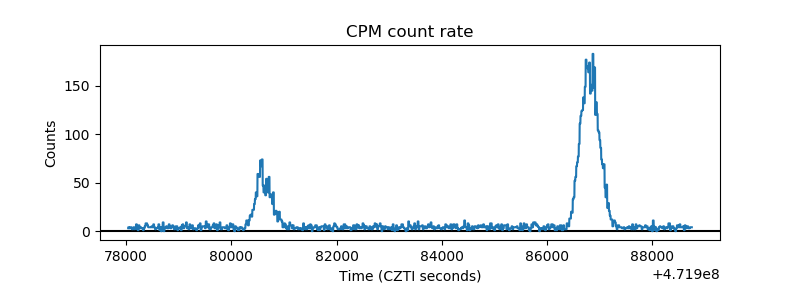 |
| CZT Counter | 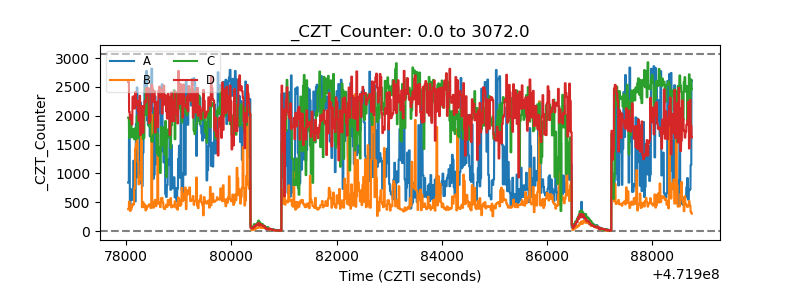 |
| +2.5 Volts monitor | 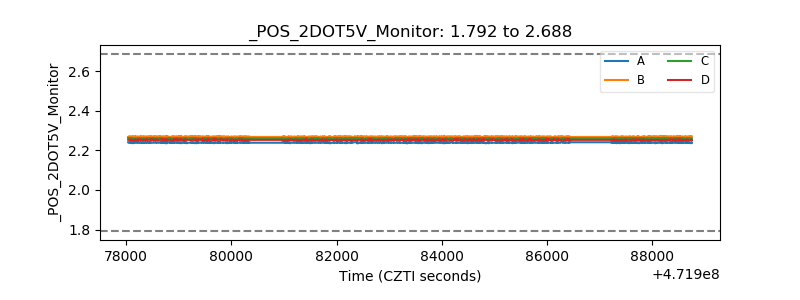 |
| +5 Volts monitor | 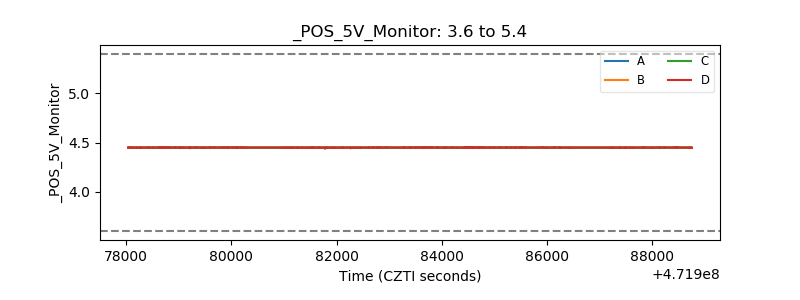 |
| _ROLL_ROT | 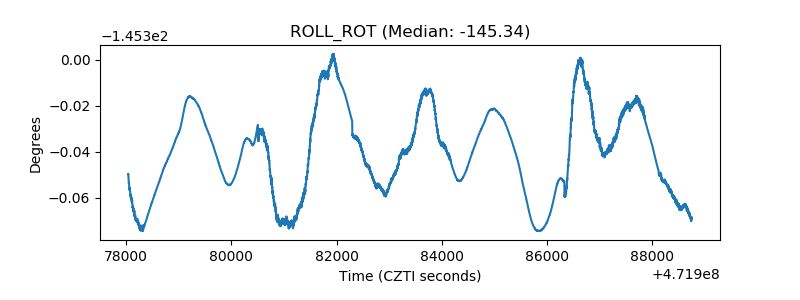 |
| _Roll_DEC | 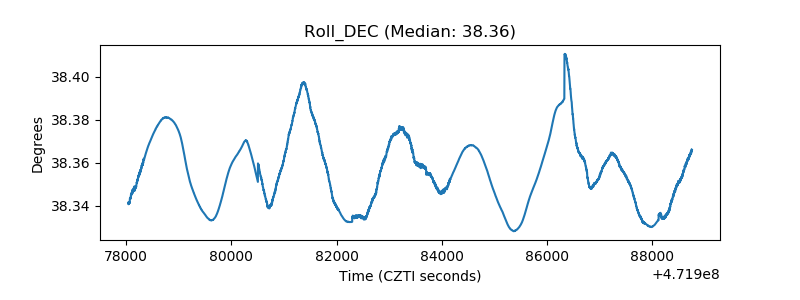 |
| _Roll_RA | 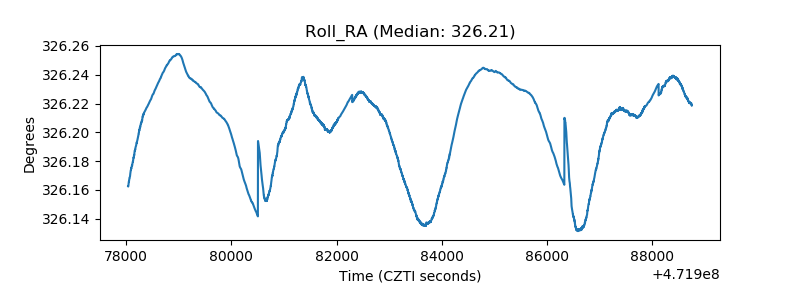 |
| Veto Counter | 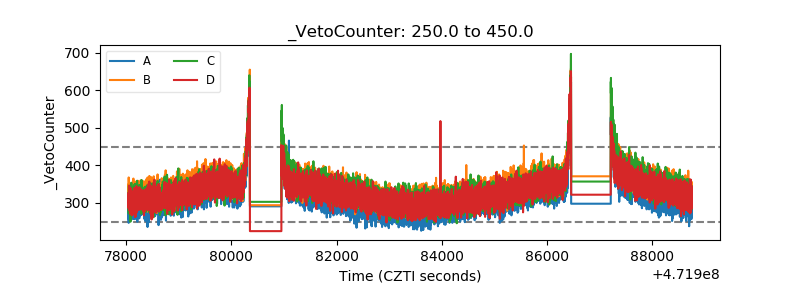 |