| Param | Original file | Final file |
|---|---|---|
| Filename | modeM0/AS1A13_037T01_9000006440_49850cztM0_level2.fits | modeM0/AS1A13_037T01_9000006440_49850cztM0_level2_quad_clean.evt |
| Size (bytes) | 1,056,286,080 | 47,246,400 |
| Size | 1007.4 MB | 45.1 MB |
| Events in quadrant A | 9,483,275 | 361,596 |
| Events in quadrant B | 3,526,420 | 615,652 |
| Events in quadrant C | 12,932,290 | 21,070 |
| Events in quadrant D | 12,681,614 | 2,442 |
| Mode M9 | |||
|---|---|---|---|
| Quadrant | BADHDUFLAG | Total packets | Discarded packets |
| A | 0 | 9 | 0 |
| B | 0 | 9 | 0 |
| C | 0 | 9 | 0 |
| D | 0 | 9 | 0 |
| Mode SS | |||
|---|---|---|---|
| Quadrant | BADHDUFLAG | Total packets | Discarded packets |
| A | 0 | 126 | 0 |
| B | 0 | 126 | 0 |
| C | 0 | 126 | 0 |
| D | 0 | 126 | 0 |
| Mode M0 | |||
|---|---|---|---|
| Quadrant | BADHDUFLAG | Total packets | Discarded packets |
| A | 0 | 32389 | 1 |
| B | 0 | 14799 | 1 |
| C | 0 | 42650 | 1 |
| D | 0 | 41898 | 1 |
| Quadrant | Total seconds | Saturated seconds | Saturation percentage |
|---|---|---|---|
| A | 6149 | 2407 | 39.144576% |
| B | 6149 | 141 | 2.293056% |
| C | 6149 | 5983 | 97.300374% |
| D | 6149 | 6133 | 99.739795% |
Noise dominated data is calculated using 1-second bins in cleaned event files. If a bin has >2000 counts, and if more than 50% of those come from <1% of pixels, then it is considered to be noise-dominated and hence unusable.
| Quadrant | # 1 sec bins | Bins with >0 counts | Bins with >2000 counts | High rate bins dominated by noise | Noise dominated (total time) | Noise dominated (detector-on time) | Marked lightcurve |
|---|---|---|---|---|---|---|---|
| A | 7129 | 6149 | 2161 | 2161 | 30.31% | 35.14% | 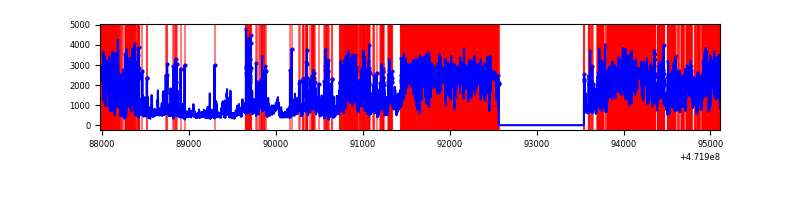 |
| B | 7129 | 6150 | 91 | 91 | 1.28% | 1.48% |  |
| C | 7128 | 6148 | 3553 | 3553 | 49.85% | 57.79% | 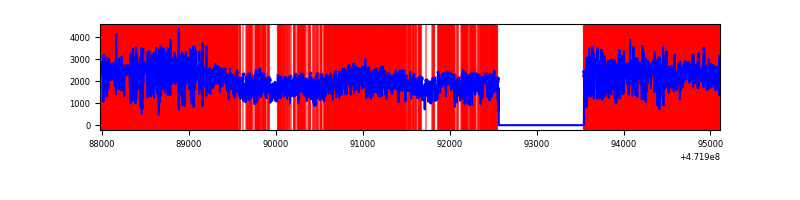 |
| D | 7128 | 6148 | 3444 | 3444 | 48.32% | 56.02% | 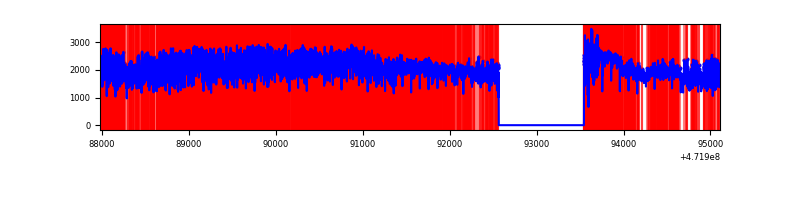 |
Top three noisy pixels from each quadrant. If the there are fewer than three noisy pixels in the level2.evt file, extra rows are filled as -1
| Pixel properties | Quadrant properties | ||||||
|---|---|---|---|---|---|---|---|
| Quadrant | DetID | PixID | Counts | Sigma | Mean | Median | Sigma |
| A | 3 | 84 | 2477278 | 17953.26 | 539 | 525 | 138.0 |
| A | 0 | 98 | 2108981 | 15283.58 | 539 | 525 | 138.0 |
| A | 4 | 4 | 600616 | 4349.88 | 539 | 525 | 138.0 |
| B | 4 | 206 | 343558 | 2491.38 | 644 | 622 | 137.6 |
| B | 0 | 229 | 300277 | 2176.95 | 644 | 622 | 137.6 |
| B | 10 | 28 | 126834 | 916.91 | 644 | 622 | 137.6 |
| C | 1 | 44 | 2975224 | 50788.4 | 183 | 182 | 58.6 |
| C | 15 | 189 | 1933731 | 33008.56 | 183 | 182 | 58.6 |
| C | 15 | 197 | 1125823 | 19216.37 | 183 | 182 | 58.6 |
| D | 8 | 129 | 4929714 | 98581.69 | 122 | 115 | 50.0 |
| D | 7 | 61 | 4227436 | 84537.6 | 122 | 115 | 50.0 |
| D | 7 | 126 | 659865 | 13193.62 | 122 | 115 | 50.0 |
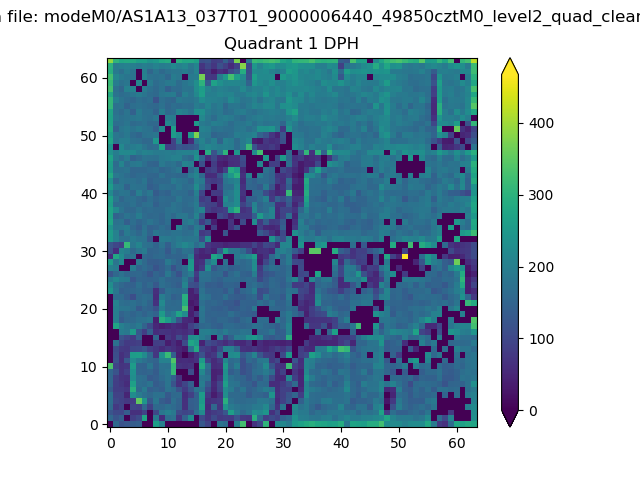
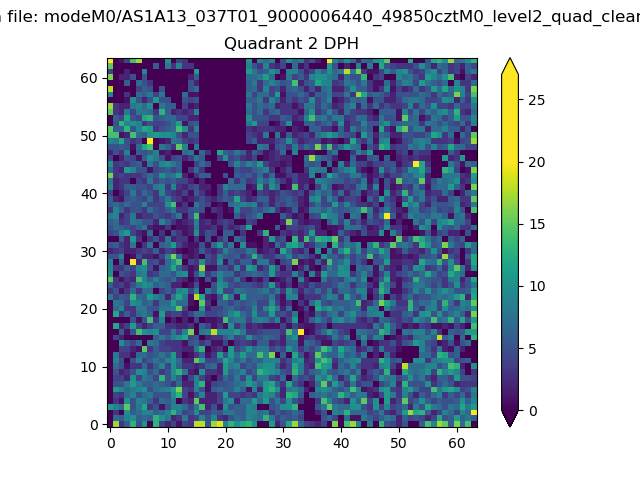
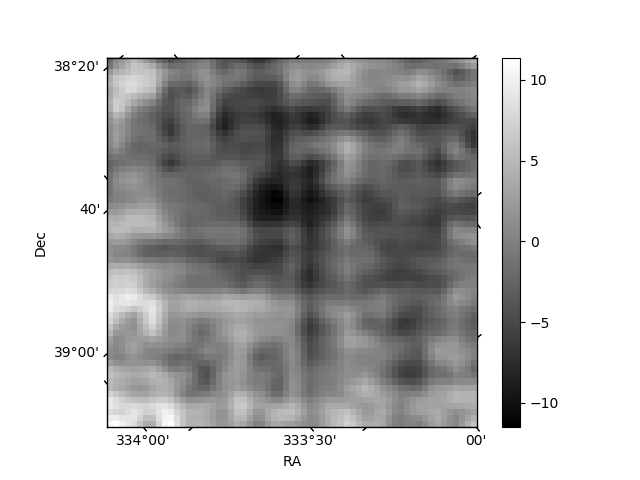
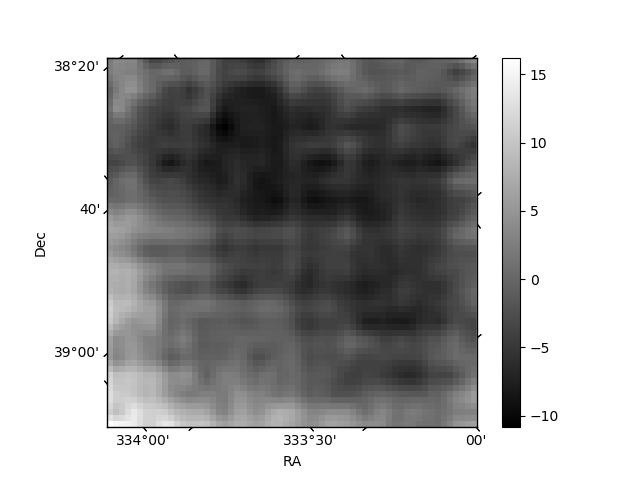
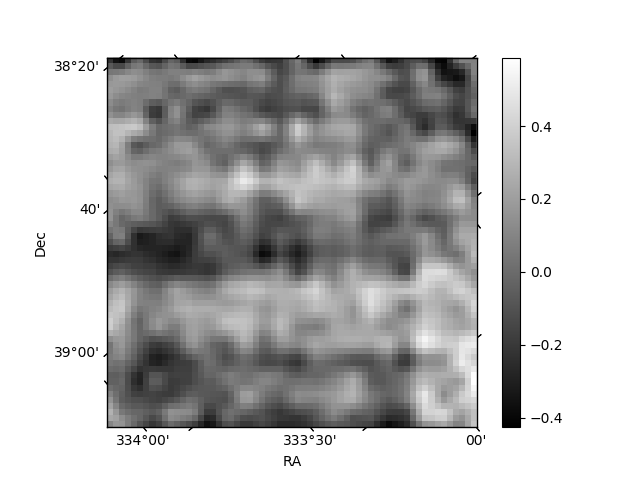
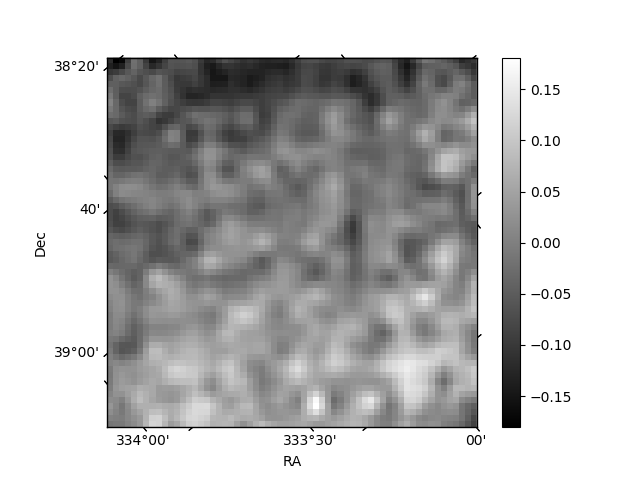
Histogram calculated using DETX and DETY for each event in the final _common_clean file
| Quadrant A | 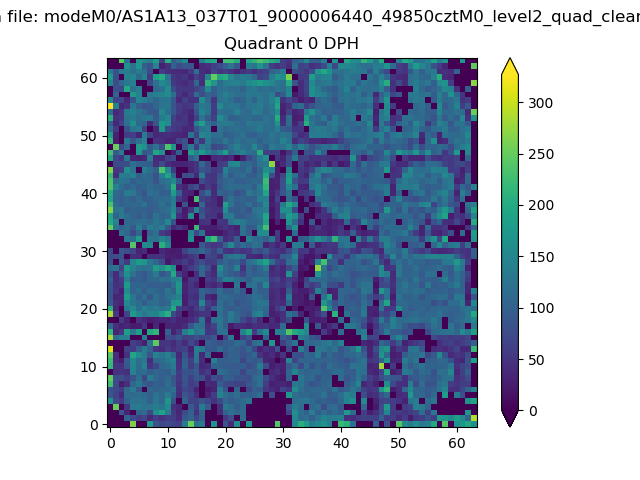 |
 |
Quadrant B |
|---|---|---|---|
| Quadrant D | 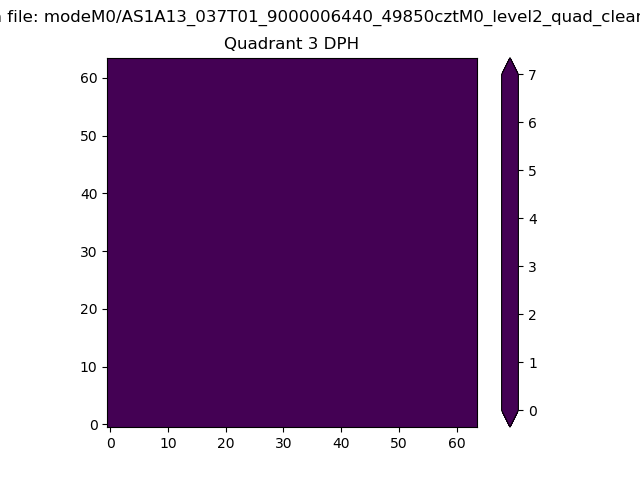 |
 |
Quadrant C |
| Plot type | Count rate plots | Images |
|---|---|---|
| Comparison with Poisson distribution Blue bars denote a histogram of data divided into 1 sec bins. Red curve is a Poisson curve with rate = median count rate of data. |
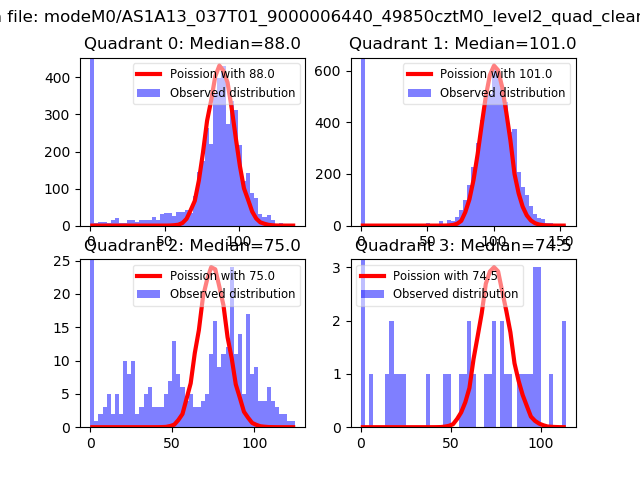 |
 |
| Quadrant-wise count rates Data is divided into 100 sec bins |
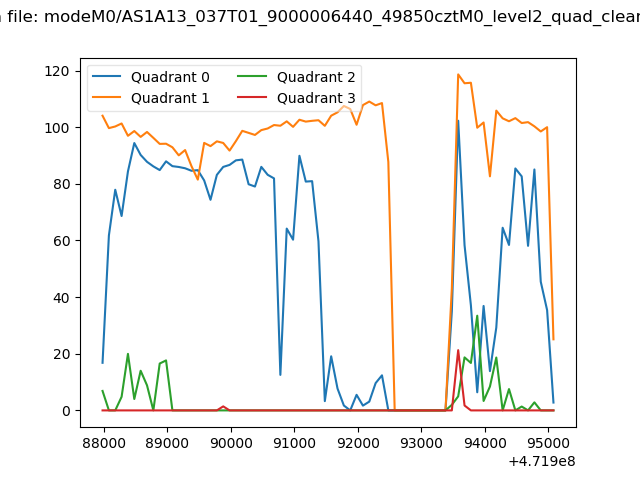 |
|
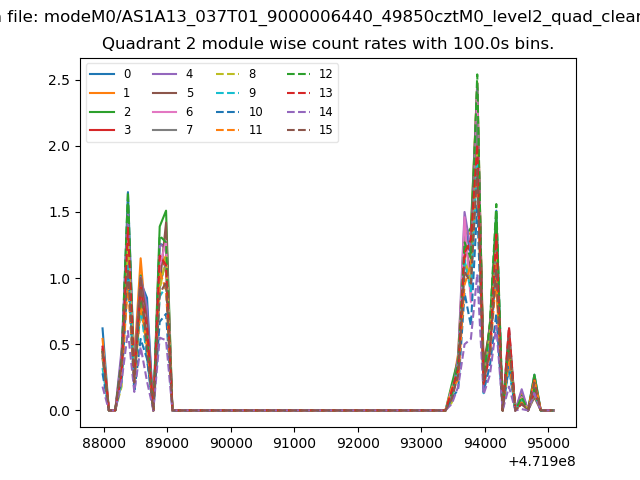
| Module-wise count rates for Quadrant A Data is divided into 100 sec bins |
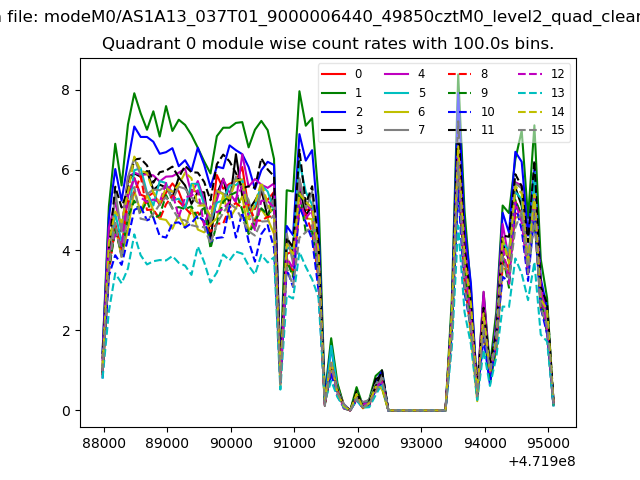 |
 |
| Module-wise count rates for Quadrant B Data is divided into 100 sec bins |
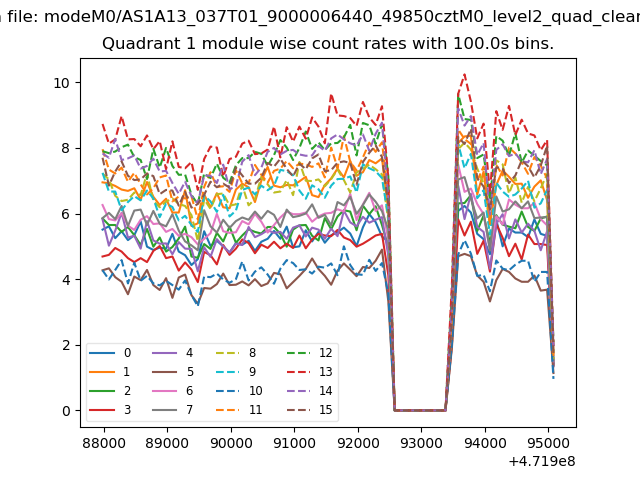 |
 |
| Module-wise count rates for Quadrant C Data is divided into 100 sec bins |
 |
 |
| Module-wise count rates for Quadrant D Data is divided into 100 sec bins |
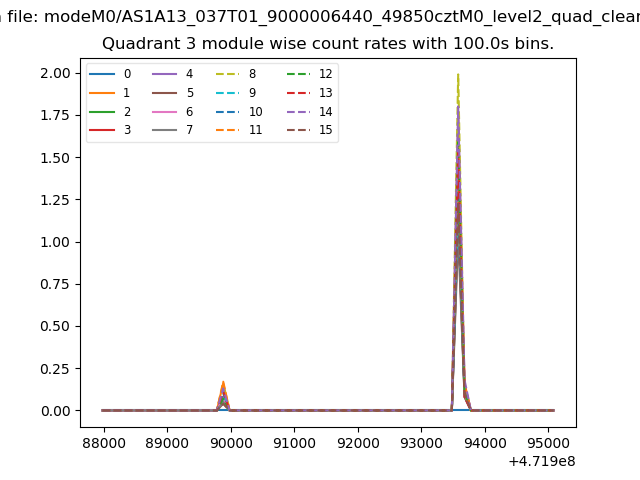 |
 |
| Parameter | Plot |
|---|---|
| CZT HV Monitor | 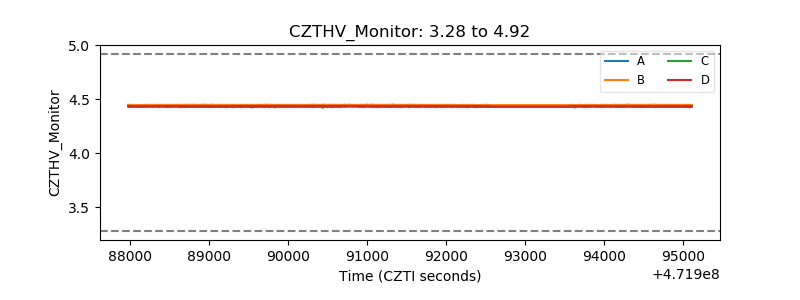 |
| D_VDD | 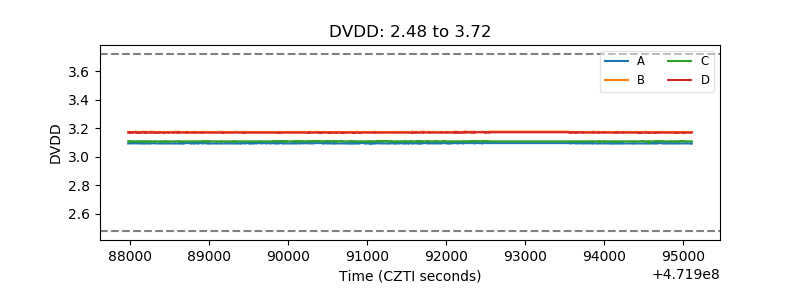 |
| Temperature 1 | 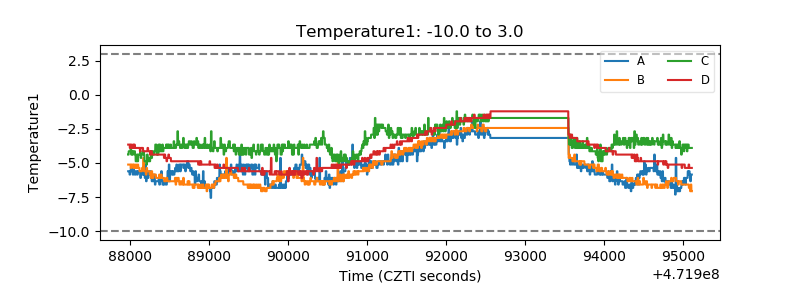 |
| Veto HV Monitor | 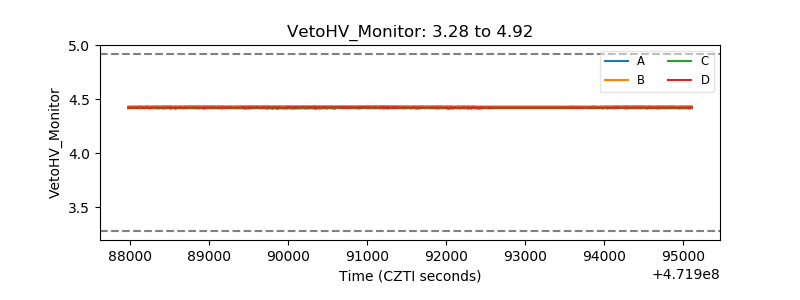 |
| Veto LLD | 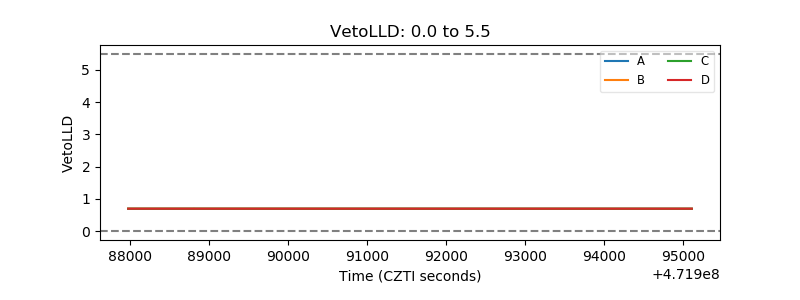 |
| Alpha Counter | 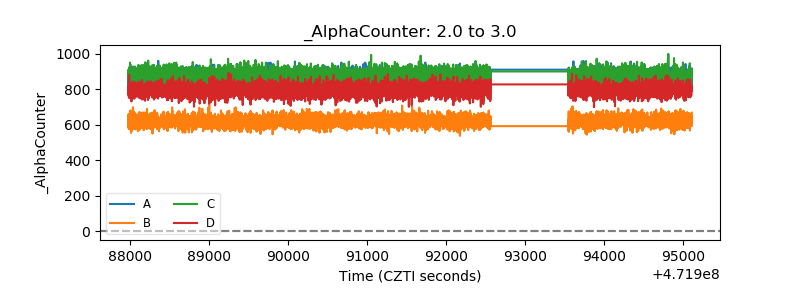 |
| _CPM_Rate | 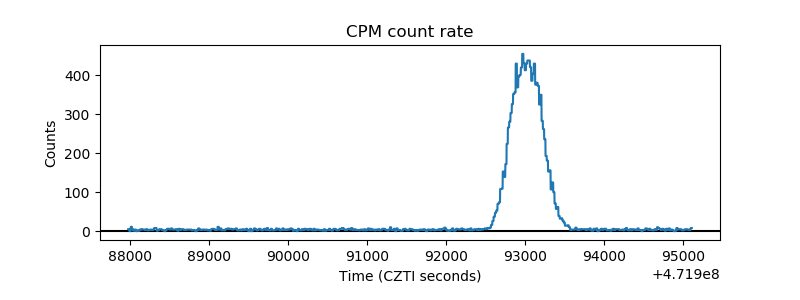 |
| CZT Counter | 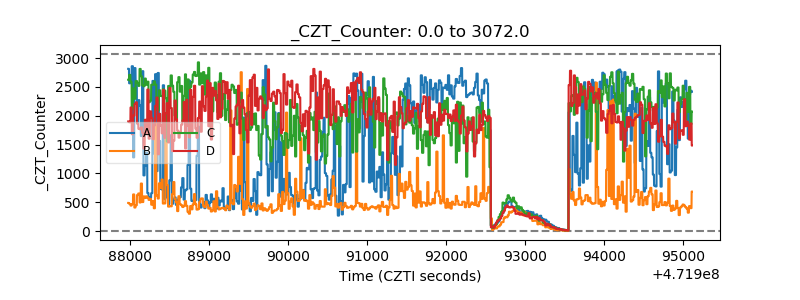 |
| +2.5 Volts monitor | 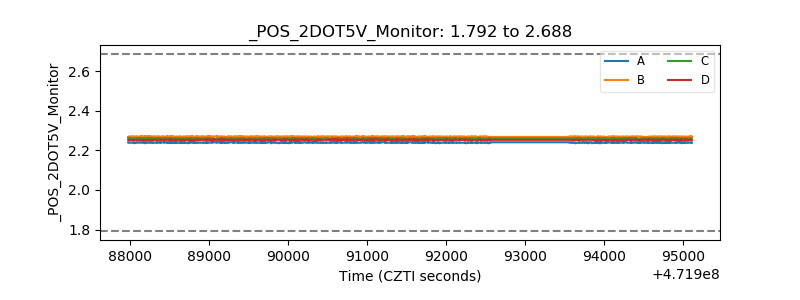 |
| +5 Volts monitor |  |
| _ROLL_ROT | 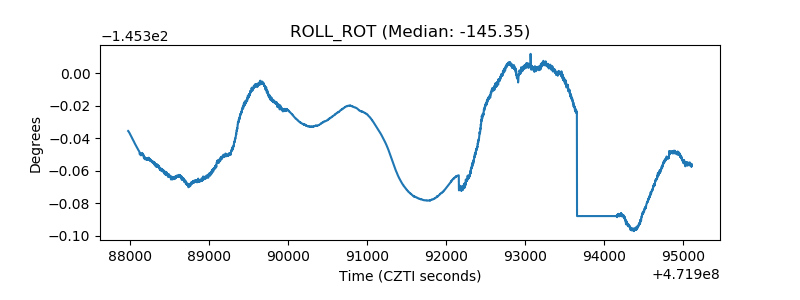 |
| _Roll_DEC | 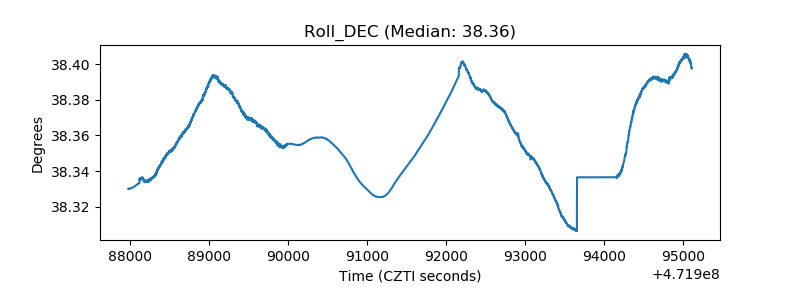 |
| _Roll_RA | 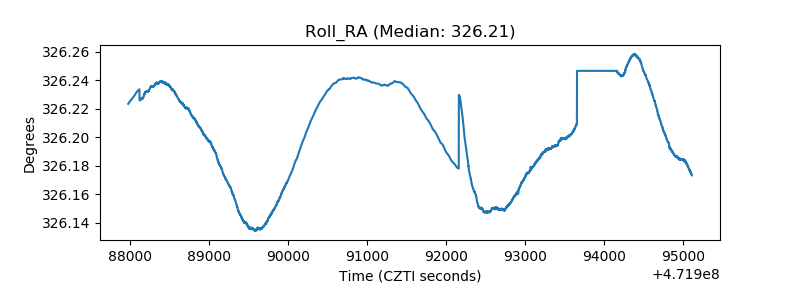 |
| Veto Counter | 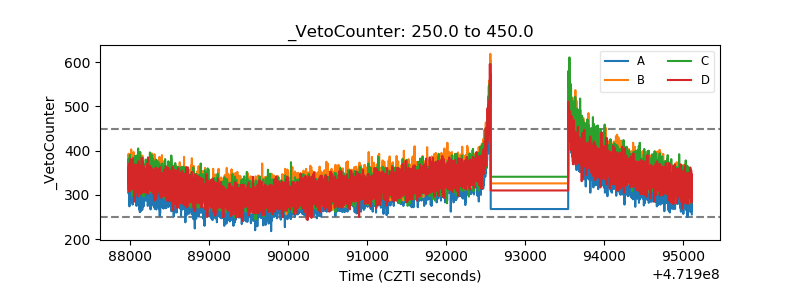 |