| Param | Original file | Final file |
|---|---|---|
| Filename | modeM0/AS1A13_037T01_9000006440_49852cztM0_level2.fits | modeM0/AS1A13_037T01_9000006440_49852cztM0_level2_quad_clean.evt |
| Size (bytes) | 1,022,408,640 | 59,909,760 |
| Size | 975.0 MB | 57.1 MB |
| Events in quadrant A | 9,808,055 | 510,097 |
| Events in quadrant B | 3,297,471 | 631,514 |
| Events in quadrant C | 12,160,080 | 130,022 |
| Events in quadrant D | 12,107,679 | 109,677 |
| Mode M9 | |||
|---|---|---|---|
| Quadrant | BADHDUFLAG | Total packets | Discarded packets |
| A | 0 | 11 | 0 |
| B | 0 | 11 | 0 |
| C | 0 | 11 | 0 |
| D | 0 | 11 | 0 |
| Mode SS | |||
|---|---|---|---|
| Quadrant | BADHDUFLAG | Total packets | Discarded packets |
| A | 0 | 124 | 0 |
| B | 0 | 124 | 0 |
| C | 0 | 124 | 0 |
| D | 0 | 124 | 0 |
| Mode M0 | |||
|---|---|---|---|
| Quadrant | BADHDUFLAG | Total packets | Discarded packets |
| A | 0 | 33387 | 0 |
| B | 0 | 14104 | 0 |
| C | 0 | 40307 | 0 |
| D | 0 | 40139 | 0 |
| Quadrant | Total seconds | Saturated seconds | Saturation percentage |
|---|---|---|---|
| A | 6101 | 2115 | 34.666448% |
| B | 6101 | 99 | 1.622685% |
| C | 6101 | 5847 | 95.836748% |
| D | 6100 | 6100 | 100.000000% |
Noise dominated data is calculated using 1-second bins in cleaned event files. If a bin has >2000 counts, and if more than 50% of those come from <1% of pixels, then it is considered to be noise-dominated and hence unusable.
| Quadrant | # 1 sec bins | Bins with >0 counts | Bins with >2000 counts | High rate bins dominated by noise | Noise dominated (total time) | Noise dominated (detector-on time) | Marked lightcurve |
|---|---|---|---|---|---|---|---|
| A | 7176 | 6101 | 1883 | 1883 | 26.24% | 30.86% | 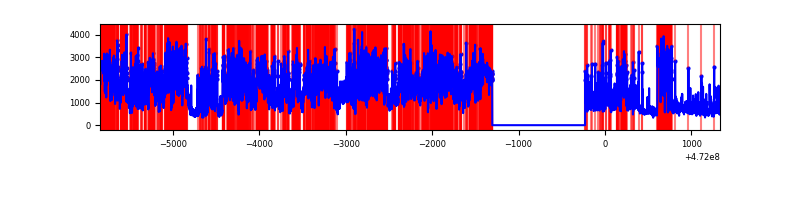 |
| B | 7176 | 6102 | 45 | 45 | 0.63% | 0.74% | 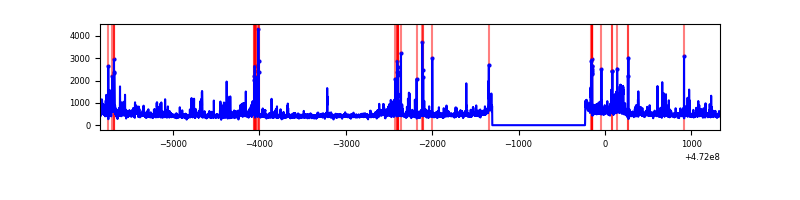 |
| C | 7175 | 6100 | 3219 | 3219 | 44.86% | 52.77% | 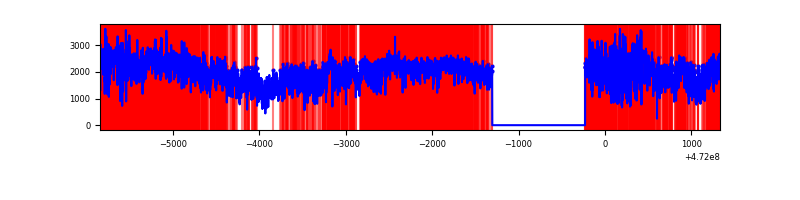 |
| D | 7174 | 6099 | 2664 | 2664 | 37.13% | 43.68% |  |
Top three noisy pixels from each quadrant. If the there are fewer than three noisy pixels in the level2.evt file, extra rows are filled as -1
| Pixel properties | Quadrant properties | ||||||
|---|---|---|---|---|---|---|---|
| Quadrant | DetID | PixID | Counts | Sigma | Mean | Median | Sigma |
| A | 3 | 84 | 3868478 | 25891.59 | 580 | 565 | 149.4 |
| A | 0 | 98 | 779533 | 5214.37 | 580 | 565 | 149.4 |
| A | 8 | 38 | 565296 | 3780.28 | 580 | 565 | 149.4 |
| B | 0 | 229 | 227507 | 1619.23 | 653 | 632 | 140.1 |
| B | 4 | 206 | 178373 | 1268.56 | 653 | 632 | 140.1 |
| B | 10 | 28 | 128148 | 910.1 | 653 | 632 | 140.1 |
| C | 15 | 189 | 3985067 | 71180.66 | 164 | 160 | 56.0 |
| C | 1 | 44 | 1552119 | 27721.97 | 164 | 160 | 56.0 |
| C | 15 | 197 | 1396961 | 24950.45 | 164 | 160 | 56.0 |
| D | 7 | 61 | 5063890 | 88603.95 | 148 | 140 | 57.2 |
| D | 8 | 129 | 2704890 | 47326.89 | 148 | 140 | 57.2 |
| D | 15 | 185 | 982028 | 17180.78 | 148 | 140 | 57.2 |
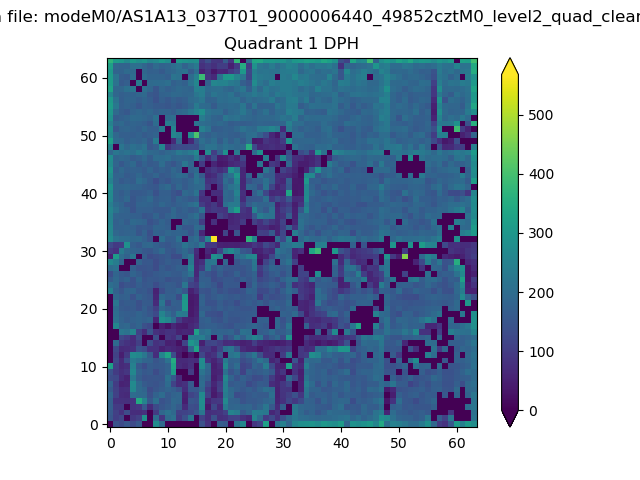
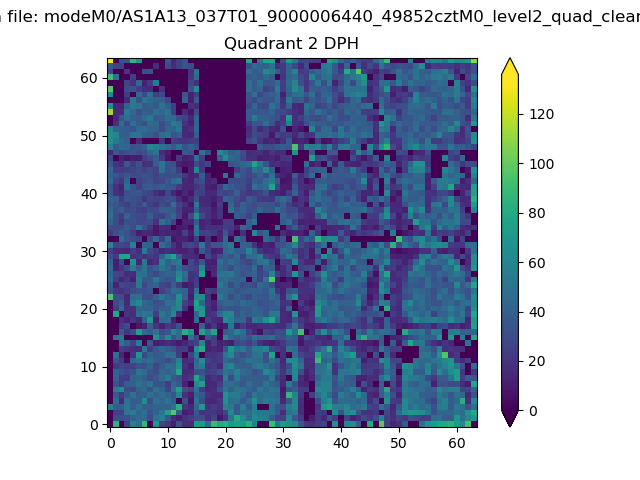
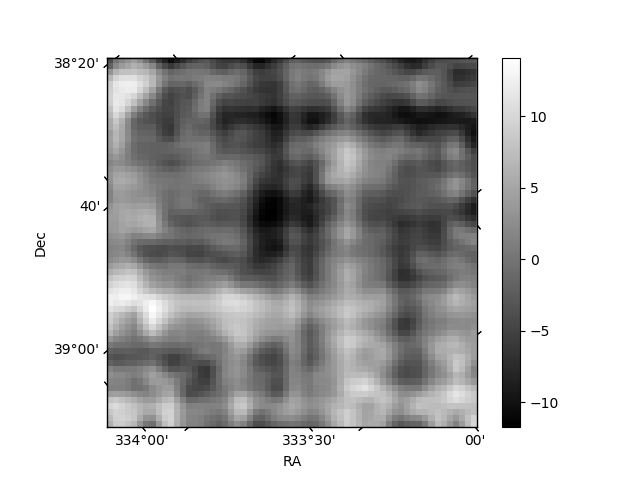
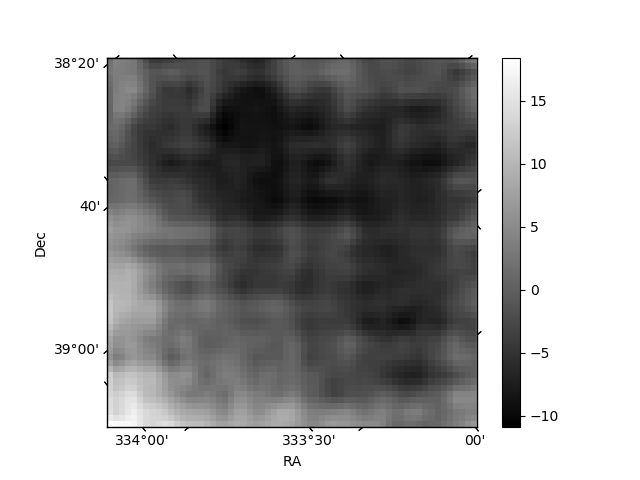
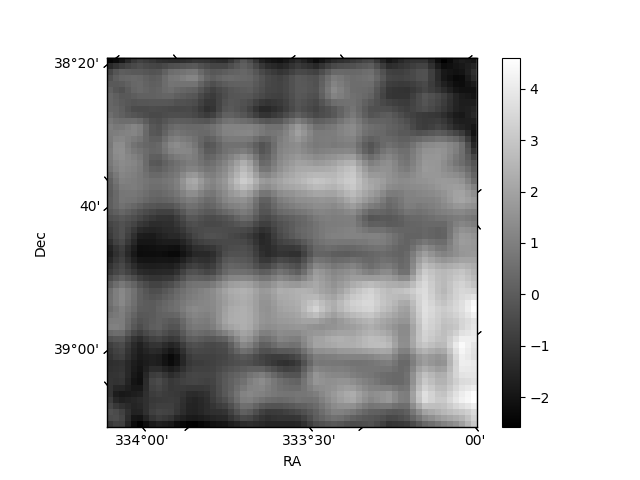
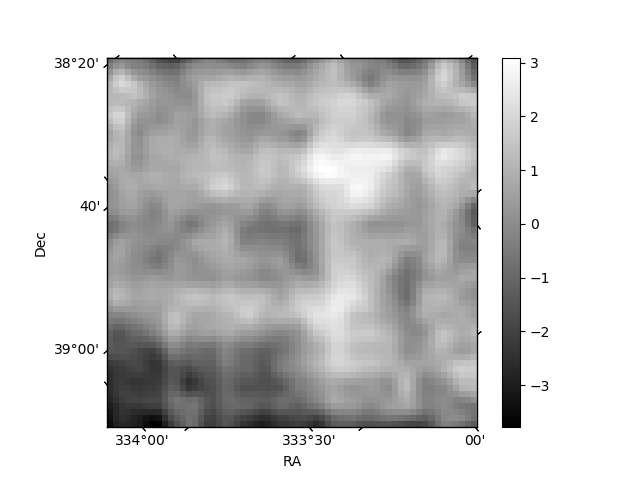
Histogram calculated using DETX and DETY for each event in the final _common_clean file
| Quadrant A | 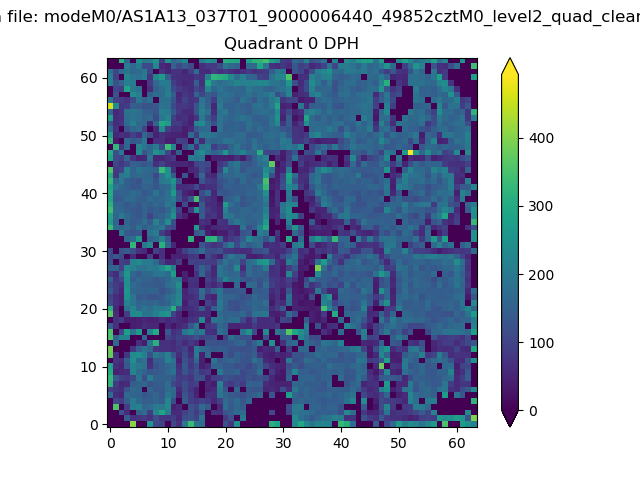 |
 |
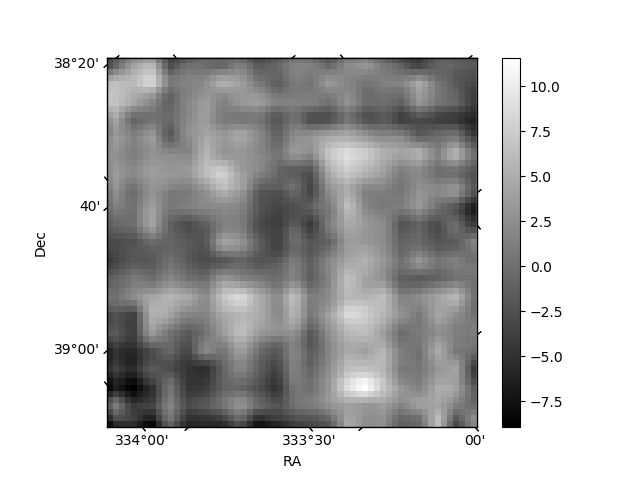
Quadrant B |
|---|---|---|---|
| Quadrant D | 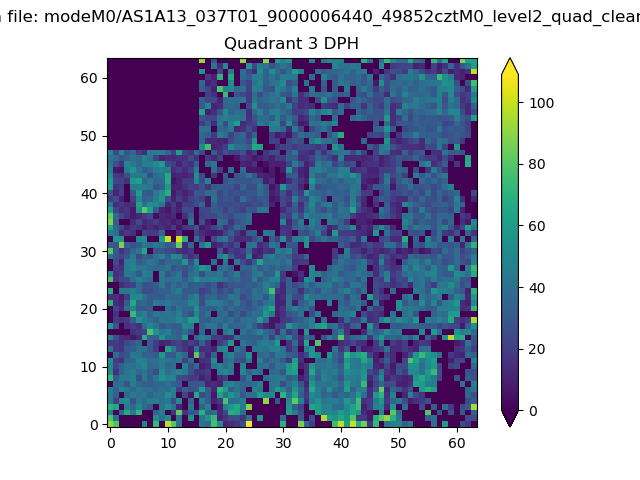 |
 |
Quadrant C |
| Plot type | Count rate plots | Images |
|---|---|---|
| Comparison with Poisson distribution Blue bars denote a histogram of data divided into 1 sec bins. Red curve is a Poisson curve with rate = median count rate of data. |
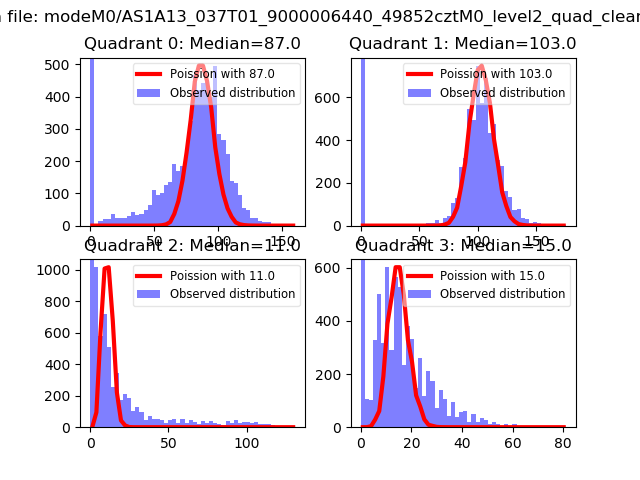 |
 |
| Quadrant-wise count rates Data is divided into 100 sec bins |
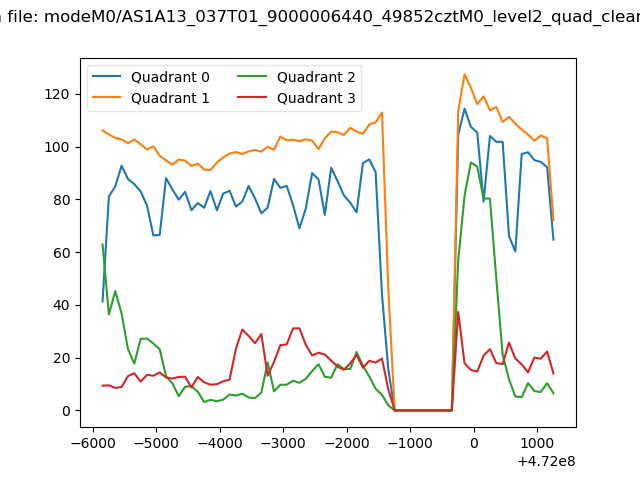 |
|
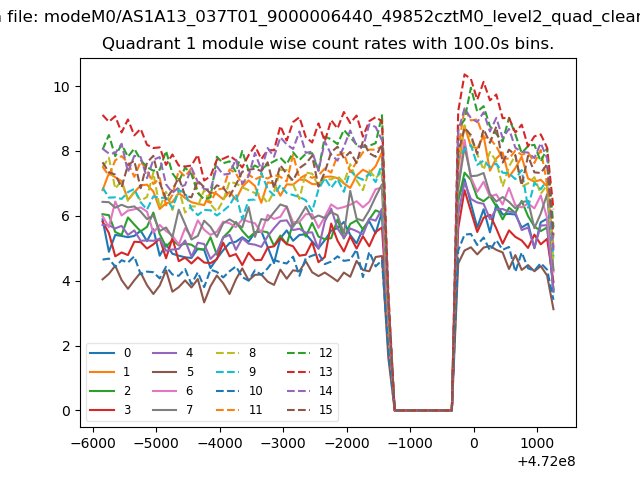
| Module-wise count rates for Quadrant A Data is divided into 100 sec bins |
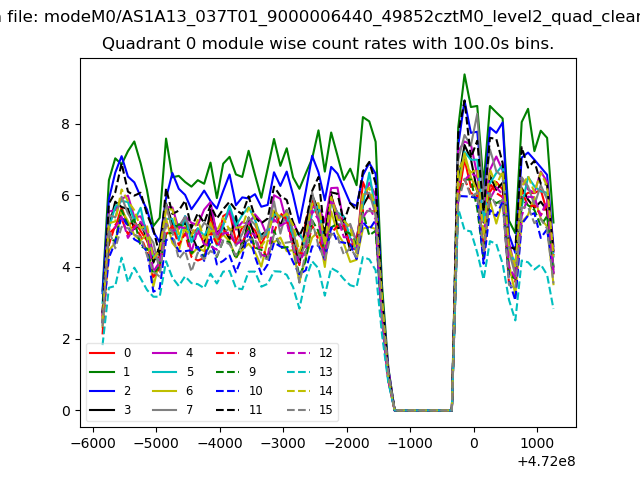 |
 |
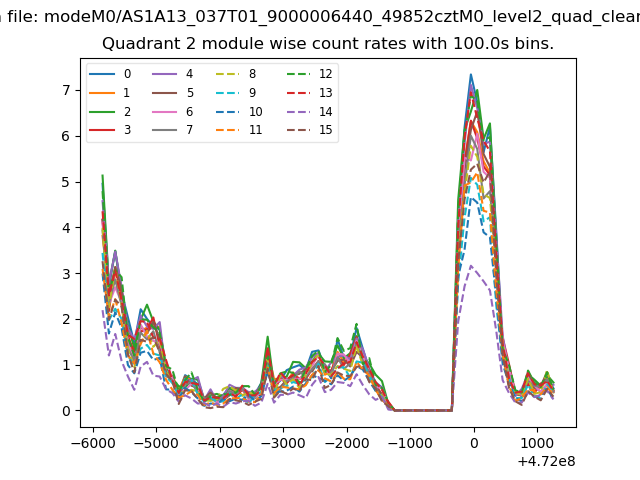
| Module-wise count rates for Quadrant B Data is divided into 100 sec bins |
 |
 |
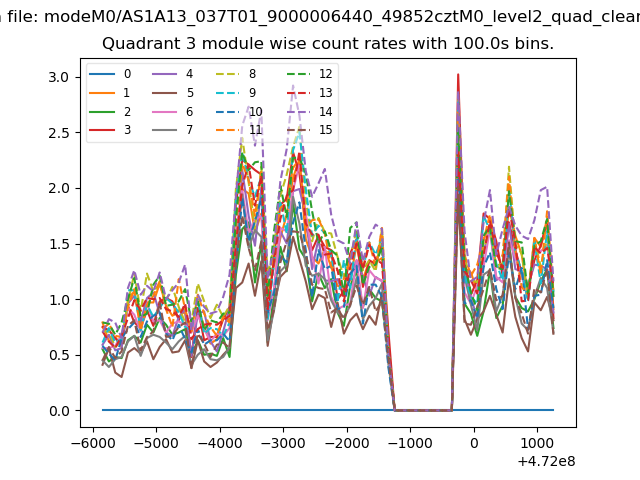
| Module-wise count rates for Quadrant C Data is divided into 100 sec bins |
 |
 |
| Module-wise count rates for Quadrant D Data is divided into 100 sec bins |
 |
 |
| Parameter | Plot |
|---|---|
| CZT HV Monitor | 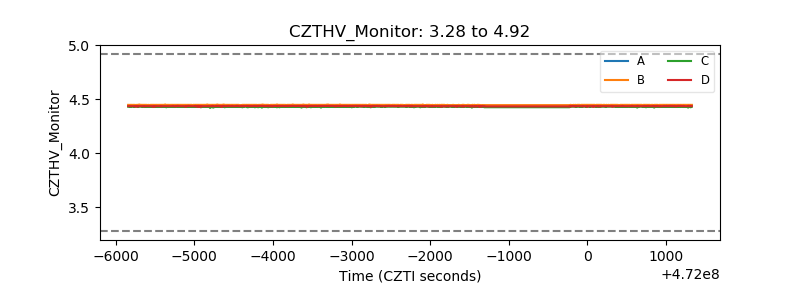 |
| D_VDD | 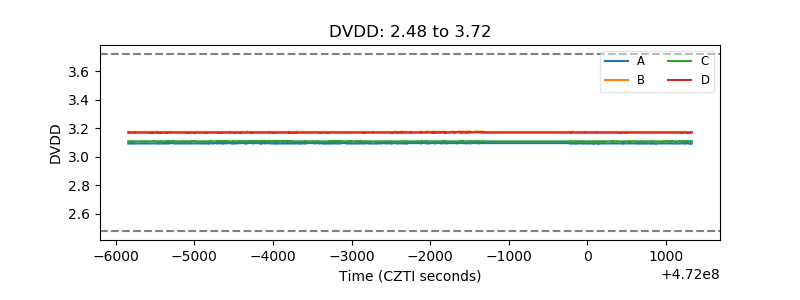 |
| Temperature 1 | 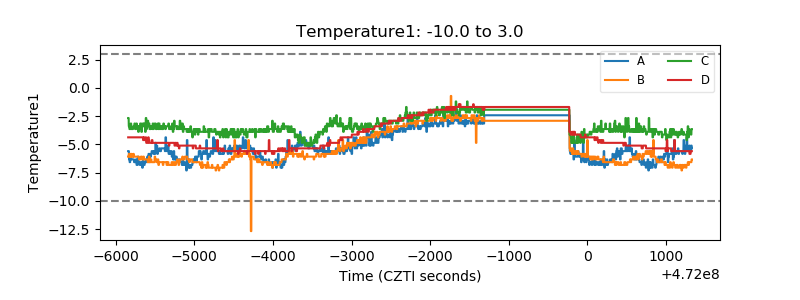 |
| Veto HV Monitor | 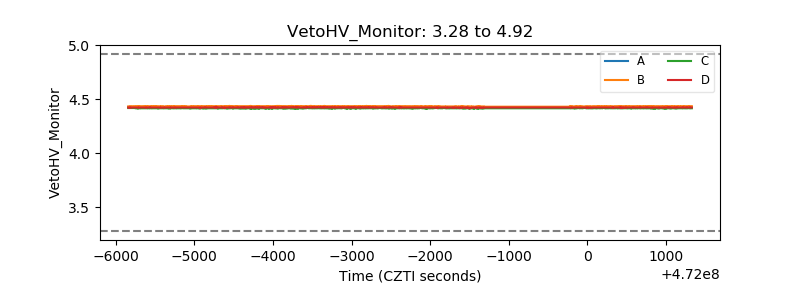 |
| Veto LLD | 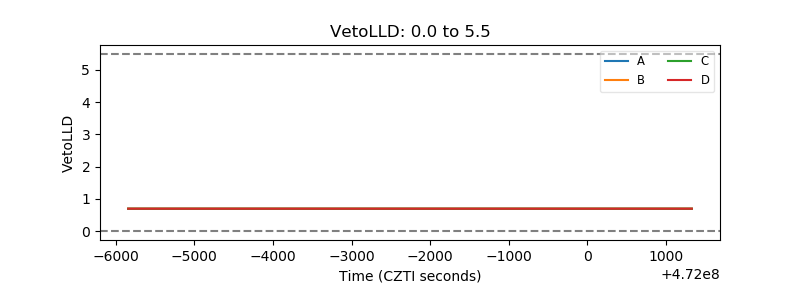 |
| Alpha Counter | 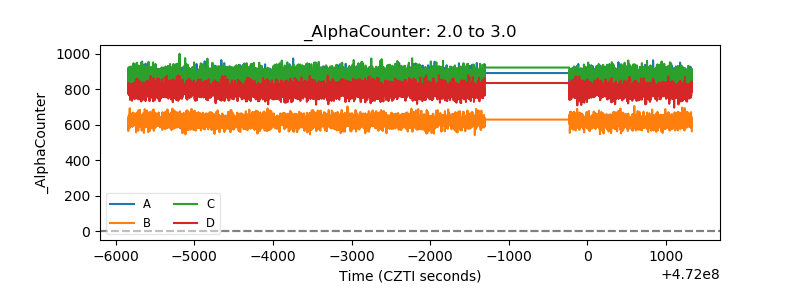 |
| _CPM_Rate | 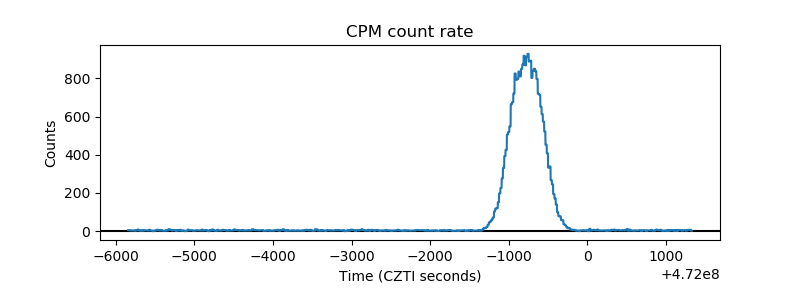 |
| CZT Counter | 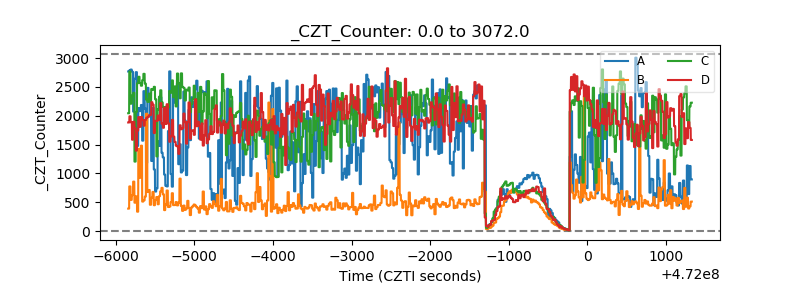 |
| +2.5 Volts monitor | 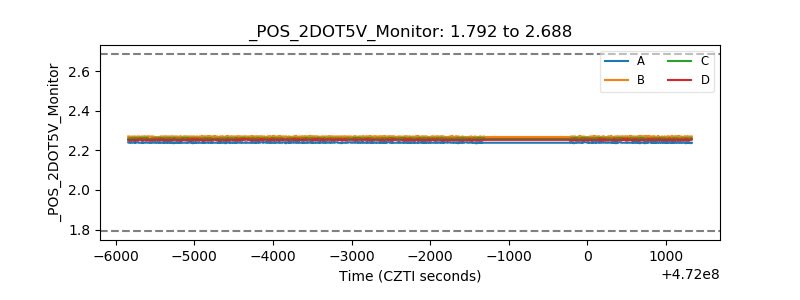 |
| +5 Volts monitor | 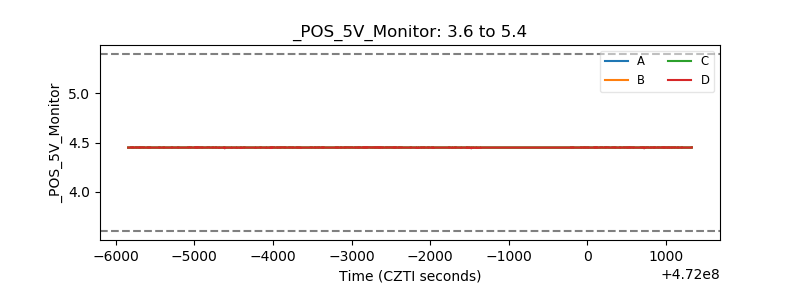 |
| _ROLL_ROT | 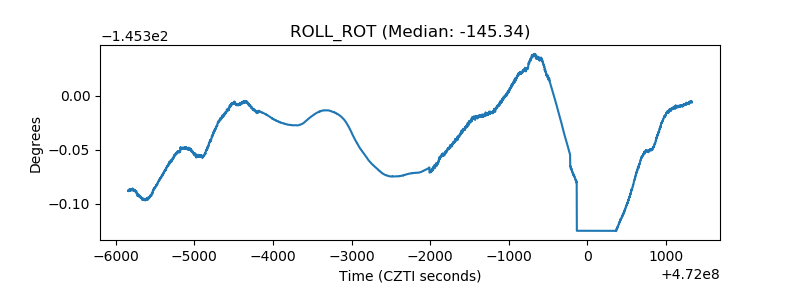 |
| _Roll_DEC | 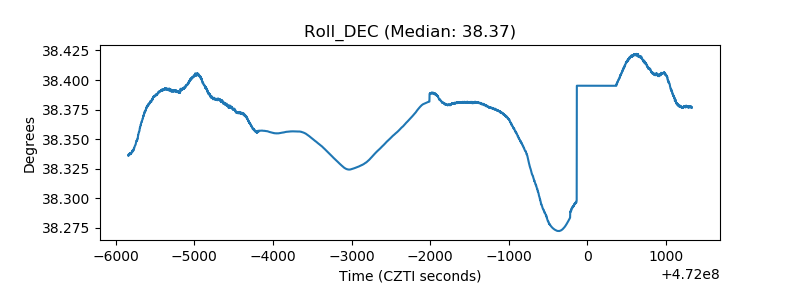 |
| _Roll_RA | 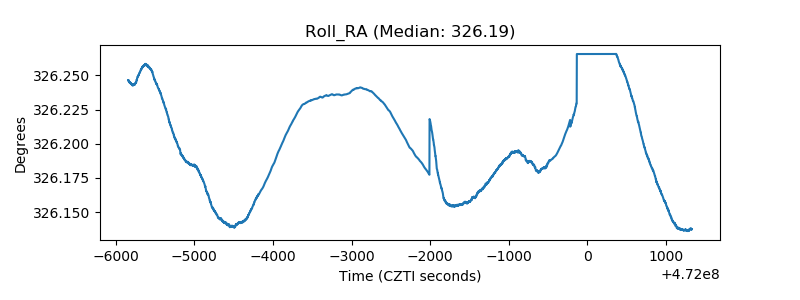 |
| Veto Counter | 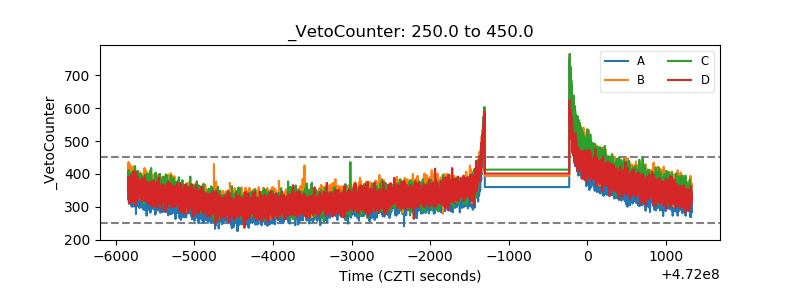 |