| Param | Original file | Final file |
|---|---|---|
| Filename | modeM0/AS1A13_037T01_9000006440_49854cztM0_level2.fits | modeM0/AS1A13_037T01_9000006440_49854cztM0_level2_quad_clean.evt |
| Size (bytes) | 1,028,540,160 | 58,236,480 |
| Size | 980.9 MB | 55.5 MB |
| Events in quadrant A | 8,203,558 | 544,884 |
| Events in quadrant B | 3,844,774 | 705,303 |
| Events in quadrant C | 12,402,799 | 62,028 |
| Events in quadrant D | 13,124,679 | 3,514 |
| Mode M9 | |||
|---|---|---|---|
| Quadrant | BADHDUFLAG | Total packets | Discarded packets |
| A | 0 | 12 | 0 |
| B | 0 | 12 | 0 |
| C | 0 | 12 | 0 |
| D | 0 | 12 | 0 |
| Mode SS | |||
|---|---|---|---|
| Quadrant | BADHDUFLAG | Total packets | Discarded packets |
| A | 0 | 130 | 0 |
| B | 0 | 130 | 0 |
| C | 0 | 130 | 0 |
| D | 0 | 130 | 0 |
| Mode M0 | |||
|---|---|---|---|
| Quadrant | BADHDUFLAG | Total packets | Discarded packets |
| A | 0 | 28855 | 1 |
| B | 0 | 15671 | 1 |
| C | 0 | 41277 | 2 |
| D | 0 | 43398 | 1 |
| Quadrant | Total seconds | Saturated seconds | Saturation percentage |
|---|---|---|---|
| A | 6413 | 1310 | 20.427257% |
| B | 6414 | 178 | 2.775179% |
| C | 6413 | 5921 | 92.328084% |
| D | 6413 | 6390 | 99.641354% |
Noise dominated data is calculated using 1-second bins in cleaned event files. If a bin has >2000 counts, and if more than 50% of those come from <1% of pixels, then it is considered to be noise-dominated and hence unusable.
| Quadrant | # 1 sec bins | Bins with >0 counts | Bins with >2000 counts | High rate bins dominated by noise | Noise dominated (total time) | Noise dominated (detector-on time) | Marked lightcurve |
|---|---|---|---|---|---|---|---|
| A | 7589 | 6414 | 1100 | 1100 | 14.49% | 17.15% | 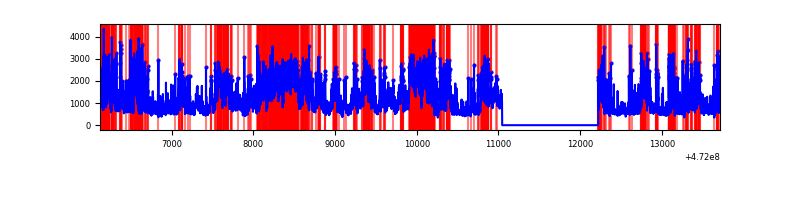 |
| B | 7590 | 6414 | 59 | 59 | 0.78% | 0.92% | 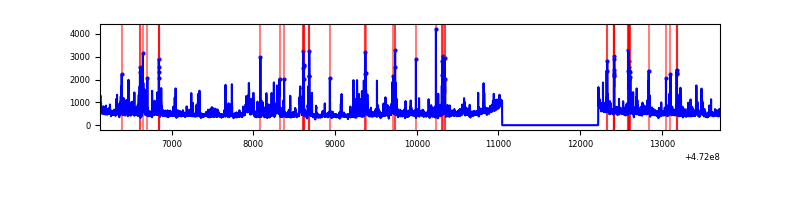 |
| C | 7588 | 6412 | 3033 | 3033 | 39.97% | 47.30% | 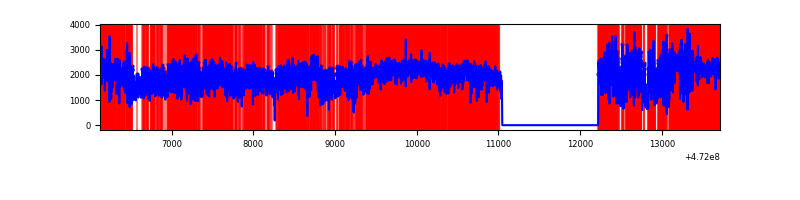 |
| D | 7588 | 6412 | 3481 | 3481 | 45.88% | 54.29% | 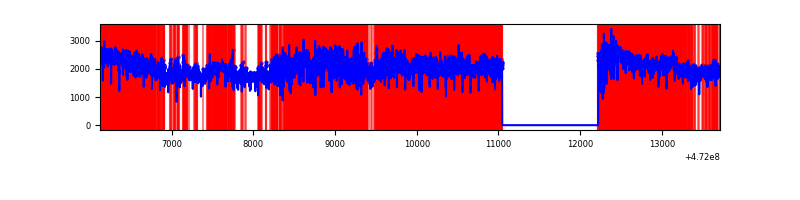 |
Top three noisy pixels from each quadrant. If the there are fewer than three noisy pixels in the level2.evt file, extra rows are filled as -1
| Pixel properties | Quadrant properties | ||||||
|---|---|---|---|---|---|---|---|
| Quadrant | DetID | PixID | Counts | Sigma | Mean | Median | Sigma |
| A | 3 | 84 | 2874134 | 16841.98 | 686 | 671 | 170.6 |
| A | 15 | 160 | 368974 | 2158.7 | 686 | 671 | 170.6 |
| A | 8 | 38 | 292735 | 1711.85 | 686 | 671 | 170.6 |
| B | 0 | 229 | 299228 | 1960.87 | 725 | 704 | 152.2 |
| B | 4 | 206 | 220376 | 1442.93 | 725 | 704 | 152.2 |
| B | 1 | 255 | 110603 | 721.88 | 725 | 704 | 152.2 |
| C | 15 | 189 | 3597828 | 48974.19 | 236 | 233 | 73.5 |
| C | 15 | 197 | 1242957 | 16917.25 | 236 | 233 | 73.5 |
| C | 15 | 164 | 982387 | 13370.1 | 236 | 233 | 73.5 |
| D | 7 | 61 | 6228052 | 103014.57 | 178 | 169 | 60.5 |
| D | 8 | 129 | 2231097 | 36901.48 | 178 | 169 | 60.5 |
| D | 7 | 126 | 1055023 | 17448.2 | 178 | 169 | 60.5 |
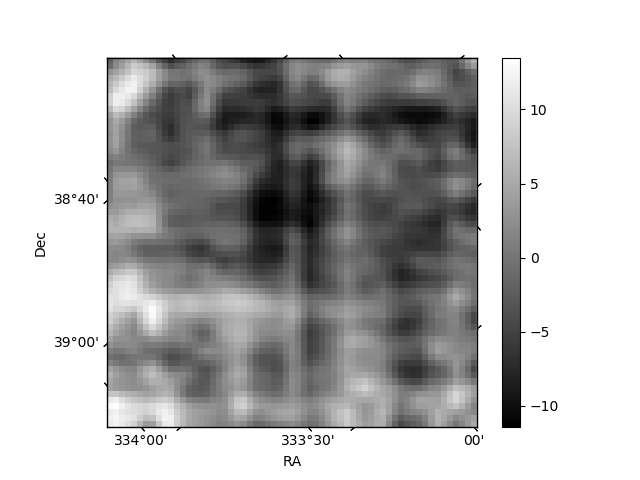
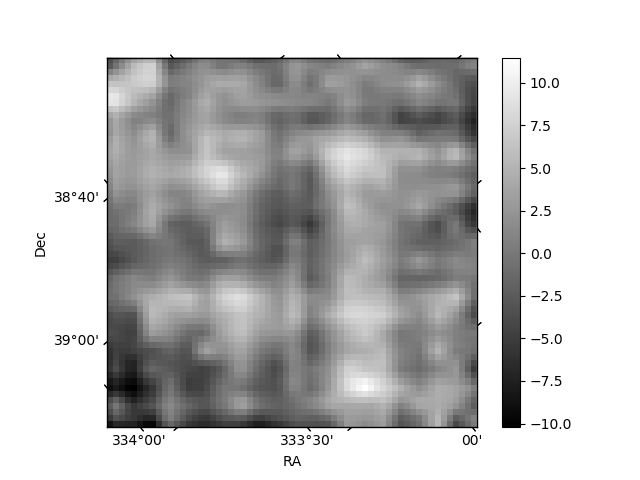
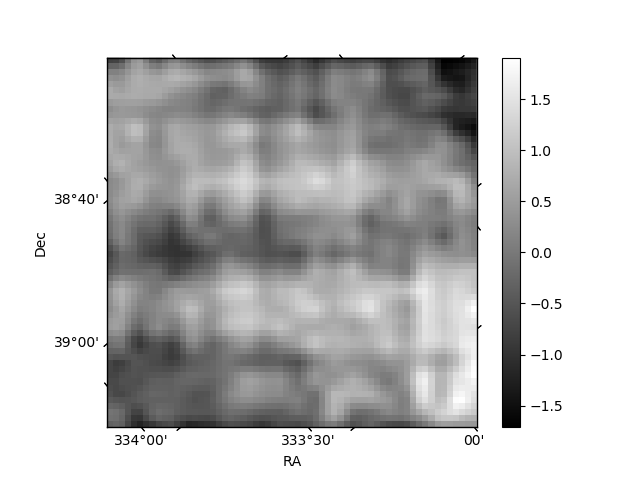
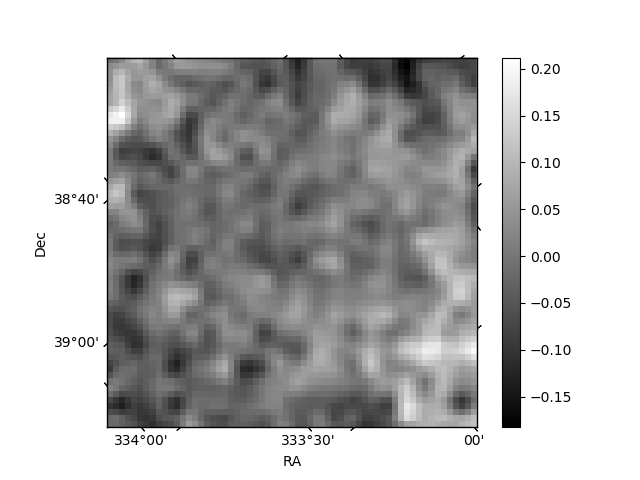
Histogram calculated using DETX and DETY for each event in the final _common_clean file
| Quadrant A | 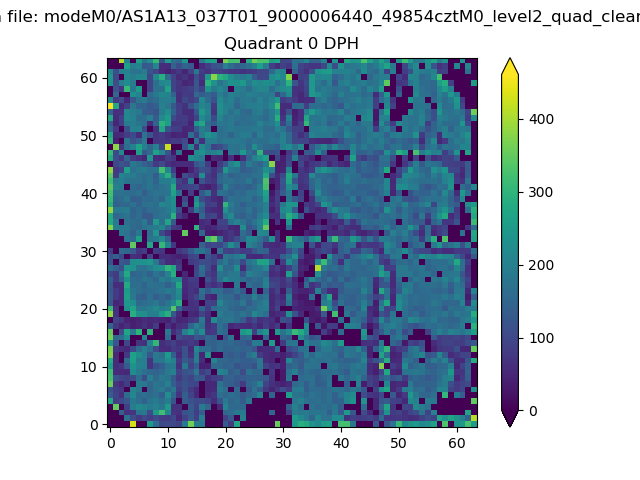 |
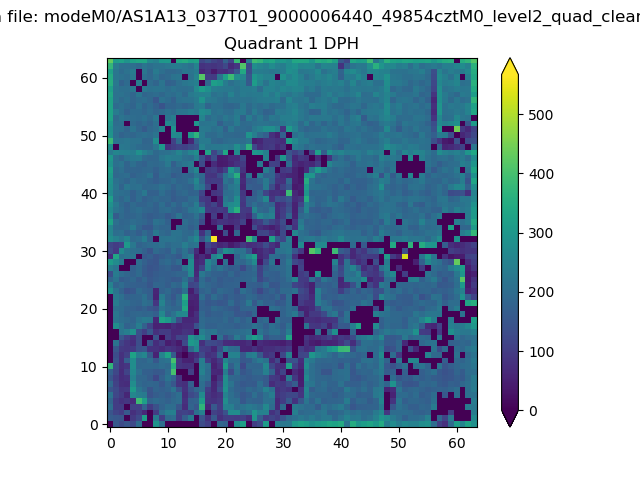 |
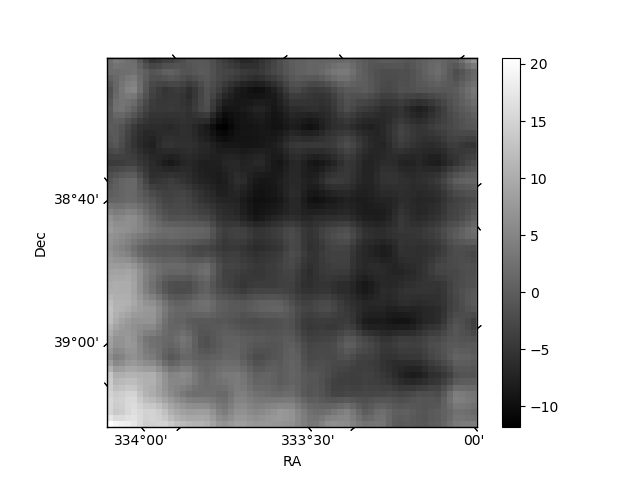
Quadrant B |
|---|---|---|---|
| Quadrant D | 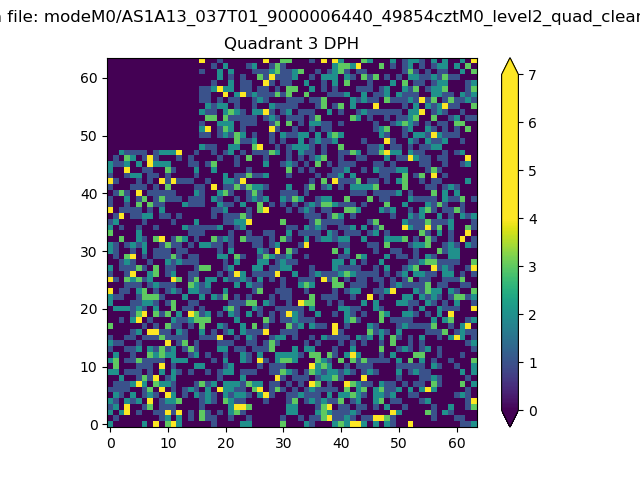 |
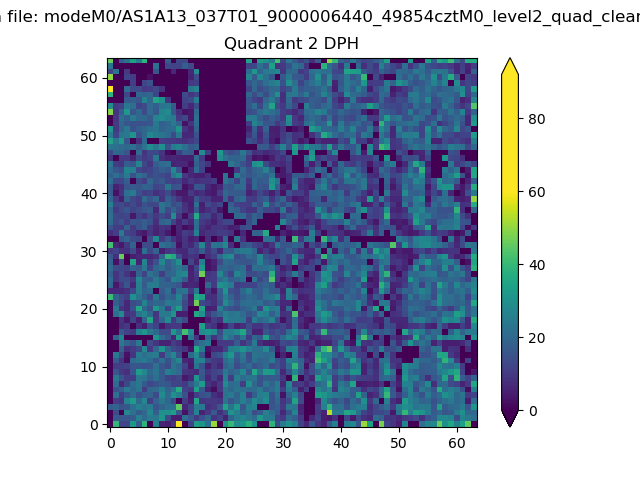 |
Quadrant C |
| Plot type | Count rate plots | Images |
|---|---|---|
| Comparison with Poisson distribution Blue bars denote a histogram of data divided into 1 sec bins. Red curve is a Poisson curve with rate = median count rate of data. |
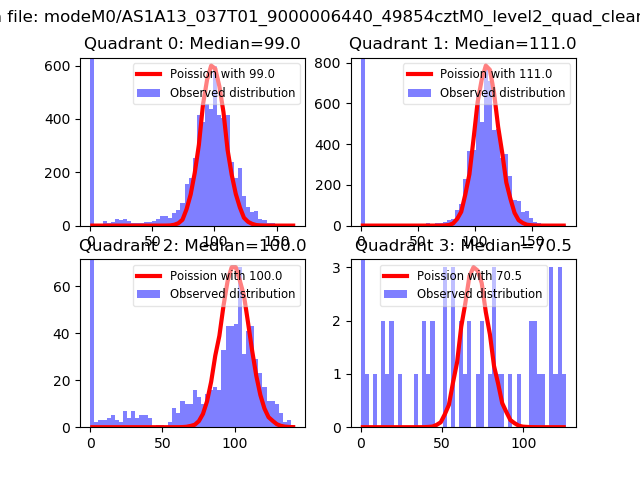 |
 |
| Quadrant-wise count rates Data is divided into 100 sec bins |
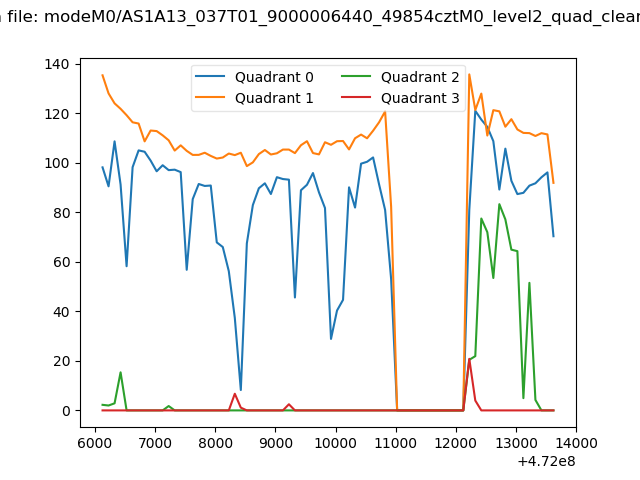 |
|
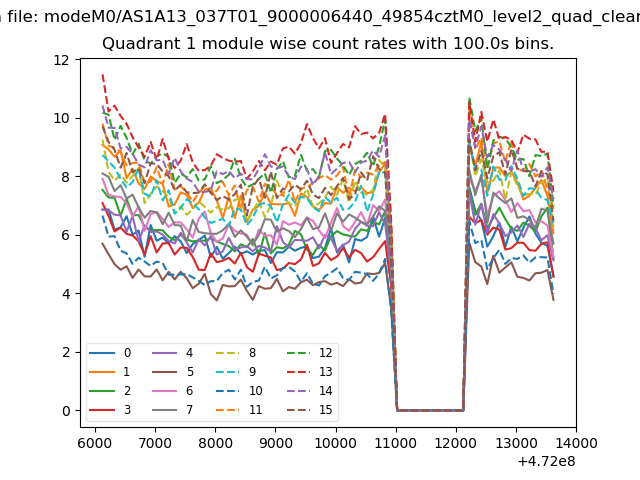
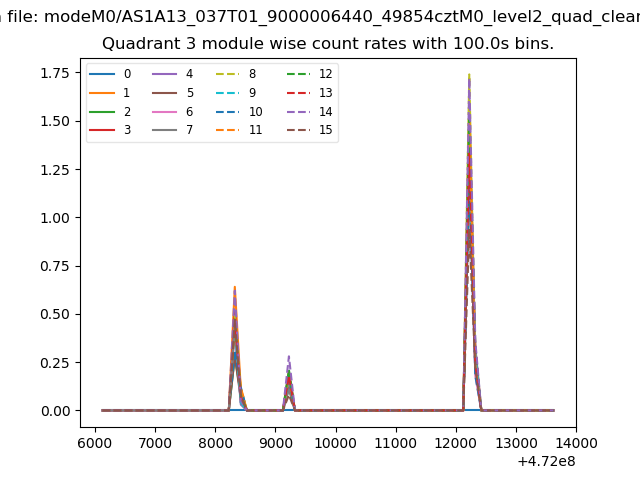
| Module-wise count rates for Quadrant A Data is divided into 100 sec bins |
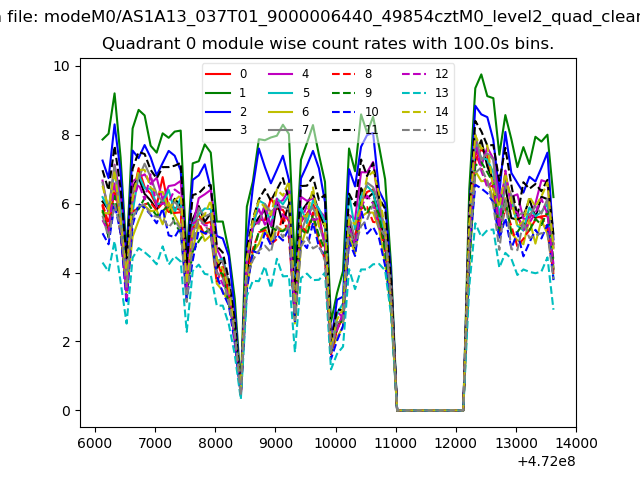 |
 |
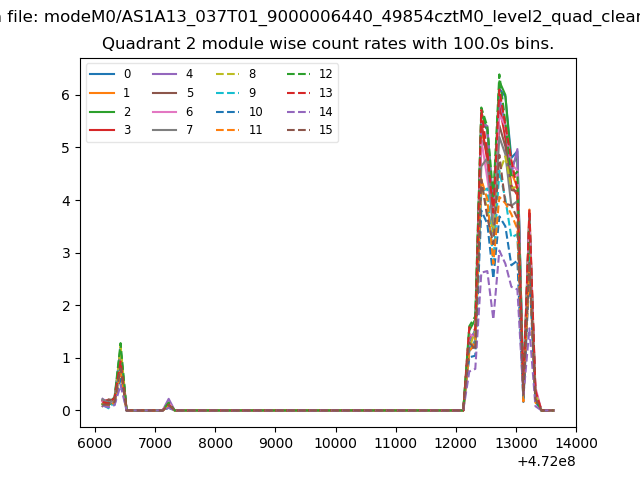
| Module-wise count rates for Quadrant B Data is divided into 100 sec bins |
 |
 |
| Module-wise count rates for Quadrant C Data is divided into 100 sec bins |
 |
 |
| Module-wise count rates for Quadrant D Data is divided into 100 sec bins |
 |
 |
| Parameter | Plot |
|---|---|
| CZT HV Monitor | 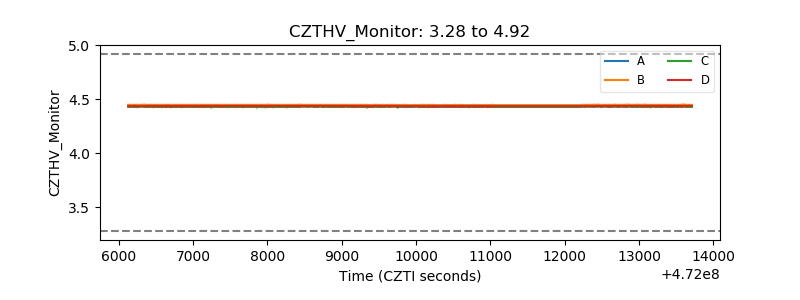 |
| D_VDD | 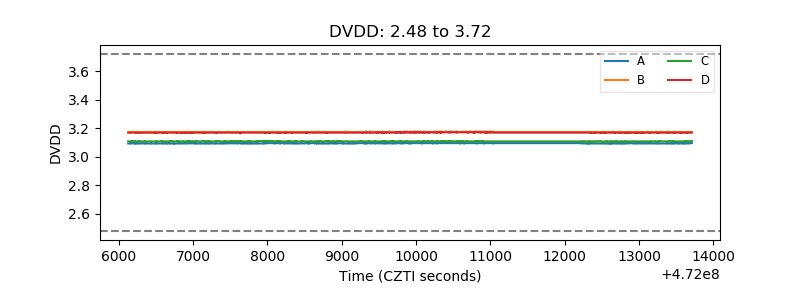 |
| Temperature 1 | 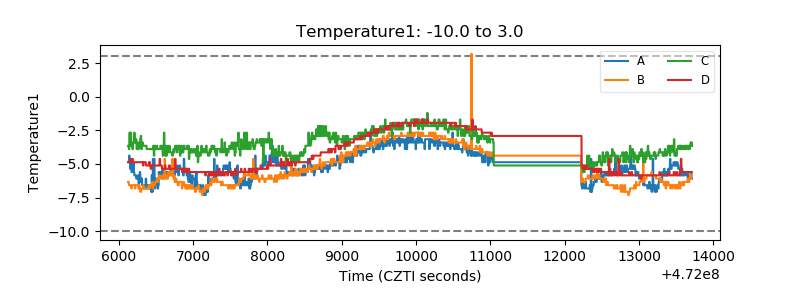 |
| Veto HV Monitor | 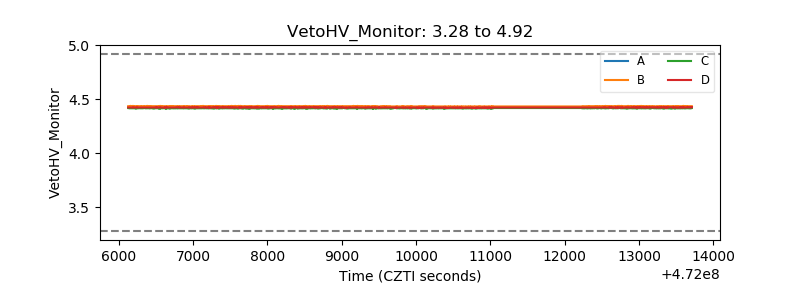 |
| Veto LLD | 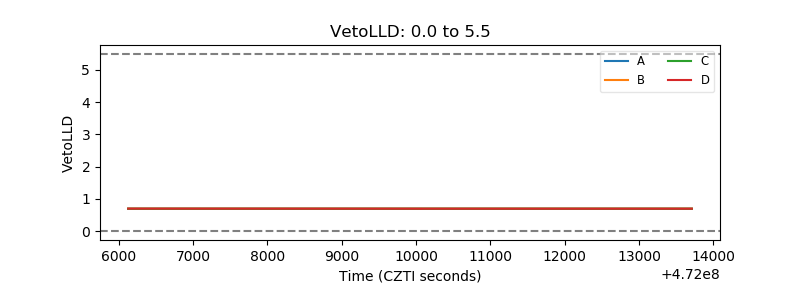 |
| Alpha Counter | 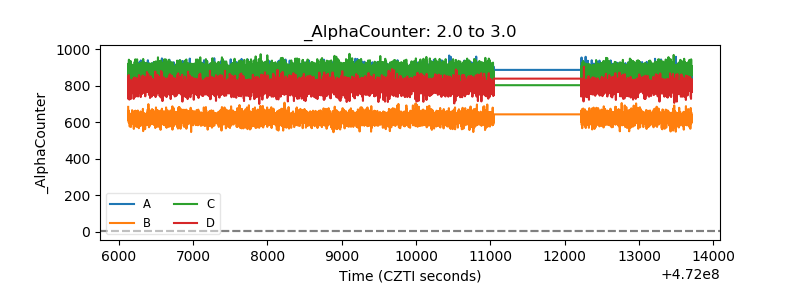 |
| _CPM_Rate | 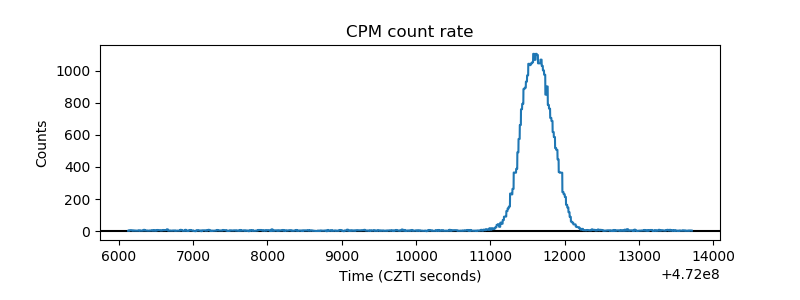 |
| CZT Counter | 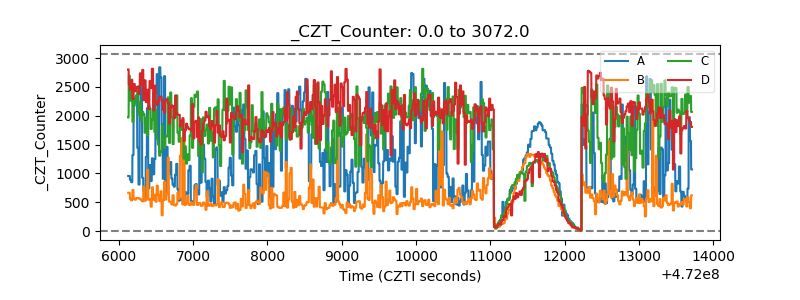 |
| +2.5 Volts monitor | 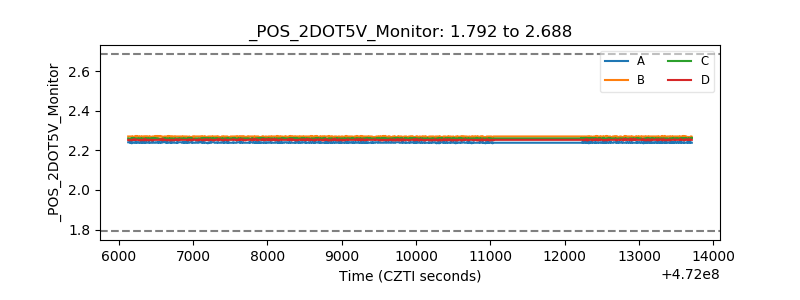 |
| +5 Volts monitor | 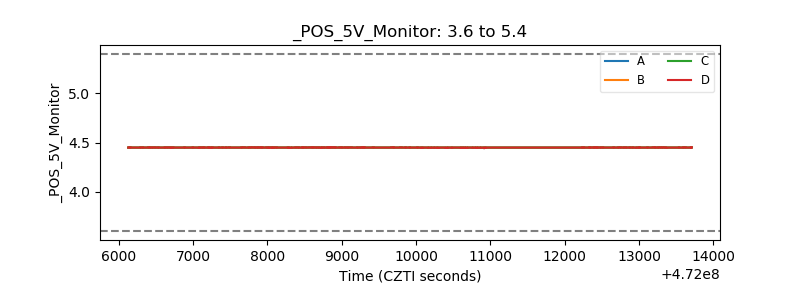 |
| _ROLL_ROT | 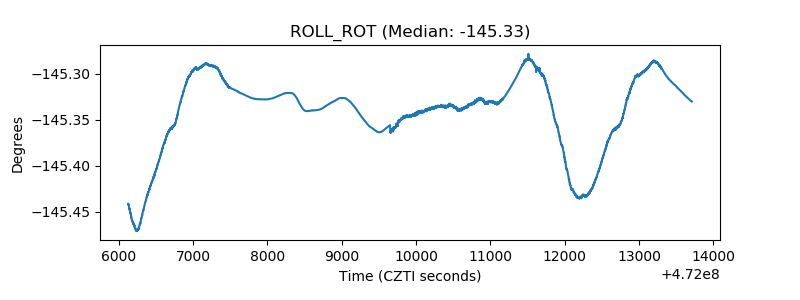 |
| _Roll_DEC | 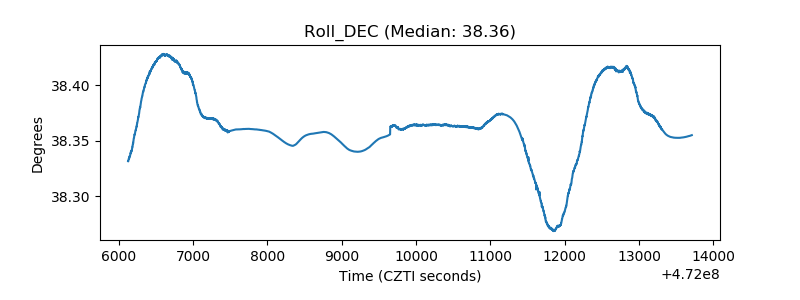 |
| _Roll_RA | 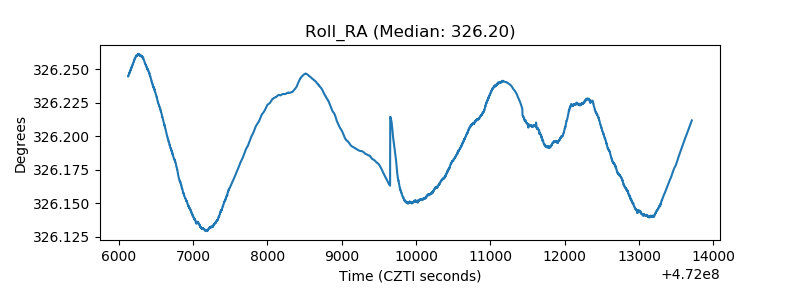 |
| Veto Counter | 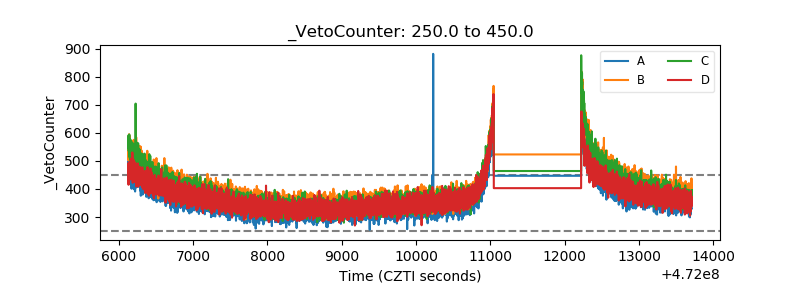 |