| Param | Original file | Final file |
|---|---|---|
| Filename | modeM0/AS1A13_037T01_9000006440_49855cztM0_level2.fits | modeM0/AS1A13_037T01_9000006440_49855cztM0_level2_quad_clean.evt |
| Size (bytes) | 988,845,120 | 57,110,400 |
| Size | 943.0 MB | 54.5 MB |
| Events in quadrant A | 6,693,180 | 564,652 |
| Events in quadrant B | 4,023,145 | 669,548 |
| Events in quadrant C | 12,500,273 | 50,823 |
| Events in quadrant D | 12,901,190 | 6,707 |
| Mode M9 | |||
|---|---|---|---|
| Quadrant | BADHDUFLAG | Total packets | Discarded packets |
| A | 0 | 11 | 0 |
| B | 0 | 11 | 0 |
| C | 0 | 11 | 0 |
| D | 0 | 11 | 0 |
| Mode SS | |||
|---|---|---|---|
| Quadrant | BADHDUFLAG | Total packets | Discarded packets |
| A | 0 | 128 | 0 |
| B | 0 | 128 | 0 |
| C | 0 | 128 | 0 |
| D | 0 | 128 | 0 |
| Mode M0 | |||
|---|---|---|---|
| Quadrant | BADHDUFLAG | Total packets | Discarded packets |
| A | 0 | 24252 | 1 |
| B | 0 | 16140 | 1 |
| C | 0 | 41429 | 1 |
| D | 0 | 42600 | 2 |
| Quadrant | Total seconds | Saturated seconds | Saturation percentage |
|---|---|---|---|
| A | 6264 | 816 | 13.026820% |
| B | 6265 | 295 | 4.708699% |
| C | 6265 | 5843 | 93.264166% |
| D | 6264 | 6208 | 99.106003% |
Noise dominated data is calculated using 1-second bins in cleaned event files. If a bin has >2000 counts, and if more than 50% of those come from <1% of pixels, then it is considered to be noise-dominated and hence unusable.
| Quadrant | # 1 sec bins | Bins with >0 counts | Bins with >2000 counts | High rate bins dominated by noise | Noise dominated (total time) | Noise dominated (detector-on time) | Marked lightcurve |
|---|---|---|---|---|---|---|---|
| A | 7409 | 6265 | 658 | 658 | 8.88% | 10.50% | 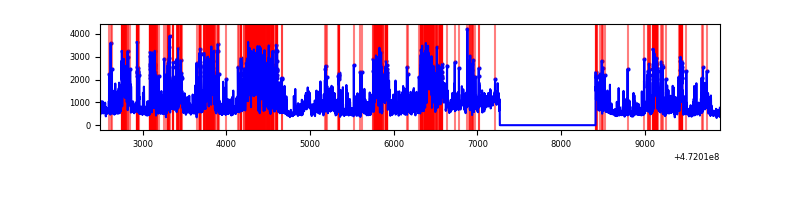 |
| B | 7410 | 6265 | 101 | 101 | 1.36% | 1.61% | 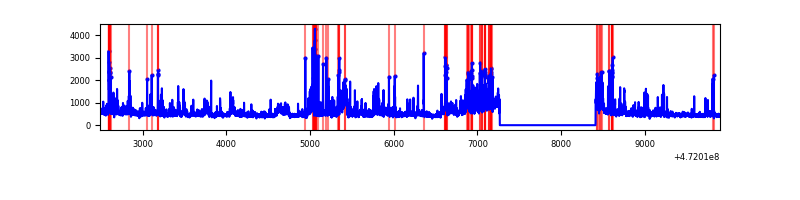 |
| C | 7409 | 6264 | 3460 | 3460 | 46.70% | 55.24% | 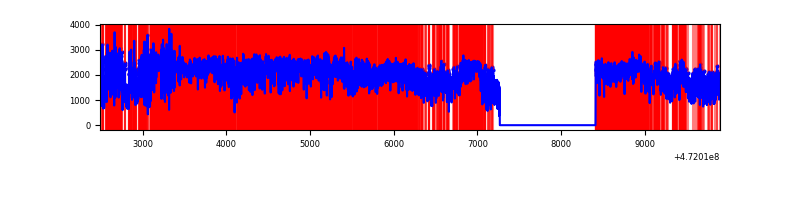 |
| D | 7408 | 6263 | 3805 | 3805 | 51.36% | 60.75% | 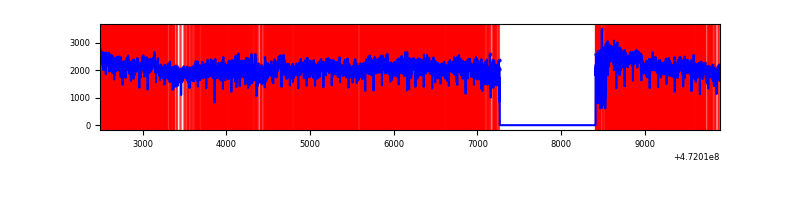 |
Top three noisy pixels from each quadrant. If the there are fewer than three noisy pixels in the level2.evt file, extra rows are filled as -1
| Pixel properties | Quadrant properties | ||||||
|---|---|---|---|---|---|---|---|
| Quadrant | DetID | PixID | Counts | Sigma | Mean | Median | Sigma |
| A | 3 | 84 | 1734324 | 10153.92 | 687 | 673 | 170.7 |
| A | 3 | 130 | 334114 | 1952.95 | 687 | 673 | 170.7 |
| A | 8 | 38 | 240296 | 1403.46 | 687 | 673 | 170.7 |
| B | 0 | 229 | 364417 | 2459.1 | 698 | 675 | 147.9 |
| B | 4 | 206 | 258784 | 1744.96 | 698 | 675 | 147.9 |
| B | 10 | 43 | 168355 | 1133.61 | 698 | 675 | 147.9 |
| C | 15 | 189 | 2560998 | 48478.2 | 172 | 171 | 52.8 |
| C | 4 | 111 | 2182553 | 41313.98 | 172 | 171 | 52.8 |
| C | 15 | 230 | 1628315 | 30821.88 | 172 | 171 | 52.8 |
| D | 7 | 61 | 6918770 | 120189.46 | 157 | 149 | 57.6 |
| D | 8 | 129 | 1661725 | 28864.7 | 157 | 149 | 57.6 |
| D | 7 | 126 | 879107 | 15269.15 | 157 | 149 | 57.6 |
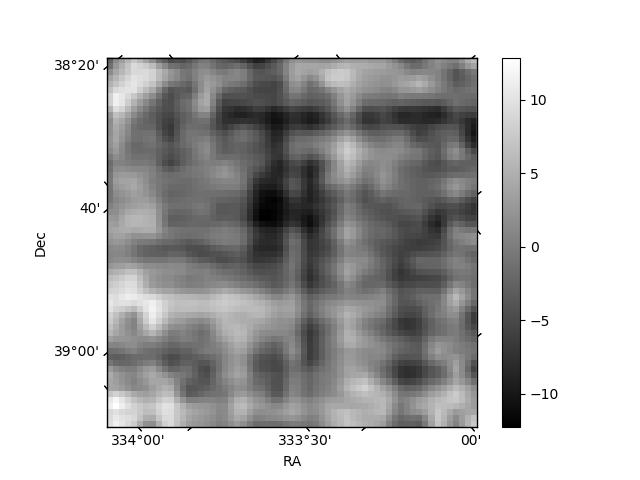
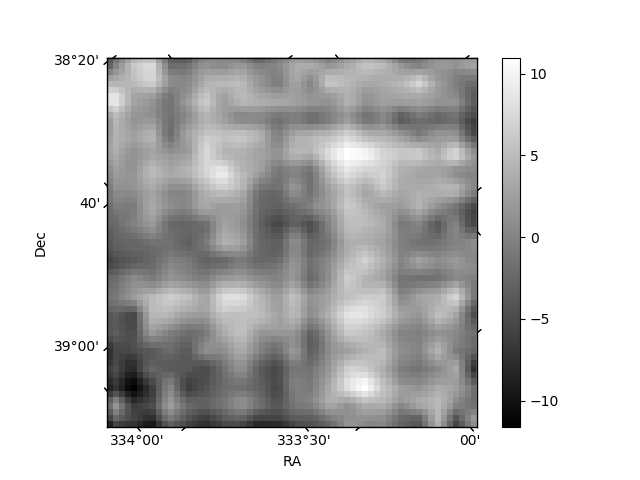
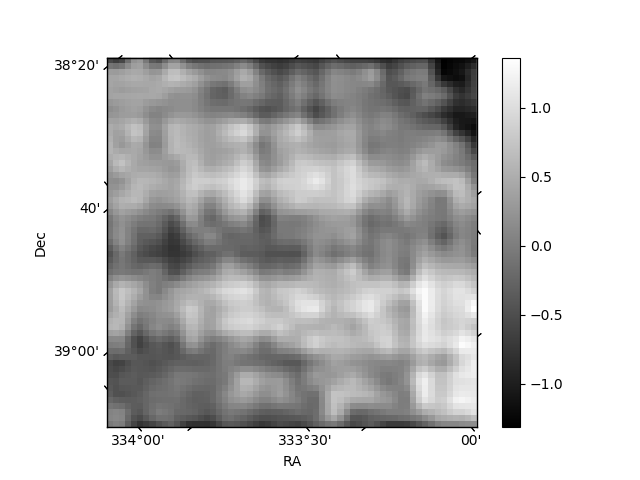
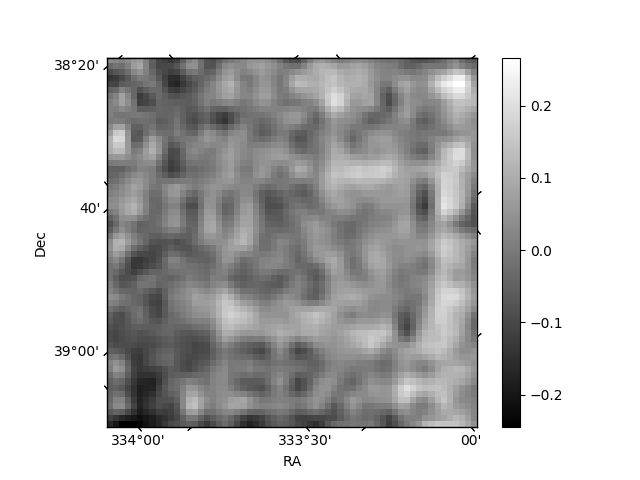
Histogram calculated using DETX and DETY for each event in the final _common_clean file
| Quadrant A | 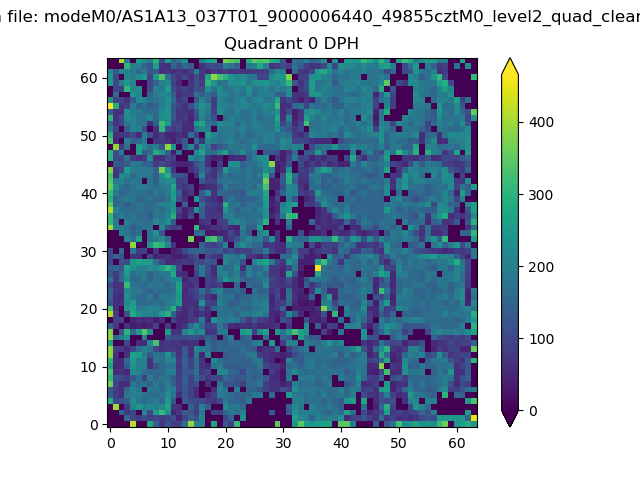 |
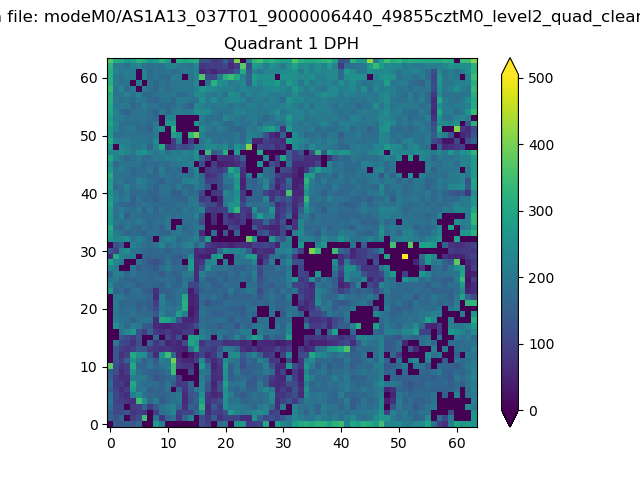 |
Quadrant B |
|---|---|---|---|
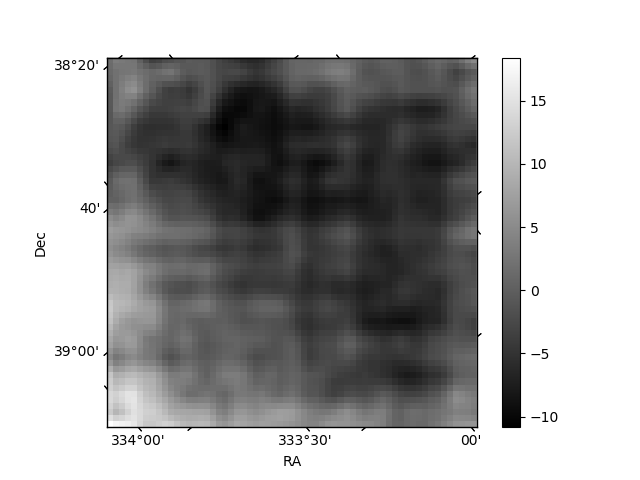
| Quadrant D | 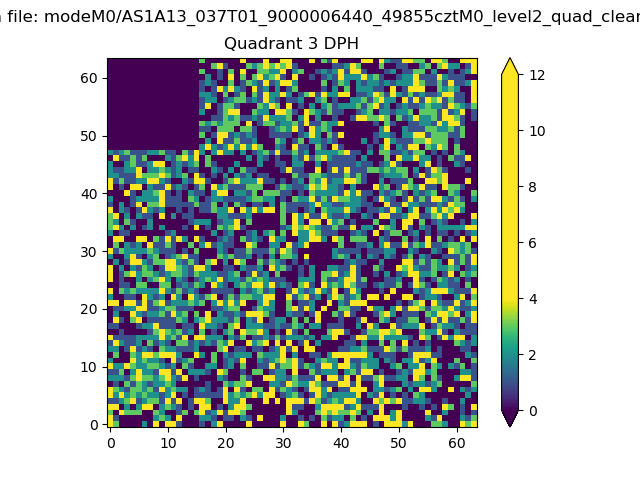 |
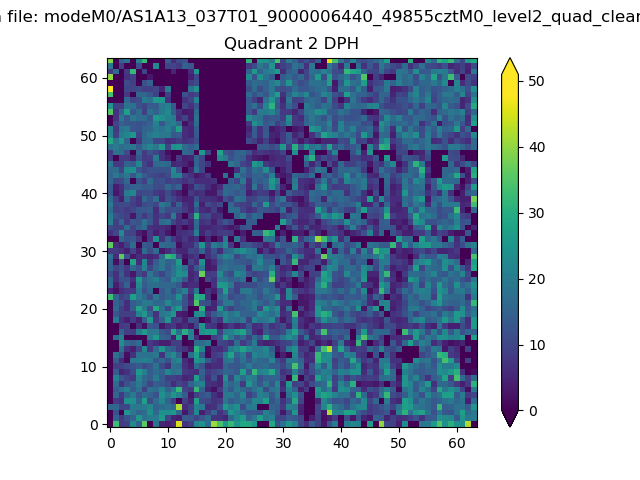 |
Quadrant C |
| Plot type | Count rate plots | Images |
|---|---|---|
| Comparison with Poisson distribution Blue bars denote a histogram of data divided into 1 sec bins. Red curve is a Poisson curve with rate = median count rate of data. |
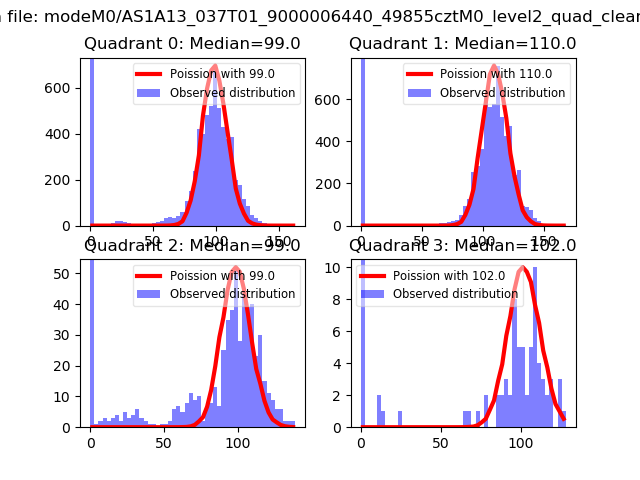 |
 |
| Quadrant-wise count rates Data is divided into 100 sec bins |
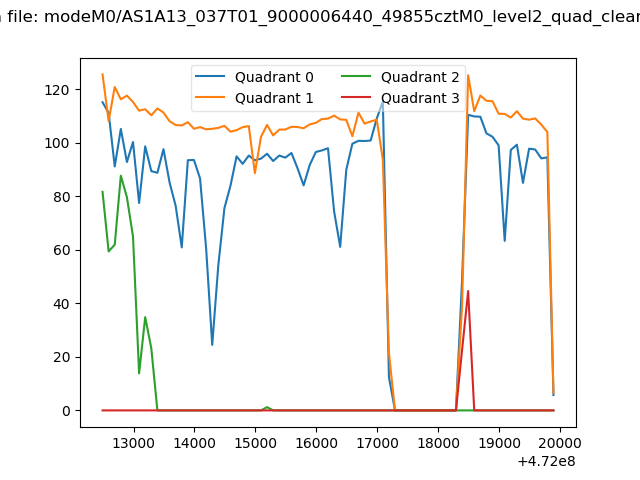 |
|
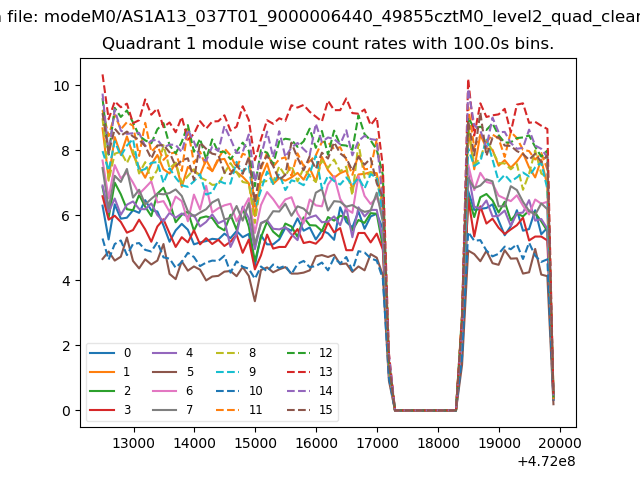
| Module-wise count rates for Quadrant A Data is divided into 100 sec bins |
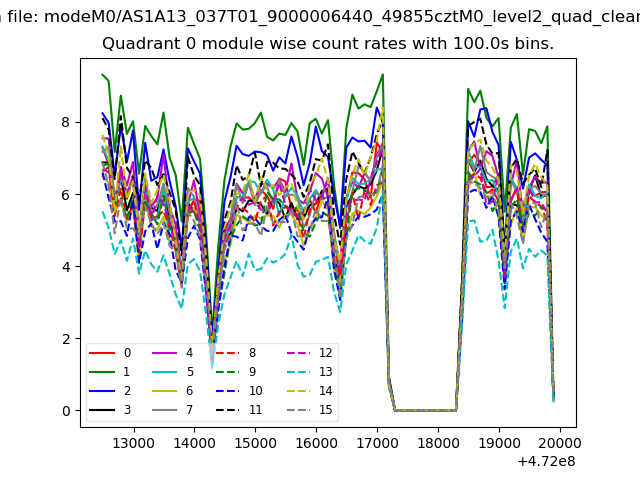 |
 |
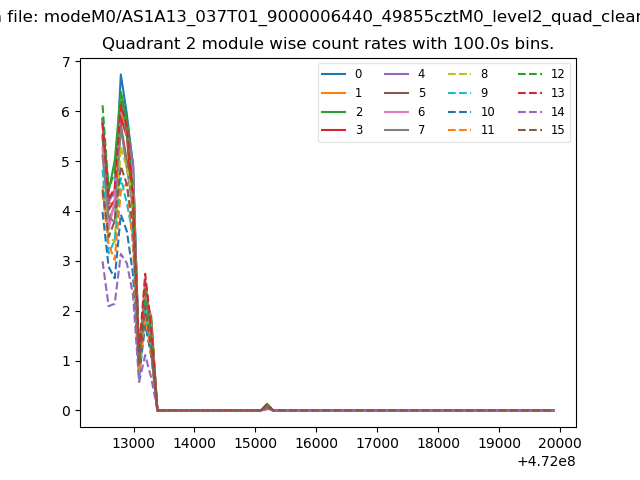
| Module-wise count rates for Quadrant B Data is divided into 100 sec bins |
 |
 |
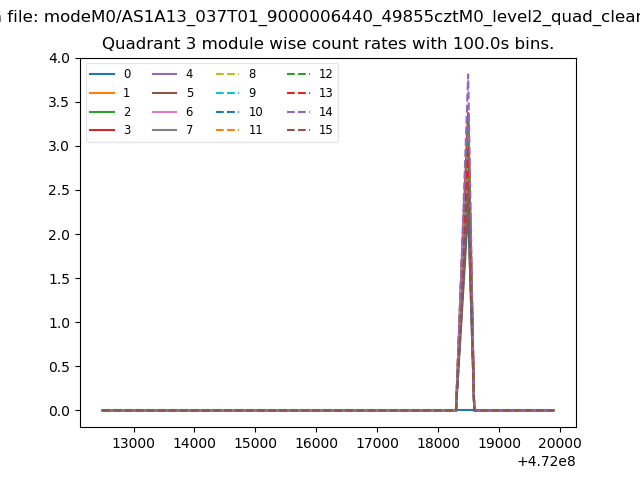
| Module-wise count rates for Quadrant C Data is divided into 100 sec bins |
 |
 |
| Module-wise count rates for Quadrant D Data is divided into 100 sec bins |
 |
 |
| Parameter | Plot |
|---|---|
| CZT HV Monitor | 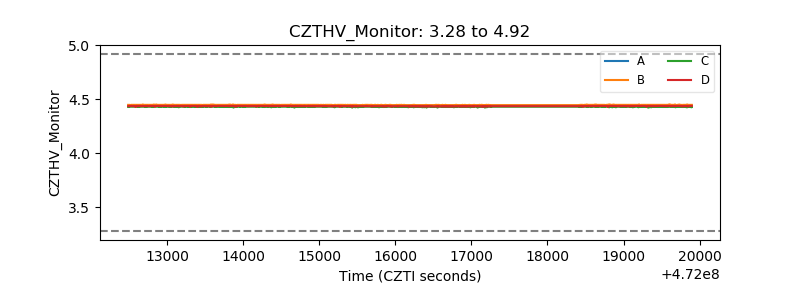 |
| D_VDD | 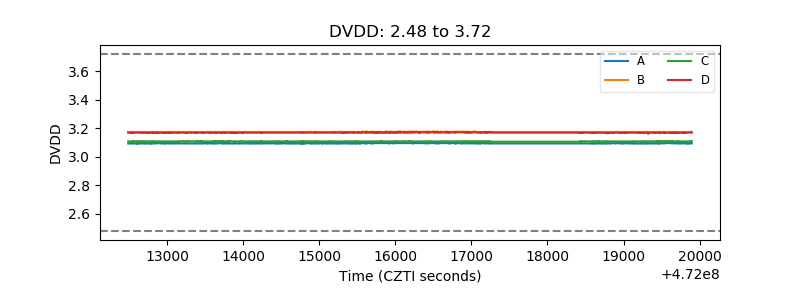 |
| Temperature 1 | 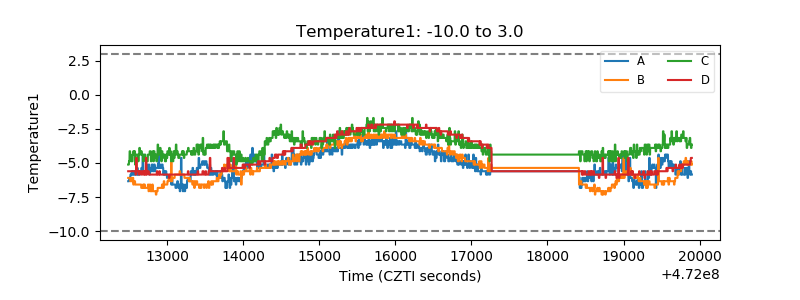 |
| Veto HV Monitor | 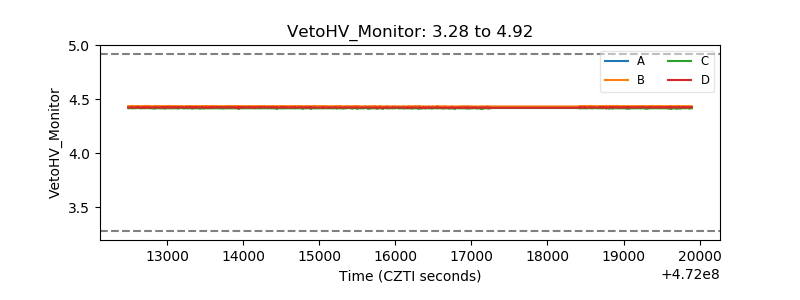 |
| Veto LLD | 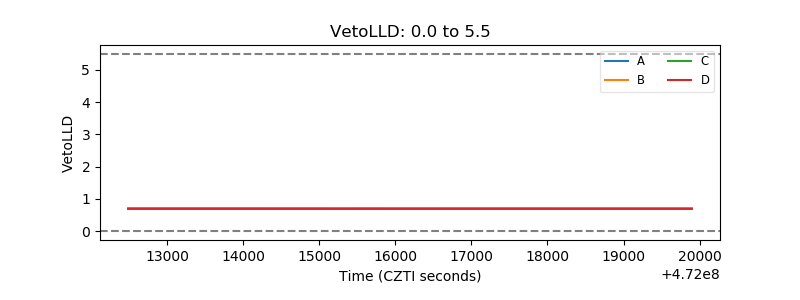 |
| Alpha Counter | 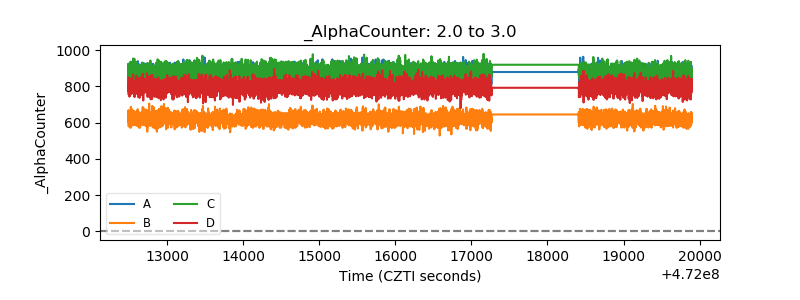 |
| _CPM_Rate | 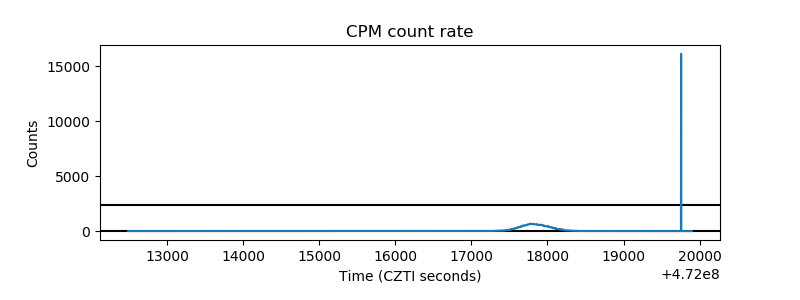 |
| CZT Counter | 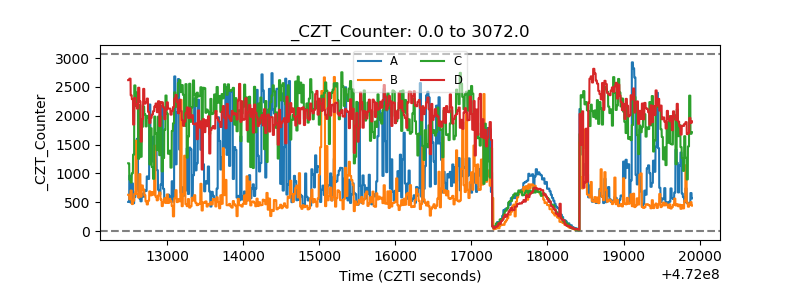 |
| +2.5 Volts monitor | 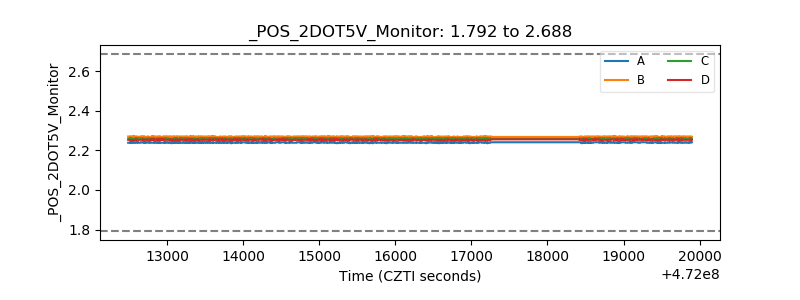 |
| +5 Volts monitor | 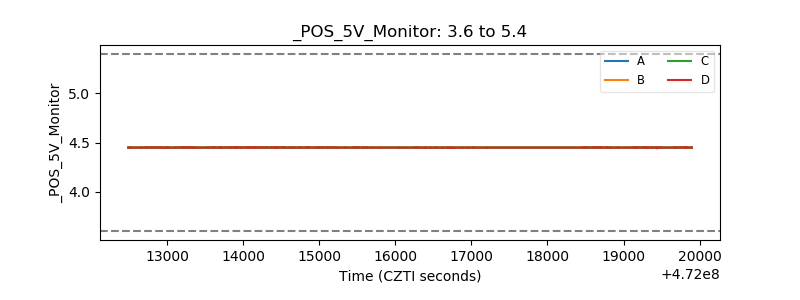 |
| _ROLL_ROT | 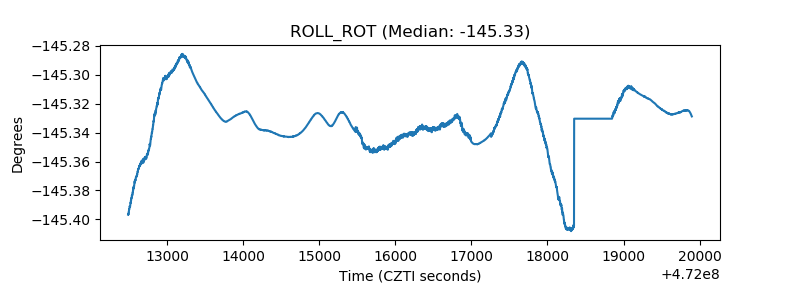 |
| _Roll_DEC | 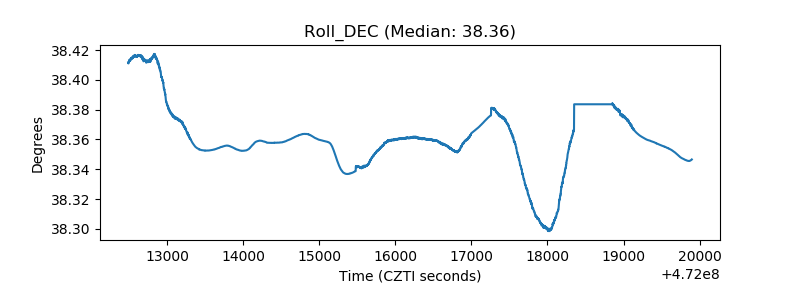 |
| _Roll_RA | 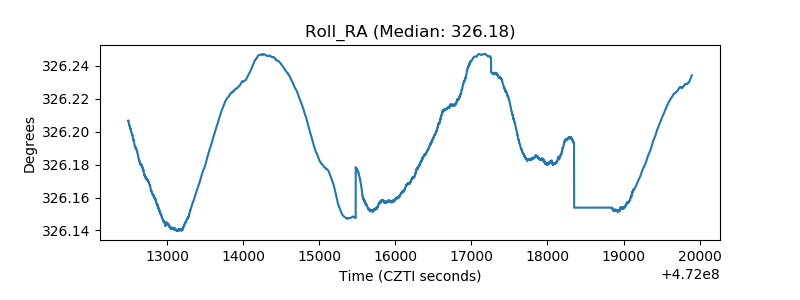 |
| Veto Counter | 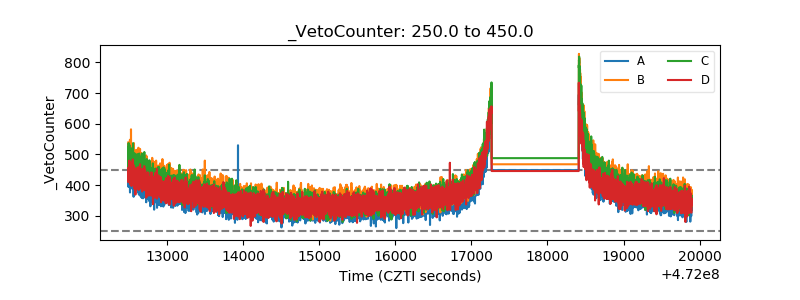 |