| Param | Original file | Final file |
|---|---|---|
| Filename | modeM0/AS1A13_037T01_9000006440_49856cztM0_level2.fits | modeM0/AS1A13_037T01_9000006440_49856cztM0_level2_quad_clean.evt |
| Size (bytes) | 920,635,200 | 60,215,040 |
| Size | 878.0 MB | 57.4 MB |
| Events in quadrant A | 6,276,611 | 581,746 |
| Events in quadrant B | 3,674,400 | 663,779 |
| Events in quadrant C | 11,235,744 | 52,897 |
| Events in quadrant D | 12,405,863 | 82,059 |
| Mode M9 | |||
|---|---|---|---|
| Quadrant | BADHDUFLAG | Total packets | Discarded packets |
| A | 0 | 10 | 0 |
| B | 0 | 10 | 0 |
| C | 0 | 10 | 0 |
| D | 0 | 10 | 0 |
| Mode SS | |||
|---|---|---|---|
| Quadrant | BADHDUFLAG | Total packets | Discarded packets |
| A | 0 | 128 | 0 |
| B | 0 | 128 | 0 |
| C | 0 | 128 | 0 |
| D | 0 | 128 | 0 |
| Mode M0 | |||
|---|---|---|---|
| Quadrant | BADHDUFLAG | Total packets | Discarded packets |
| A | 0 | 22978 | 0 |
| B | 0 | 15247 | 0 |
| C | 0 | 37730 | 0 |
| D | 0 | 41176 | 0 |
| Quadrant | Total seconds | Saturated seconds | Saturation percentage |
|---|---|---|---|
| A | 6246 | 759 | 12.151777% |
| B | 6246 | 278 | 4.450849% |
| C | 6246 | 6246 | 100.000000% |
| D | 6247 | 6245 | 99.967985% |
Noise dominated data is calculated using 1-second bins in cleaned event files. If a bin has >2000 counts, and if more than 50% of those come from <1% of pixels, then it is considered to be noise-dominated and hence unusable.
| Quadrant | # 1 sec bins | Bins with >0 counts | Bins with >2000 counts | High rate bins dominated by noise | Noise dominated (total time) | Noise dominated (detector-on time) | Marked lightcurve |
|---|---|---|---|---|---|---|---|
| A | 7271 | 6246 | 567 | 567 | 7.80% | 9.08% | 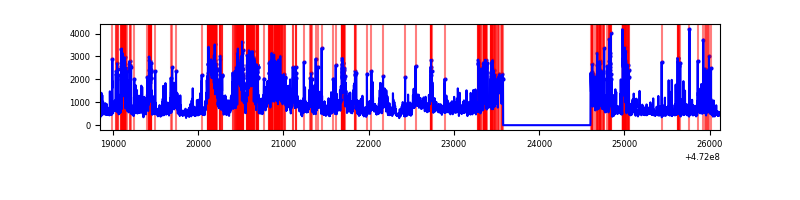 |
| B | 7271 | 6246 | 96 | 96 | 1.32% | 1.54% | 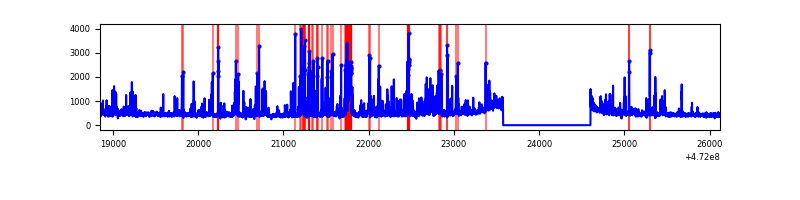 |
| C | 7270 | 6245 | 2192 | 2192 | 30.15% | 35.10% | 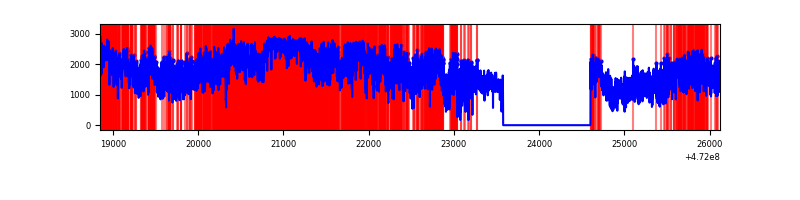 |
| D | 7271 | 6246 | 2731 | 2731 | 37.56% | 43.72% | 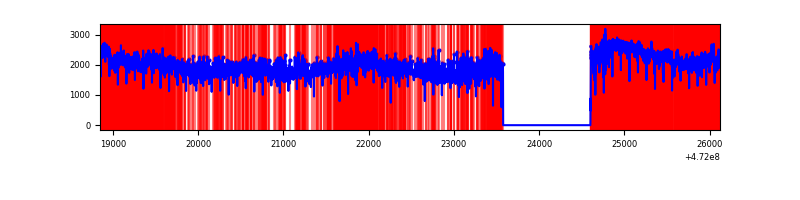 |
Top three noisy pixels from each quadrant. If the there are fewer than three noisy pixels in the level2.evt file, extra rows are filled as -1
| Pixel properties | Quadrant properties | ||||||
|---|---|---|---|---|---|---|---|
| Quadrant | DetID | PixID | Counts | Sigma | Mean | Median | Sigma |
| A | 3 | 84 | 1849868 | 11289.82 | 666 | 649 | 163.8 |
| A | 4 | 4 | 306251 | 1865.76 | 666 | 649 | 163.8 |
| A | 8 | 38 | 258858 | 1576.41 | 666 | 649 | 163.8 |
| B | 4 | 206 | 437822 | 3021.83 | 686 | 665 | 144.7 |
| B | 4 | 190 | 143387 | 986.56 | 686 | 665 | 144.7 |
| B | 10 | 28 | 125419 | 862.36 | 686 | 665 | 144.7 |
| C | 15 | 230 | 3274389 | 85003.04 | 75 | 72 | 38.5 |
| C | 15 | 189 | 2122893 | 55109.58 | 75 | 72 | 38.5 |
| C | 4 | 111 | 1426569 | 37032.63 | 75 | 72 | 38.5 |
| D | 7 | 61 | 6524837 | 152507.98 | 115 | 108 | 42.8 |
| D | 8 | 129 | 2198853 | 51393.12 | 115 | 108 | 42.8 |
| D | 15 | 185 | 894007 | 20893.85 | 115 | 108 | 42.8 |
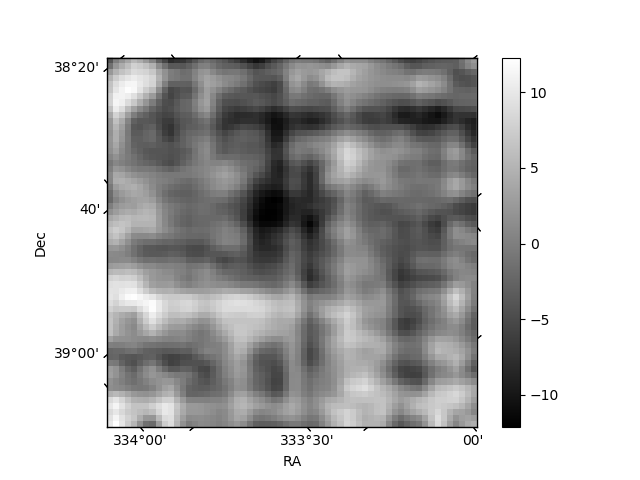
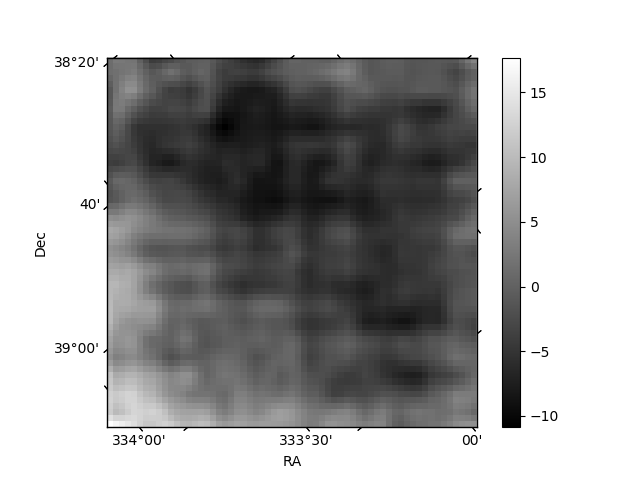
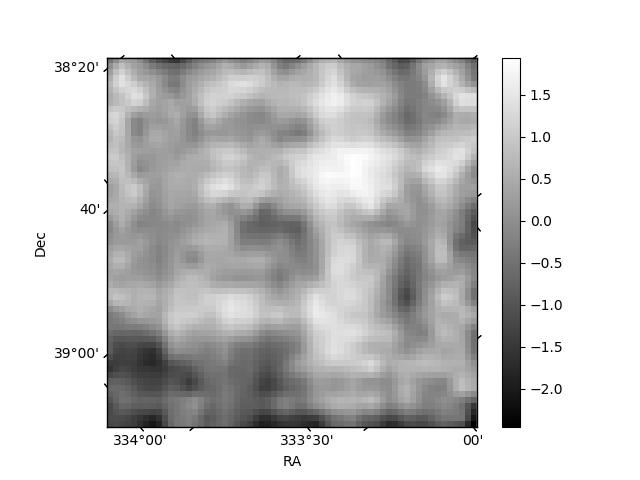
Histogram calculated using DETX and DETY for each event in the final _common_clean file
| Quadrant A | 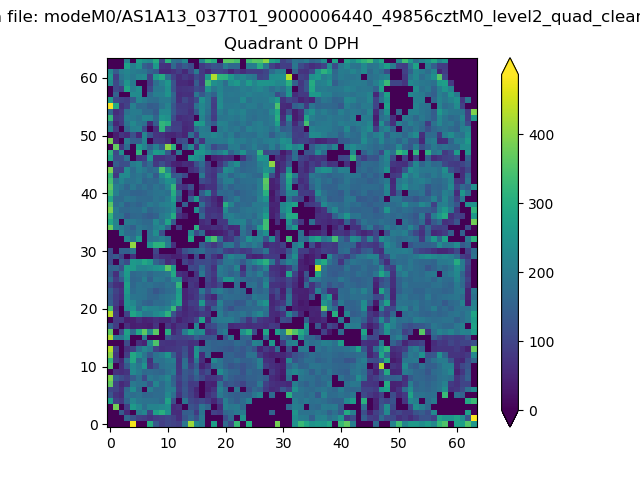 |
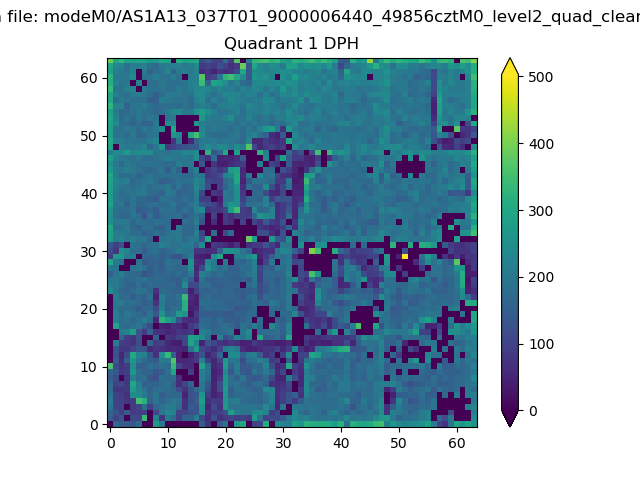 |
Quadrant B |
|---|---|---|---|
| Quadrant D | 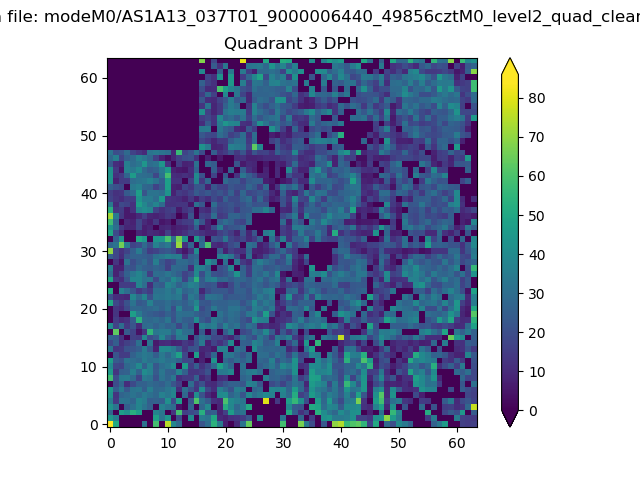 |
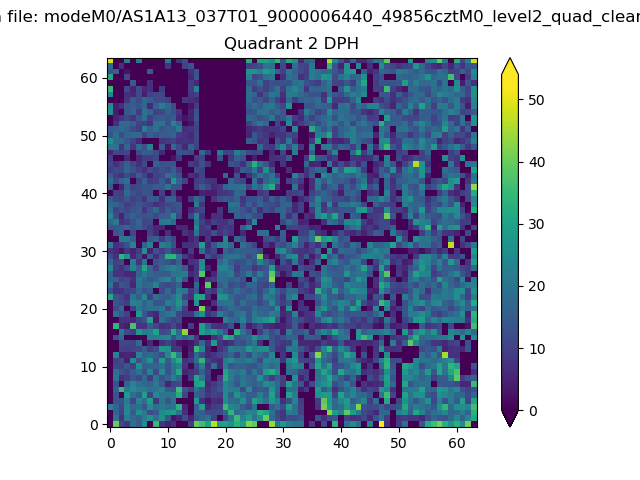 |
Quadrant C |
| Plot type | Count rate plots | Images |
|---|---|---|
| Comparison with Poisson distribution Blue bars denote a histogram of data divided into 1 sec bins. Red curve is a Poisson curve with rate = median count rate of data. |
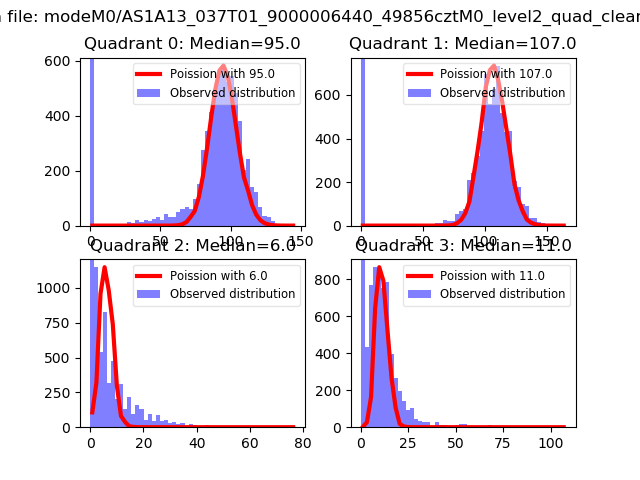 |
 |
| Quadrant-wise count rates Data is divided into 100 sec bins |
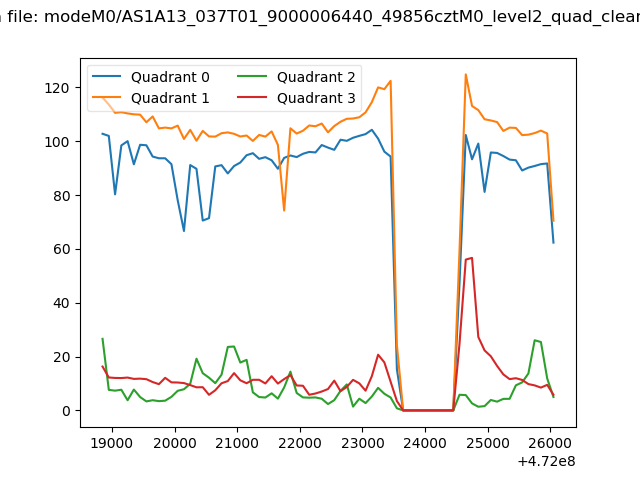 |
|
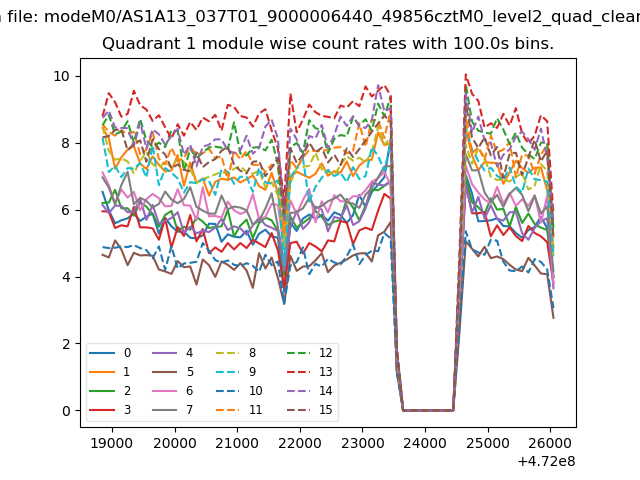
| Module-wise count rates for Quadrant A Data is divided into 100 sec bins |
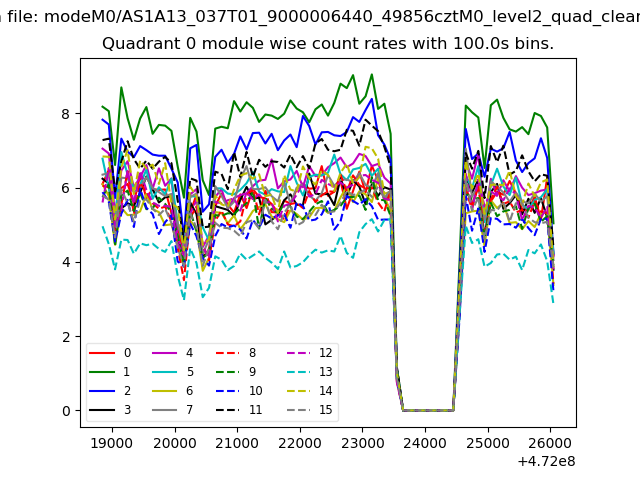 |
 |
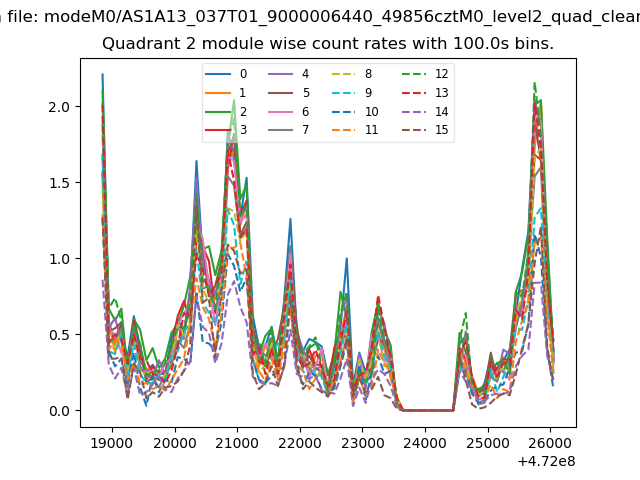
| Module-wise count rates for Quadrant B Data is divided into 100 sec bins |
 |
 |
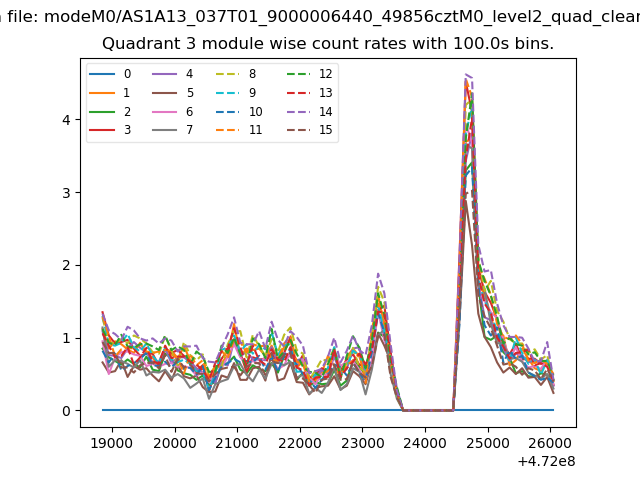
| Module-wise count rates for Quadrant C Data is divided into 100 sec bins |
 |
 |
| Module-wise count rates for Quadrant D Data is divided into 100 sec bins |
 |
 |
| Parameter | Plot |
|---|---|
| CZT HV Monitor | 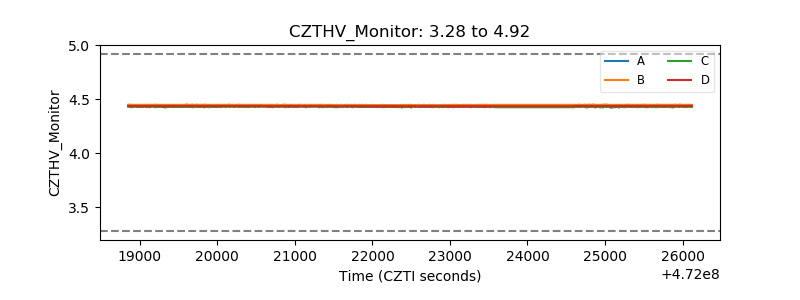 |
| D_VDD | 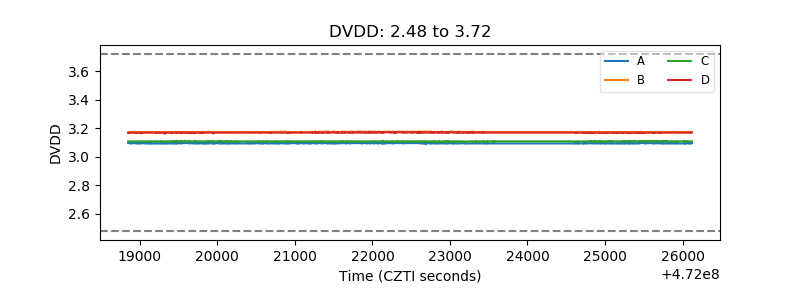 |
| Temperature 1 | 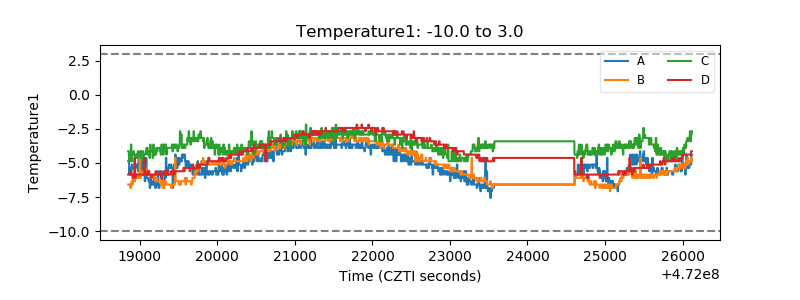 |
| Veto HV Monitor | 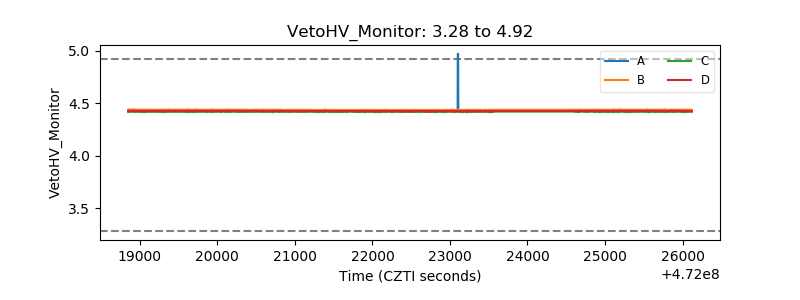 |
| Veto LLD | 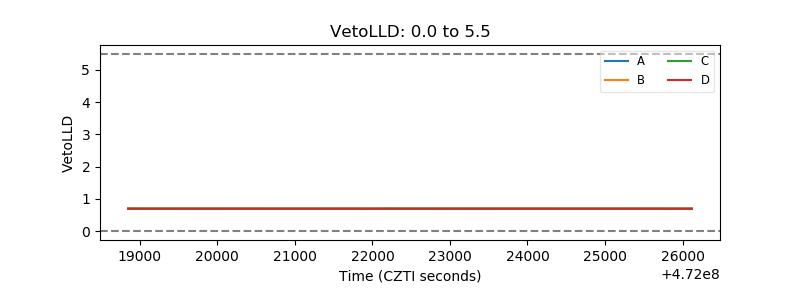 |
| Alpha Counter | 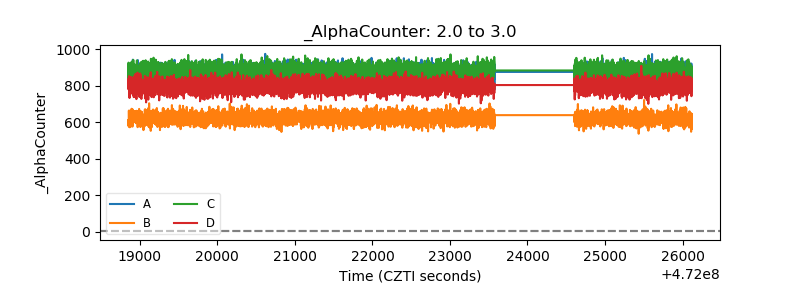 |
| _CPM_Rate | 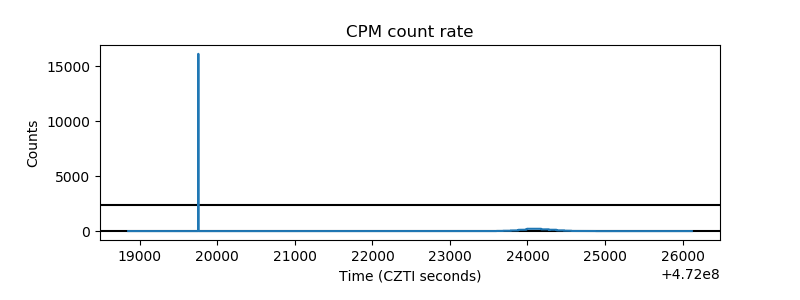 |
| CZT Counter | 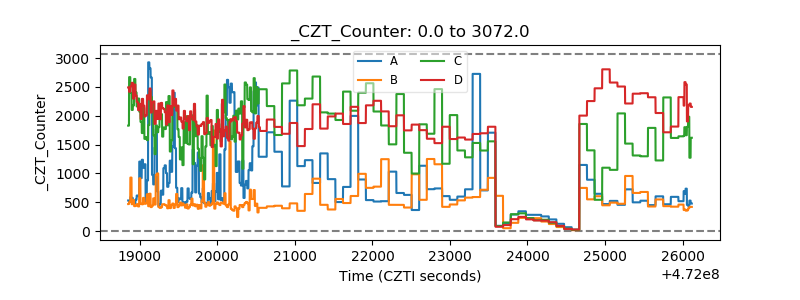 |
| +2.5 Volts monitor | 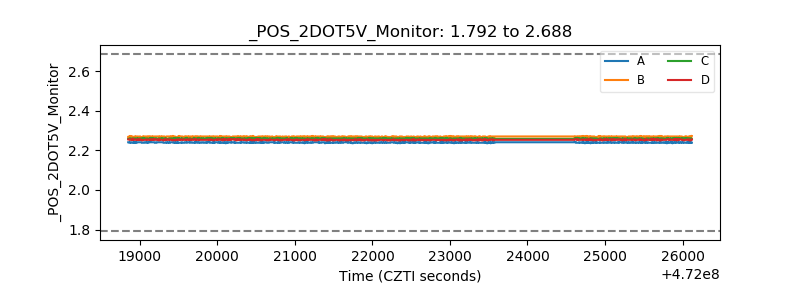 |
| +5 Volts monitor | 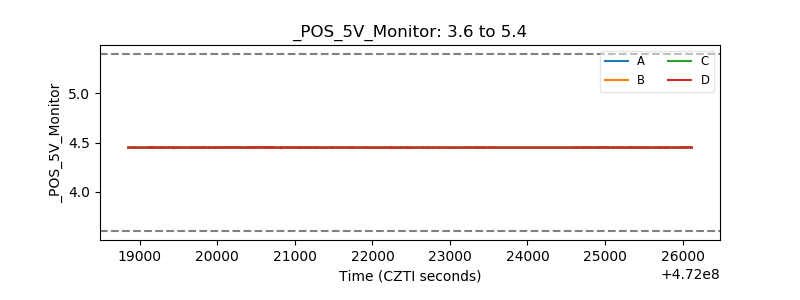 |
| _ROLL_ROT | 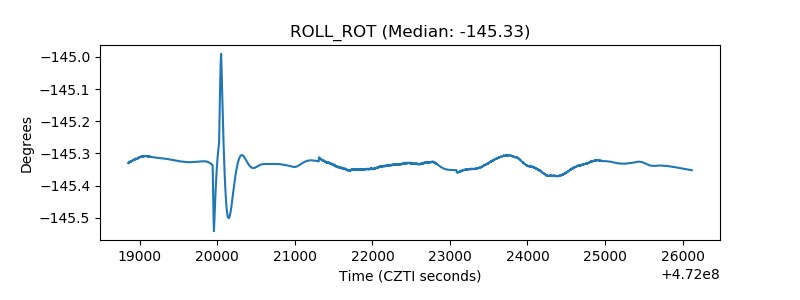 |
| _Roll_DEC | 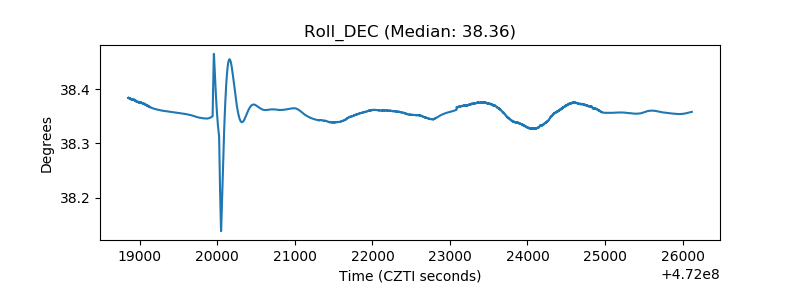 |
| _Roll_RA | 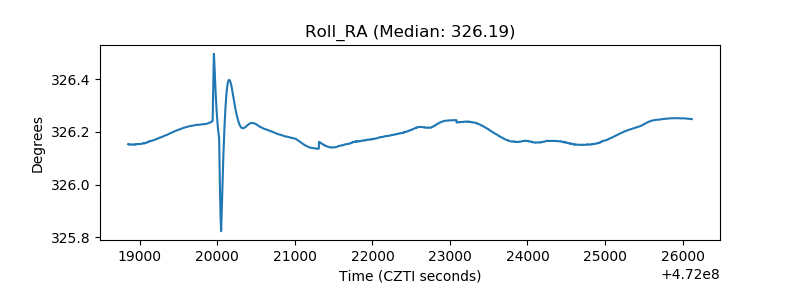 |
| Veto Counter | 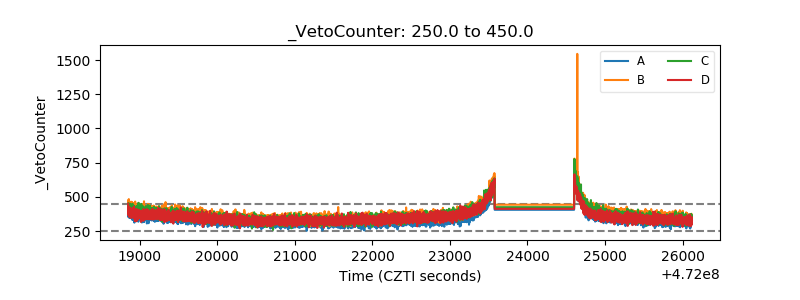 |