| Param | Original file | Final file |
|---|---|---|
| Filename | modeM0/AS1A13_037T01_9000006440_49857cztM0_level2.fits | modeM0/AS1A13_037T01_9000006440_49857cztM0_level2_quad_clean.evt |
| Size (bytes) | 948,620,160 | 59,155,200 |
| Size | 904.7 MB | 56.4 MB |
| Events in quadrant A | 7,333,659 | 540,497 |
| Events in quadrant B | 3,451,108 | 660,870 |
| Events in quadrant C | 11,002,687 | 49,897 |
| Events in quadrant D | 12,829,079 | 87,102 |
| Mode M9 | |||
|---|---|---|---|
| Quadrant | BADHDUFLAG | Total packets | Discarded packets |
| A | 0 | 7 | 0 |
| B | 0 | 7 | 0 |
| C | 0 | 7 | 0 |
| D | 0 | 7 | 0 |
| Mode SS | |||
|---|---|---|---|
| Quadrant | BADHDUFLAG | Total packets | Discarded packets |
| A | 0 | 128 | 0 |
| B | 0 | 128 | 0 |
| C | 0 | 128 | 0 |
| D | 0 | 128 | 0 |
| Mode M0 | |||
|---|---|---|---|
| Quadrant | BADHDUFLAG | Total packets | Discarded packets |
| A | 0 | 26275 | 0 |
| B | 0 | 14844 | 0 |
| C | 0 | 37168 | 0 |
| D | 0 | 42530 | 0 |
| Quadrant | Total seconds | Saturated seconds | Saturation percentage |
|---|---|---|---|
| A | 6397 | 1249 | 19.524777% |
| B | 6398 | 276 | 4.313848% |
| C | 6398 | 6398 | 100.000000% |
| D | 6398 | 6342 | 99.124726% |
Noise dominated data is calculated using 1-second bins in cleaned event files. If a bin has >2000 counts, and if more than 50% of those come from <1% of pixels, then it is considered to be noise-dominated and hence unusable.
| Quadrant | # 1 sec bins | Bins with >0 counts | Bins with >2000 counts | High rate bins dominated by noise | Noise dominated (total time) | Noise dominated (detector-on time) | Marked lightcurve |
|---|---|---|---|---|---|---|---|
| A | 7046 | 6396 | 977 | 977 | 13.87% | 15.28% | 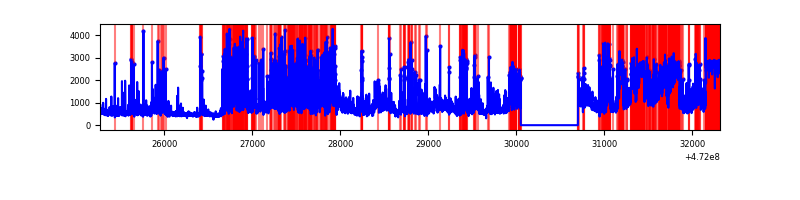 |
| B | 7048 | 6399 | 64 | 64 | 0.91% | 1.00% | 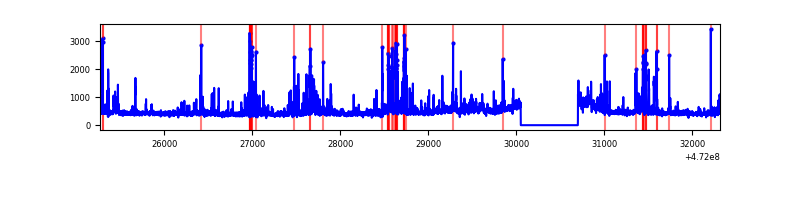 |
| C | 7047 | 6397 | 1331 | 1331 | 18.89% | 20.81% | 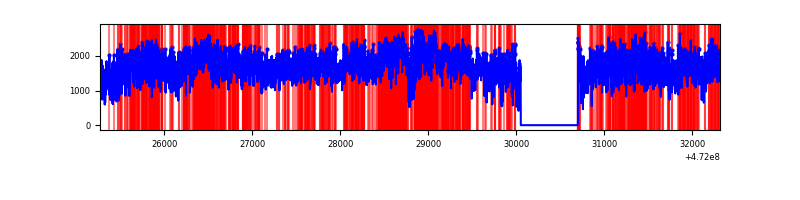 |
| D | 7047 | 6397 | 3529 | 3529 | 50.08% | 55.17% | 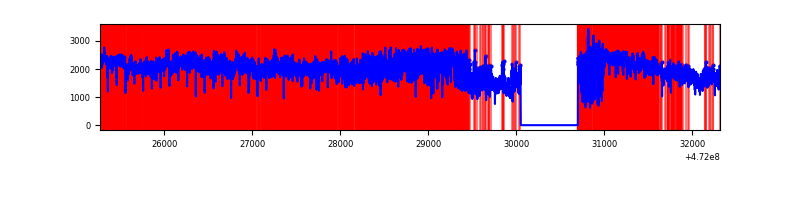 |
Top three noisy pixels from each quadrant. If the there are fewer than three noisy pixels in the level2.evt file, extra rows are filled as -1
| Pixel properties | Quadrant properties | ||||||
|---|---|---|---|---|---|---|---|
| Quadrant | DetID | PixID | Counts | Sigma | Mean | Median | Sigma |
| A | 4 | 4 | 1945989 | 12205.28 | 637 | 620 | 159.4 |
| A | 6 | 250 | 576313 | 3611.91 | 637 | 620 | 159.4 |
| A | 11 | 3 | 403661 | 2528.69 | 637 | 620 | 159.4 |
| B | 4 | 206 | 281443 | 1908.8 | 692 | 670 | 147.1 |
| B | 1 | 255 | 85631 | 577.6 | 692 | 670 | 147.1 |
| B | 4 | 190 | 74802 | 503.98 | 692 | 670 | 147.1 |
| C | 15 | 230 | 3452740 | 100417.33 | 72 | 69 | 34.4 |
| C | 4 | 111 | 1525399 | 44362.63 | 72 | 69 | 34.4 |
| C | 15 | 189 | 1328366 | 38632.13 | 72 | 69 | 34.4 |
| D | 7 | 61 | 6199705 | 145909.8 | 127 | 121 | 42.5 |
| D | 8 | 129 | 3233186 | 76091.53 | 127 | 121 | 42.5 |
| D | 15 | 185 | 856269 | 20149.8 | 127 | 121 | 42.5 |
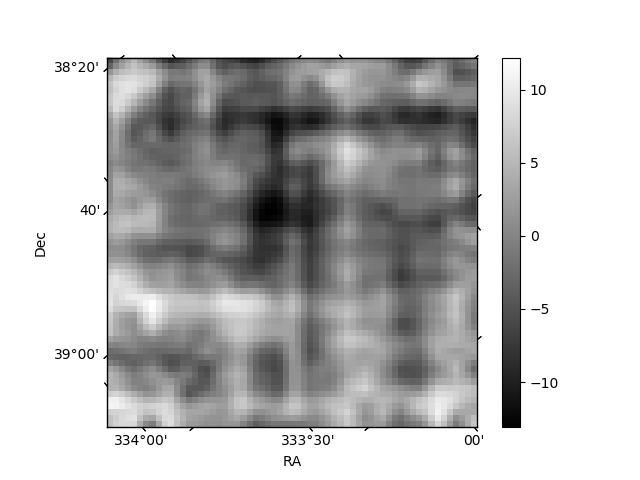
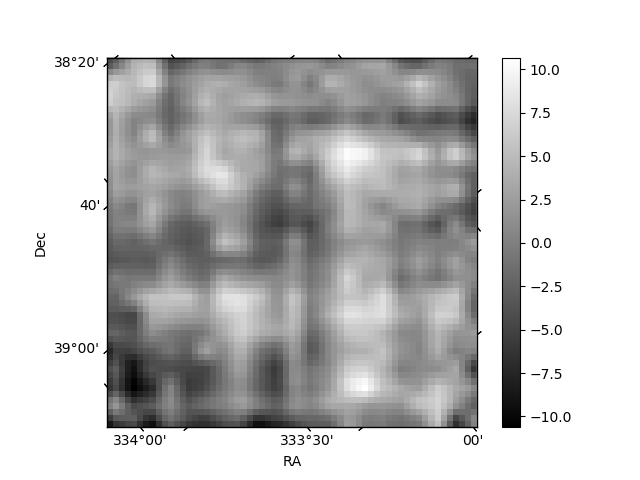
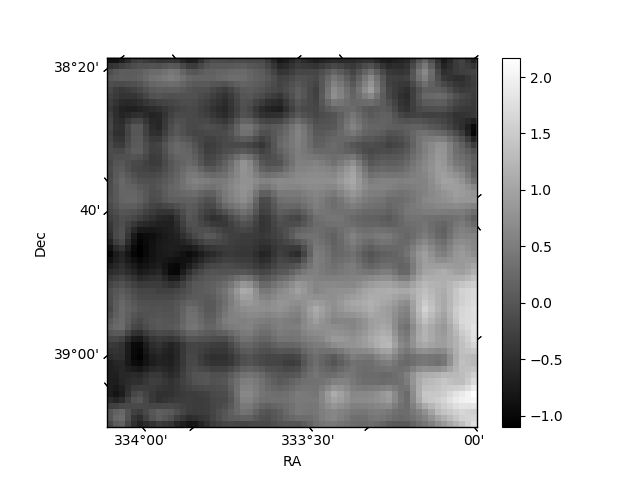
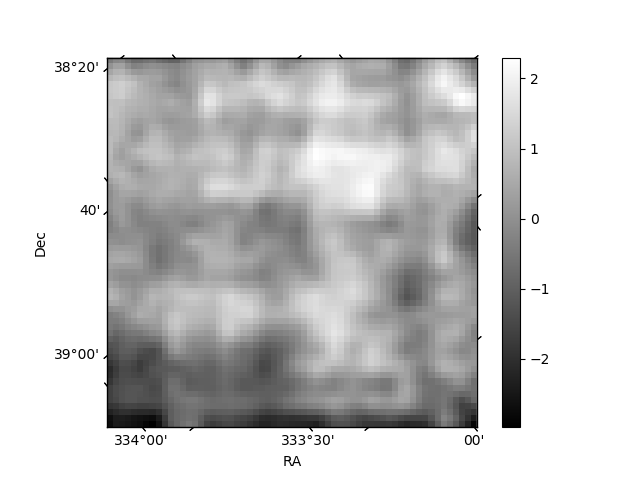
Histogram calculated using DETX and DETY for each event in the final _common_clean file
| Quadrant A | 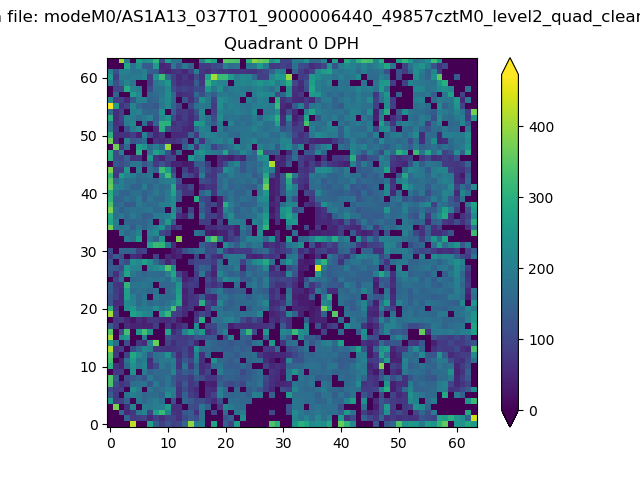 |
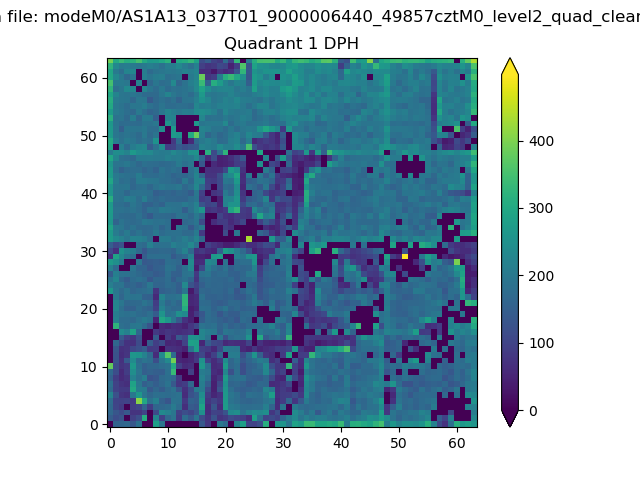 |
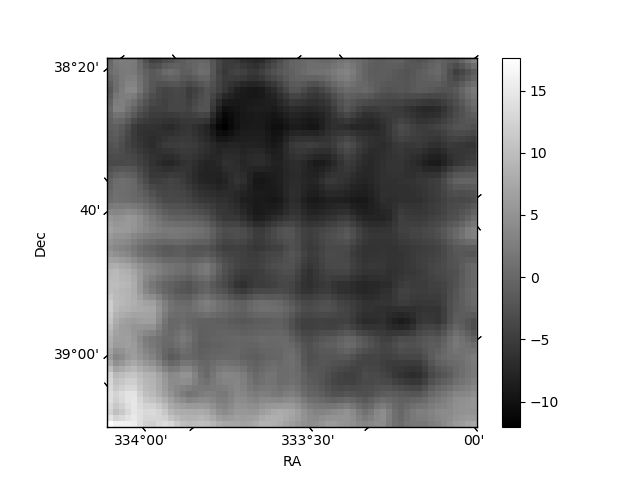
Quadrant B |
|---|---|---|---|
| Quadrant D | 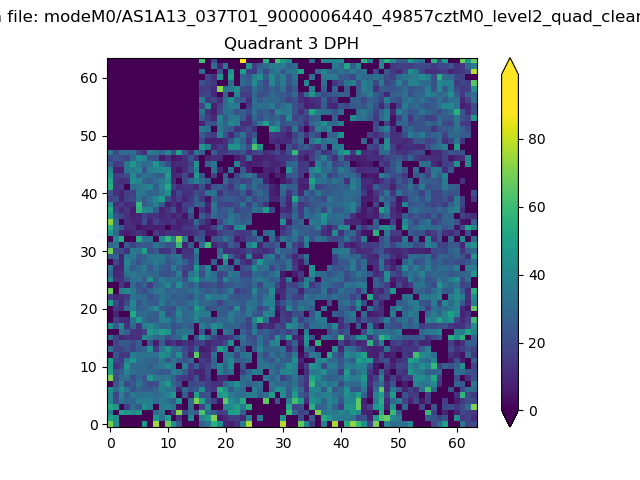 |
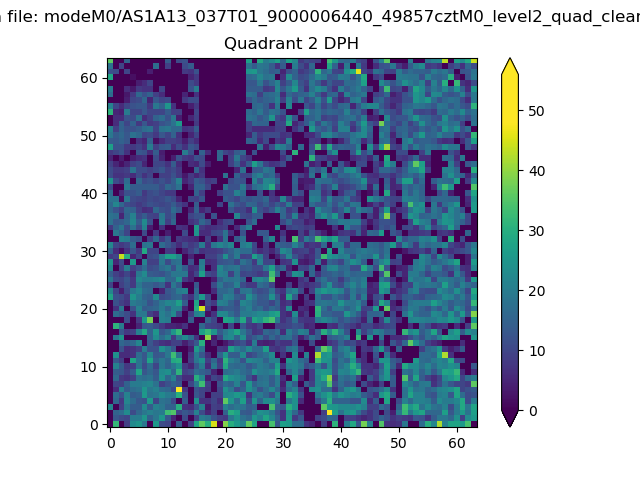 |
Quadrant C |
| Plot type | Count rate plots | Images |
|---|---|---|
| Comparison with Poisson distribution Blue bars denote a histogram of data divided into 1 sec bins. Red curve is a Poisson curve with rate = median count rate of data. |
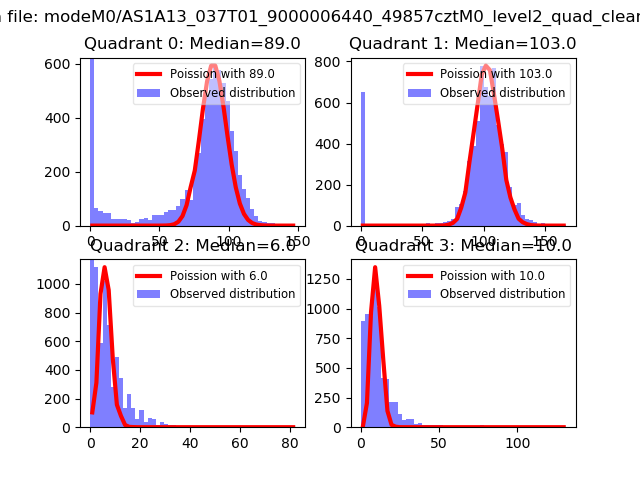 |
 |
| Quadrant-wise count rates Data is divided into 100 sec bins |
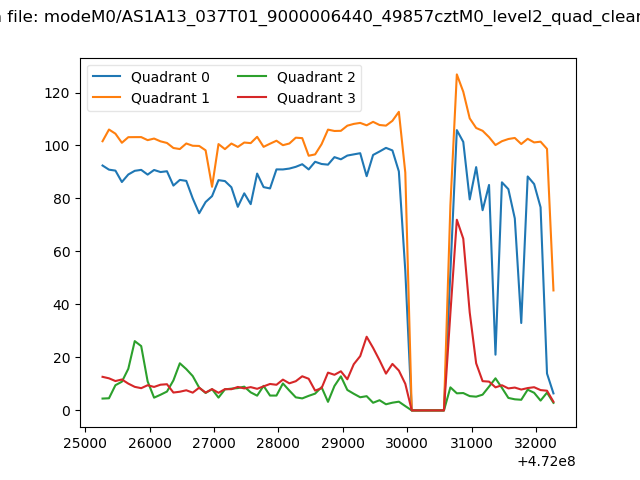 |
|
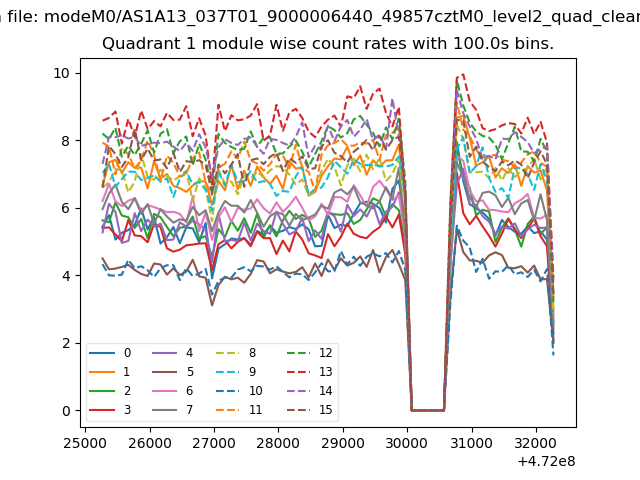
| Module-wise count rates for Quadrant A Data is divided into 100 sec bins |
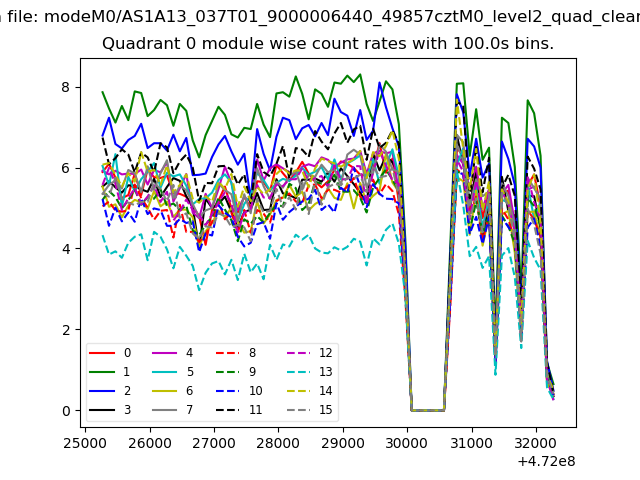 |
 |
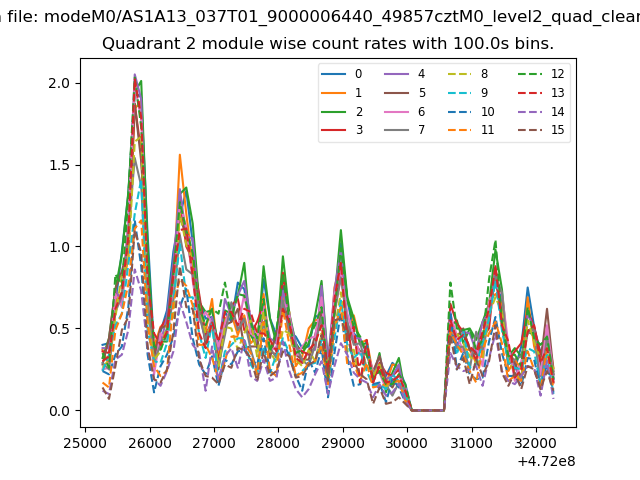
| Module-wise count rates for Quadrant B Data is divided into 100 sec bins |
 |
 |
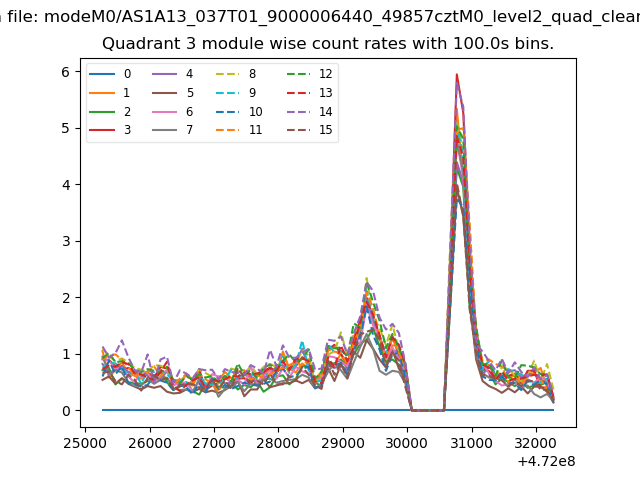
| Module-wise count rates for Quadrant C Data is divided into 100 sec bins |
 |
 |
| Module-wise count rates for Quadrant D Data is divided into 100 sec bins |
 |
 |
| Parameter | Plot |
|---|---|
| CZT HV Monitor |  |
| D_VDD | 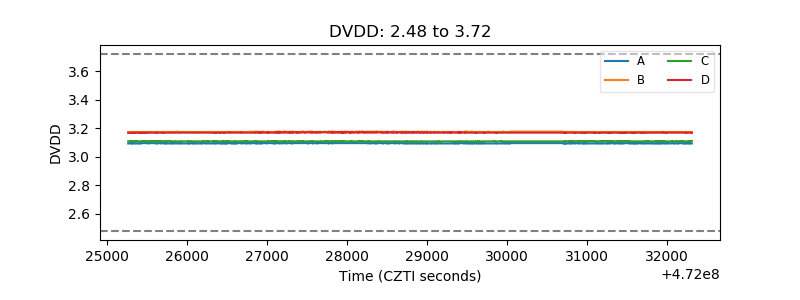 |
| Temperature 1 | 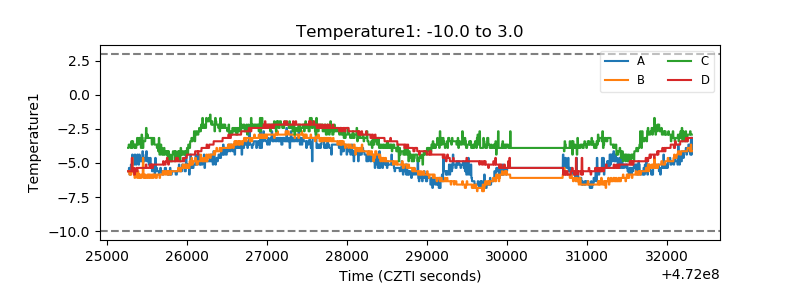 |
| Veto HV Monitor | 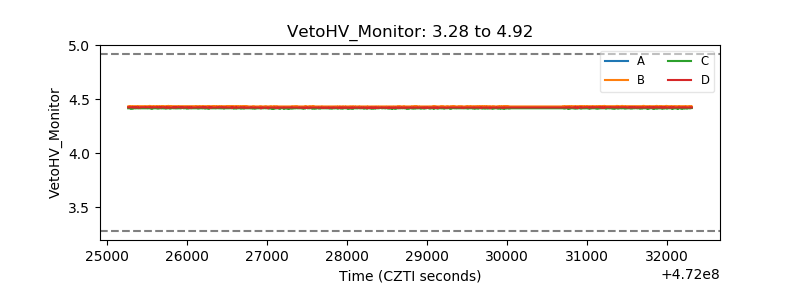 |
| Veto LLD | 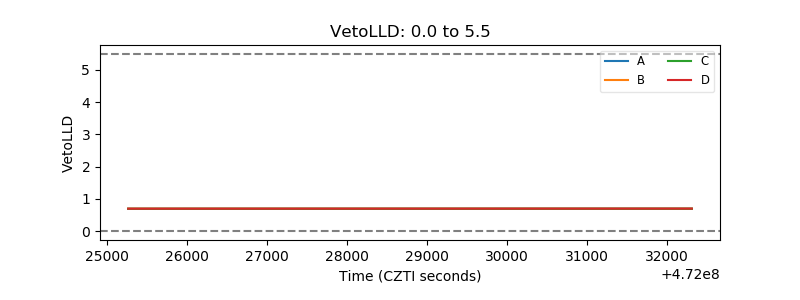 |
| Alpha Counter | 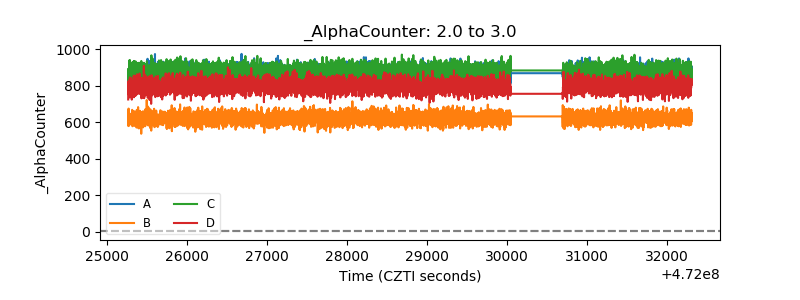 |
| _CPM_Rate | 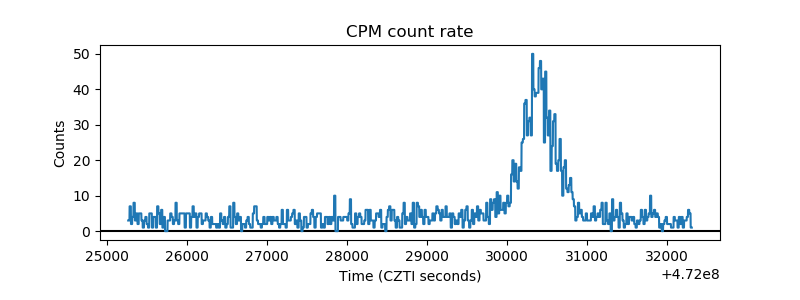 |
| CZT Counter | 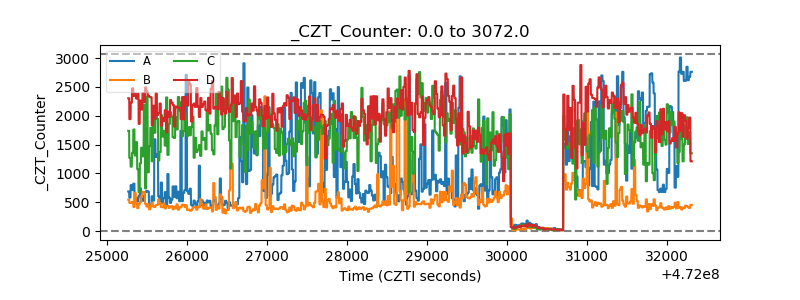 |
| +2.5 Volts monitor | 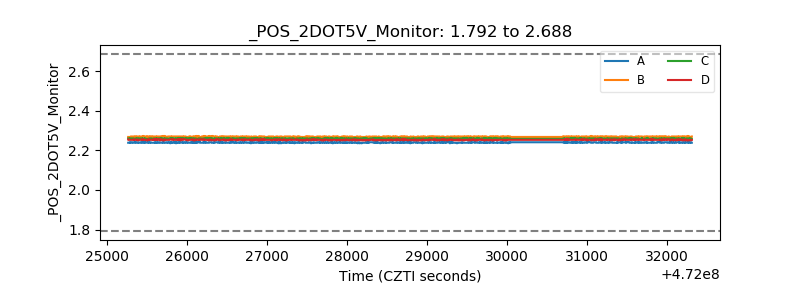 |
| +5 Volts monitor | 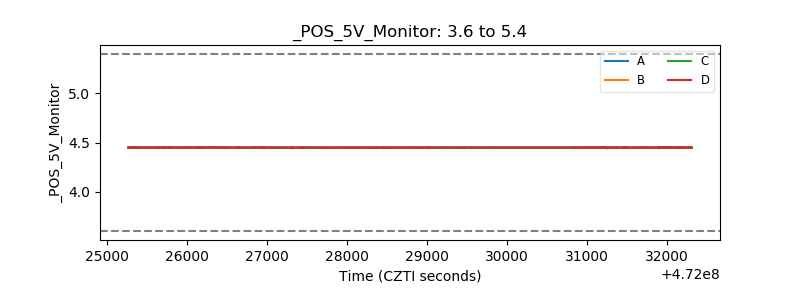 |
| _ROLL_ROT | 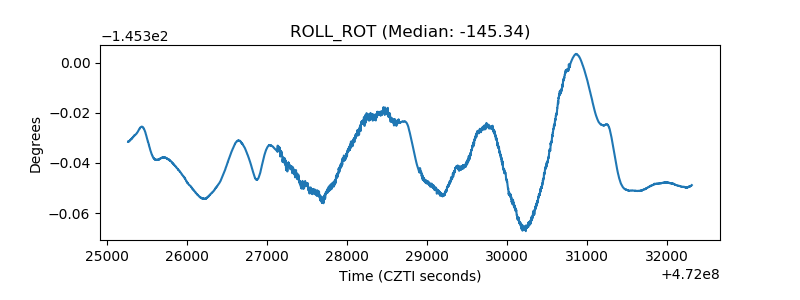 |
| _Roll_DEC | 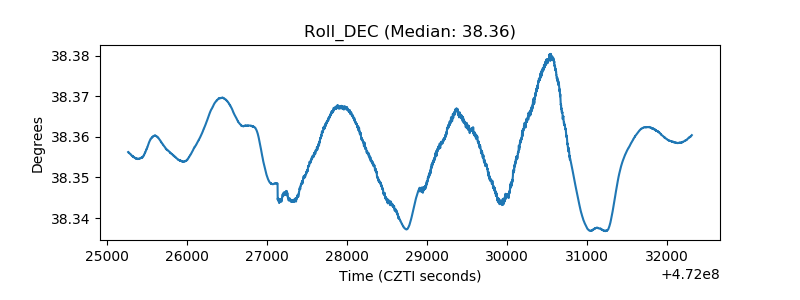 |
| _Roll_RA | 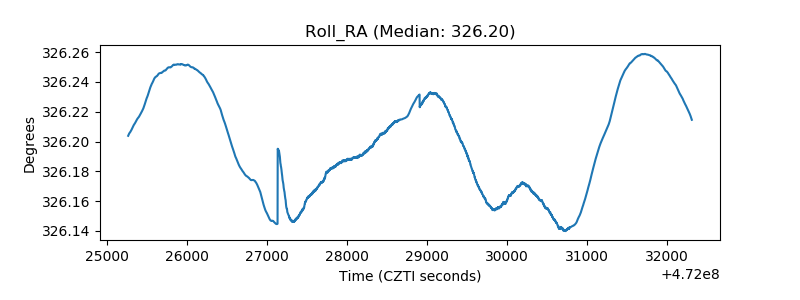 |
| Veto Counter | 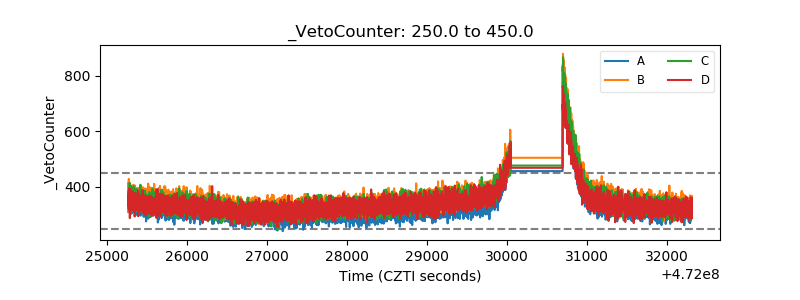 |