| Param | Original file | Final file |
|---|---|---|
| Filename | modeM0/AS1A13_037T01_9000006440_49863cztM0_level2.fits | modeM0/AS1A13_037T01_9000006440_49863cztM0_level2_quad_clean.evt |
| Size (bytes) | 3,080,911,680 | 118,595,520 |
| Size | 2.9 GB | 113.1 MB |
| Events in quadrant A | 37,855,483 | 472,023 |
| Events in quadrant B | 10,567,284 | 1,821,795 |
| Events in quadrant C | 29,804,762 | 5,218 |
| Events in quadrant D | 34,383,126 | 13,812 |
| Mode M9 | |||
|---|---|---|---|
| Quadrant | BADHDUFLAG | Total packets | Discarded packets |
| A | 0 | 11 | 0 |
| B | 0 | 11 | 0 |
| C | 0 | 11 | 0 |
| D | 0 | 11 | 0 |
| Mode SS | |||
|---|---|---|---|
| Quadrant | BADHDUFLAG | Total packets | Discarded packets |
| A | 0 | 374 | 0 |
| B | 0 | 374 | 0 |
| C | 0 | 374 | 0 |
| D | 0 | 374 | 0 |
| Mode M0 | |||
|---|---|---|---|
| Quadrant | BADHDUFLAG | Total packets | Discarded packets |
| A | 0 | 125215 | 3 |
| B | 0 | 44298 | 3 |
| C | 0 | 101490 | 3 |
| D | 0 | 114999 | 3 |
| Quadrant | Total seconds | Saturated seconds | Saturation percentage |
|---|---|---|---|
| A | 18528 | 13950 | 75.291451% |
| B | 18529 | 574 | 3.097847% |
| C | 18529 | 18491 | 99.794916% |
| D | 18529 | 18409 | 99.352367% |
Noise dominated data is calculated using 1-second bins in cleaned event files. If a bin has >2000 counts, and if more than 50% of those come from <1% of pixels, then it is considered to be noise-dominated and hence unusable.
| Quadrant | # 1 sec bins | Bins with >0 counts | Bins with >2000 counts | High rate bins dominated by noise | Noise dominated (total time) | Noise dominated (detector-on time) | Marked lightcurve |
|---|---|---|---|---|---|---|---|
| A | 19672 | 18527 | 11454 | 11454 | 58.22% | 61.82% | 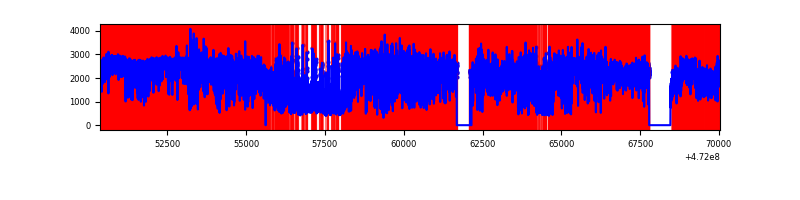 |
| B | 19674 | 18532 | 273 | 273 | 1.39% | 1.47% | 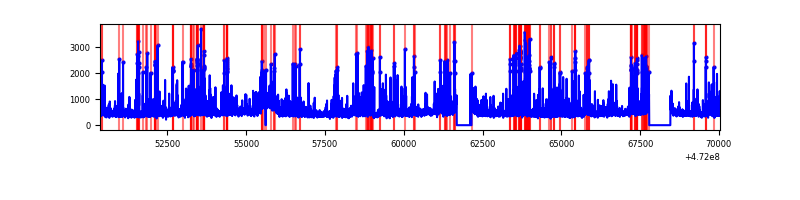 |
| C | 19673 | 18528 | 4648 | 4648 | 23.63% | 25.09% | 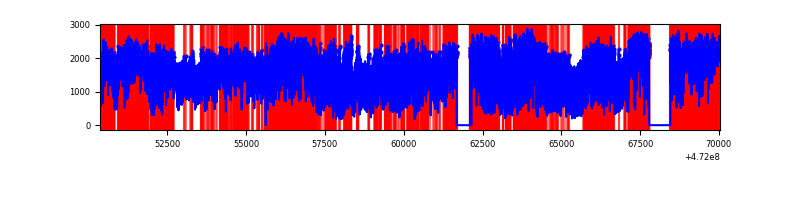 |
| D | 19673 | 18529 | 5532 | 5532 | 28.12% | 29.86% | 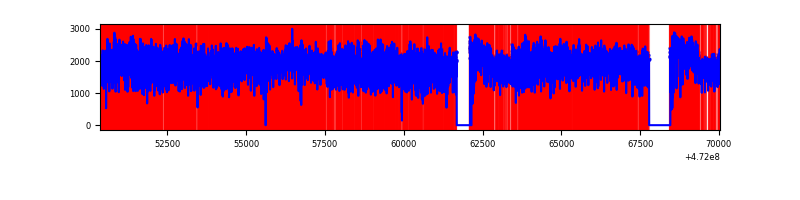 |
Top three noisy pixels from each quadrant. If the there are fewer than three noisy pixels in the level2.evt file, extra rows are filled as -1
| Pixel properties | Quadrant properties | ||||||
|---|---|---|---|---|---|---|---|
| Quadrant | DetID | PixID | Counts | Sigma | Mean | Median | Sigma |
| A | 4 | 4 | 19748348 | 64473.2 | 1129 | 1095 | 306.3 |
| A | 0 | 98 | 5705128 | 18623.21 | 1129 | 1095 | 306.3 |
| A | 6 | 35 | 1995631 | 6512.0 | 1129 | 1095 | 306.3 |
| B | 4 | 206 | 1035699 | 2461.12 | 1972 | 1904 | 420.1 |
| B | 4 | 171 | 370421 | 877.31 | 1972 | 1904 | 420.1 |
| B | 4 | 216 | 286899 | 678.48 | 1972 | 1904 | 420.1 |
| C | 4 | 111 | 6700632 | 75398.77 | 163 | 153 | 88.9 |
| C | 15 | 236 | 5175604 | 58238.02 | 163 | 153 | 88.9 |
| C | 15 | 230 | 3698673 | 41618.49 | 163 | 153 | 88.9 |
| D | 7 | 61 | 12777831 | 95211.58 | 267 | 247 | 134.2 |
| D | 8 | 129 | 11603331 | 86459.85 | 267 | 247 | 134.2 |
| D | 15 | 185 | 1701426 | 12676.26 | 267 | 247 | 134.2 |
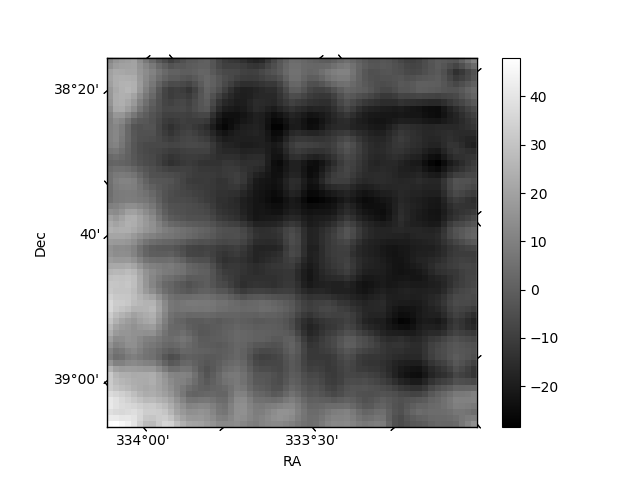
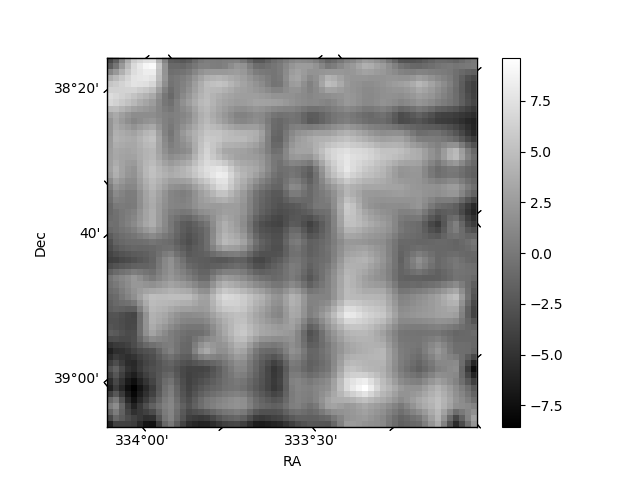
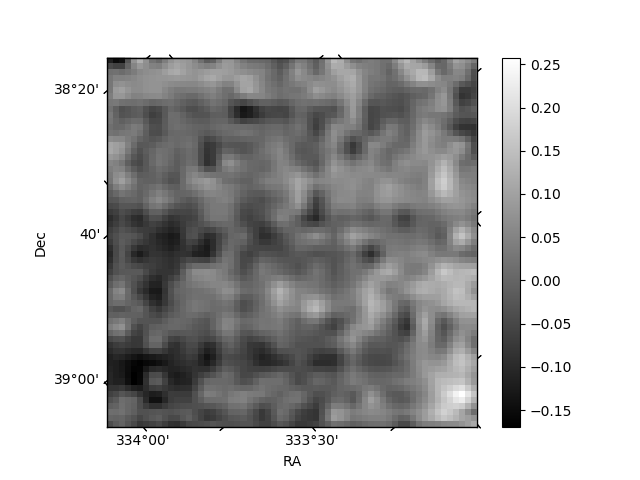
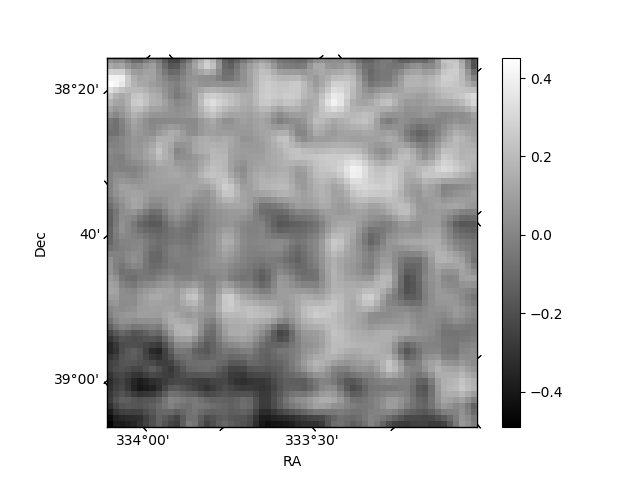
Histogram calculated using DETX and DETY for each event in the final _common_clean file
| Quadrant A | 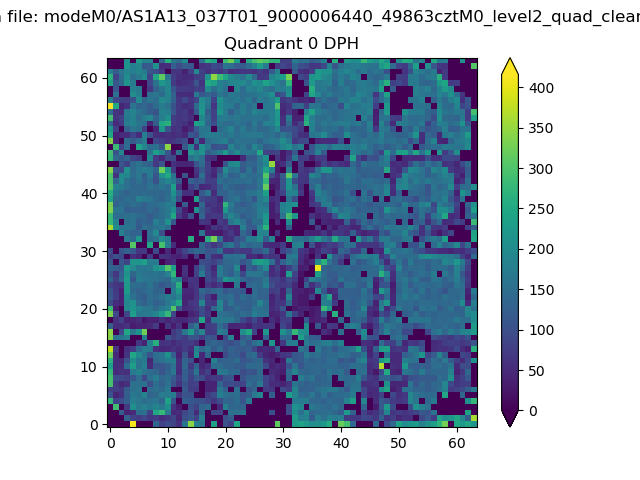 |
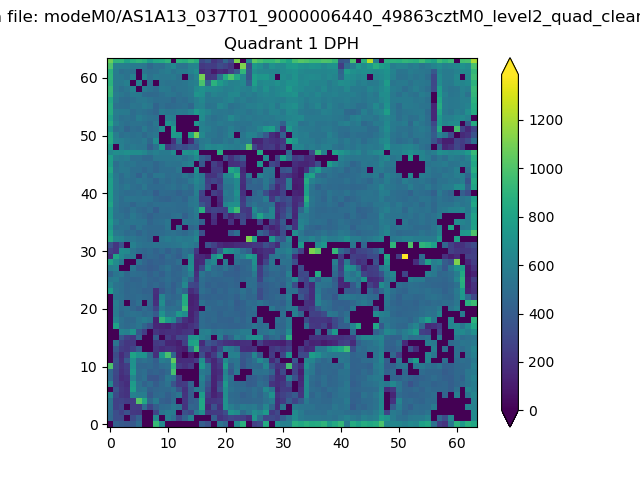 |
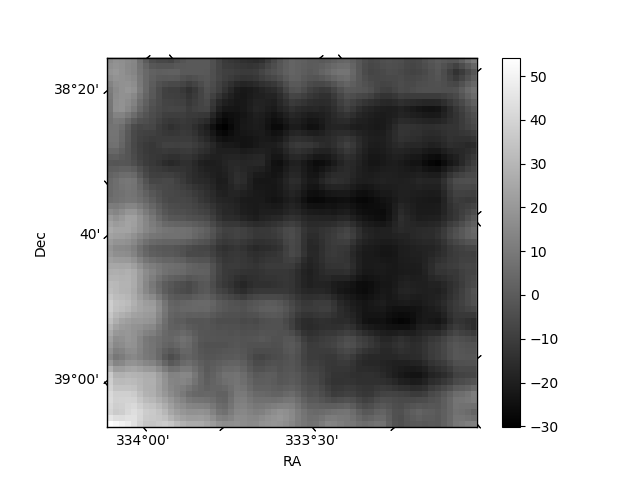
Quadrant B |
|---|---|---|---|
| Quadrant D | 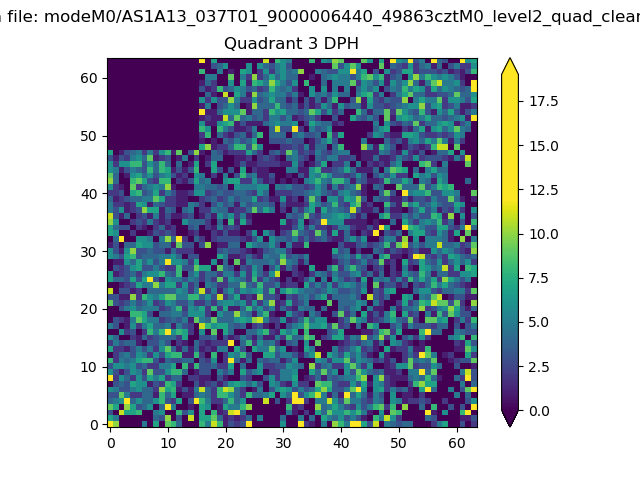 |
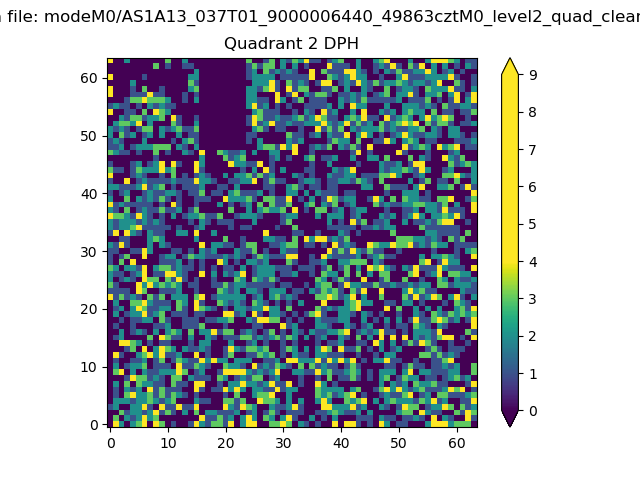 |
Quadrant C |
| Plot type | Count rate plots | Images |
|---|---|---|
| Comparison with Poisson distribution Blue bars denote a histogram of data divided into 1 sec bins. Red curve is a Poisson curve with rate = median count rate of data. |
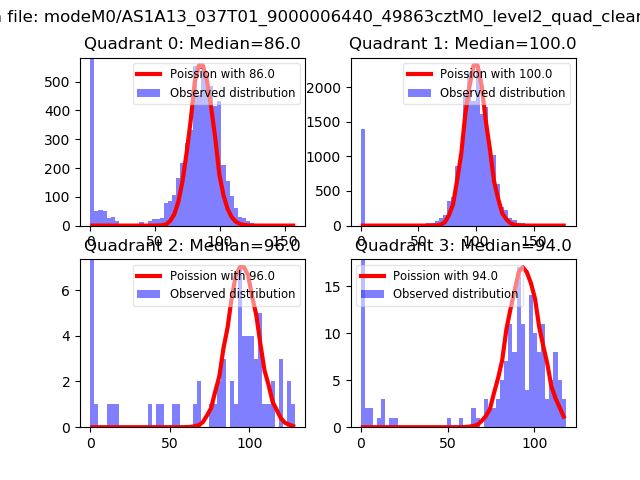 |
 |
| Quadrant-wise count rates Data is divided into 100 sec bins |
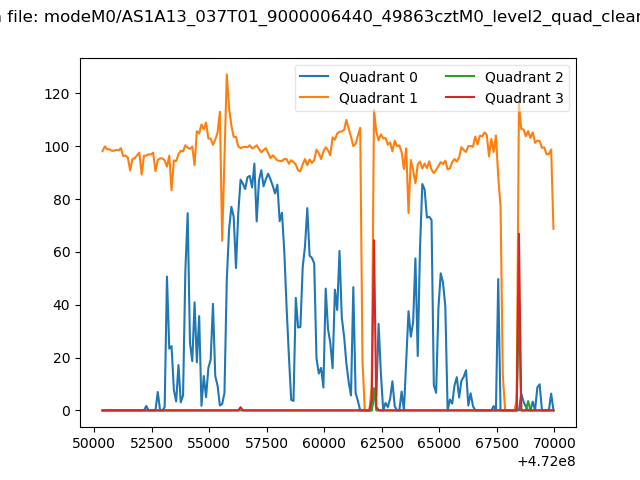 |
|
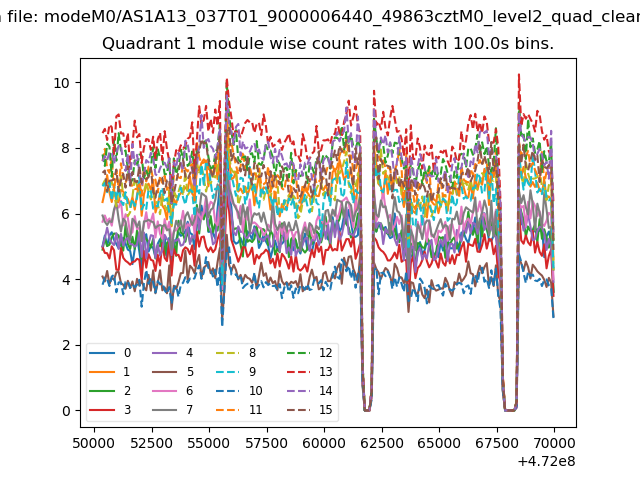
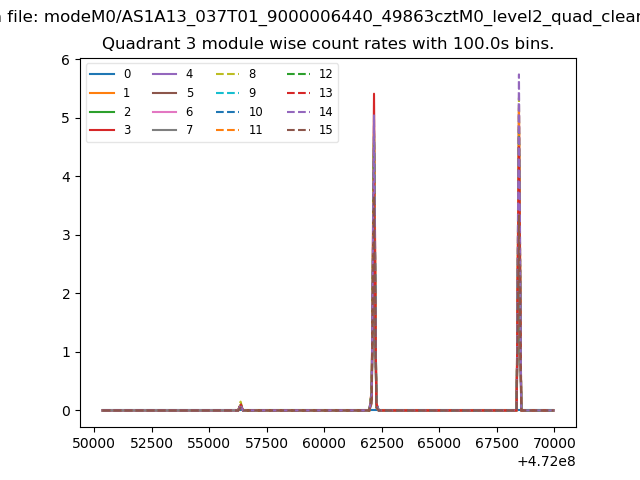
| Module-wise count rates for Quadrant A Data is divided into 100 sec bins |
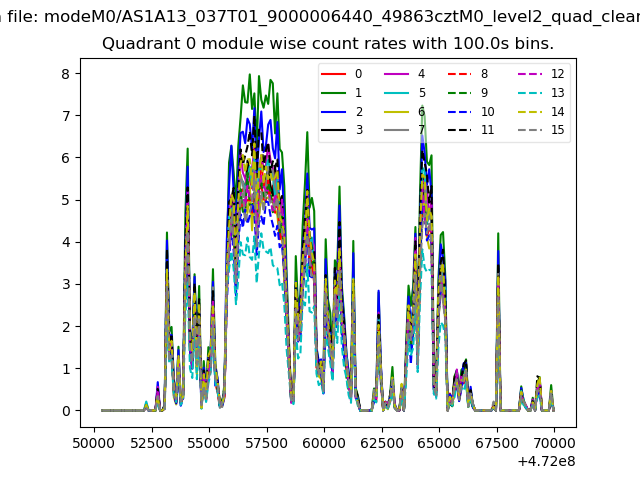 |
 |
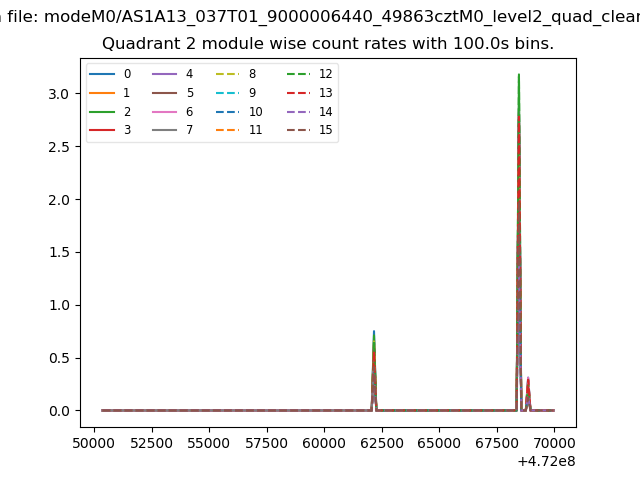
| Module-wise count rates for Quadrant B Data is divided into 100 sec bins |
 |
 |
| Module-wise count rates for Quadrant C Data is divided into 100 sec bins |
 |
 |
| Module-wise count rates for Quadrant D Data is divided into 100 sec bins |
 |
 |
| Parameter | Plot |
|---|---|
| CZT HV Monitor | 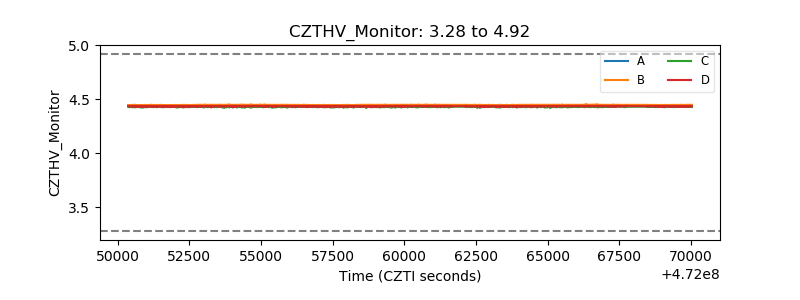 |
| D_VDD | 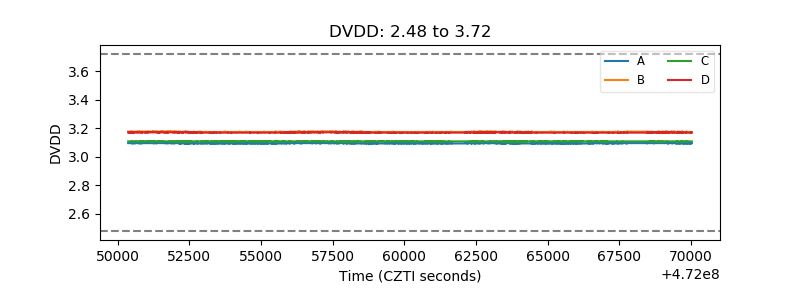 |
| Temperature 1 | 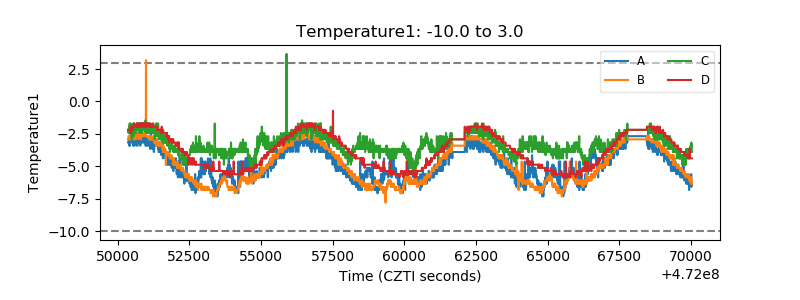 |
| Veto HV Monitor | 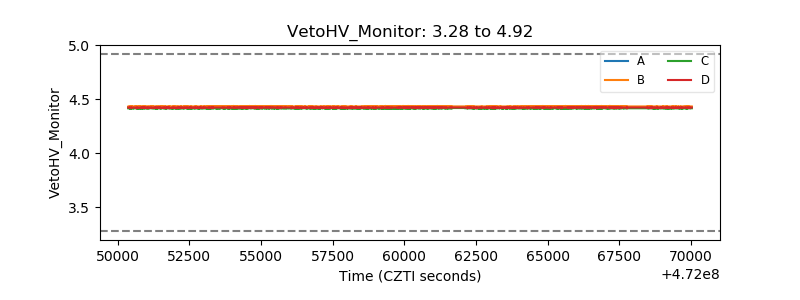 |
| Veto LLD | 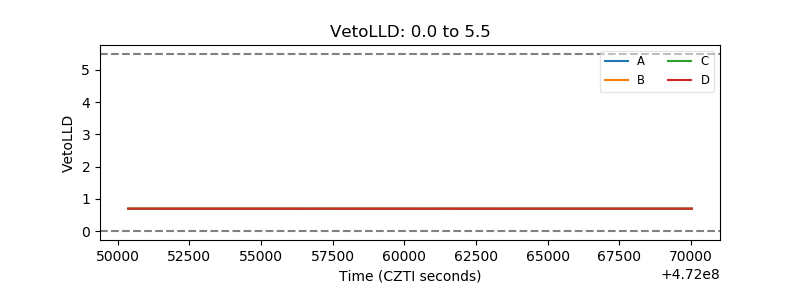 |
| Alpha Counter | 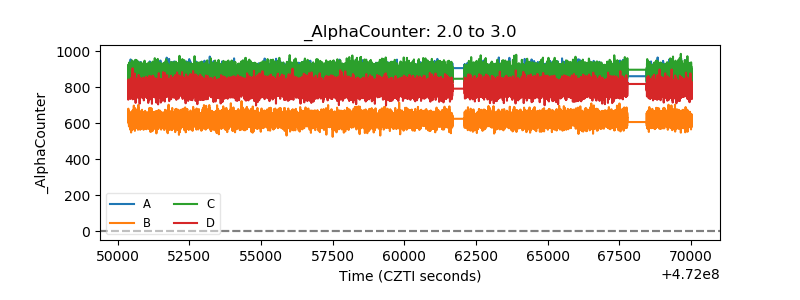 |
| _CPM_Rate | 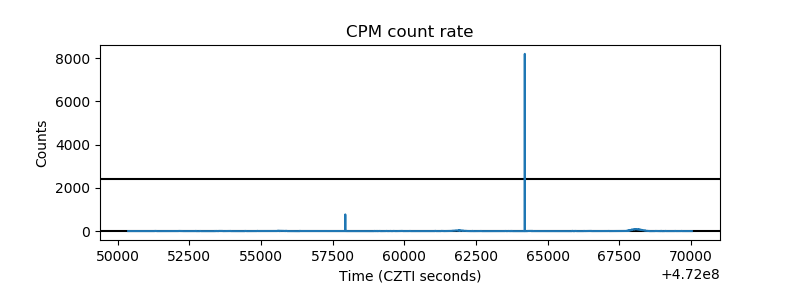 |
| CZT Counter | 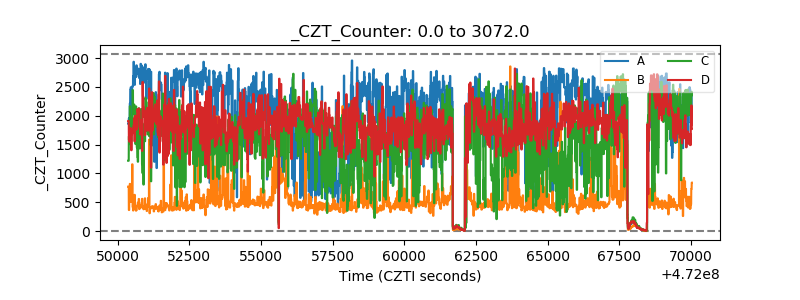 |
| +2.5 Volts monitor | 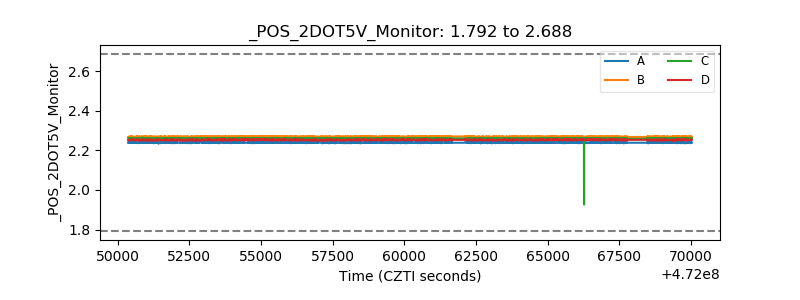 |
| +5 Volts monitor | 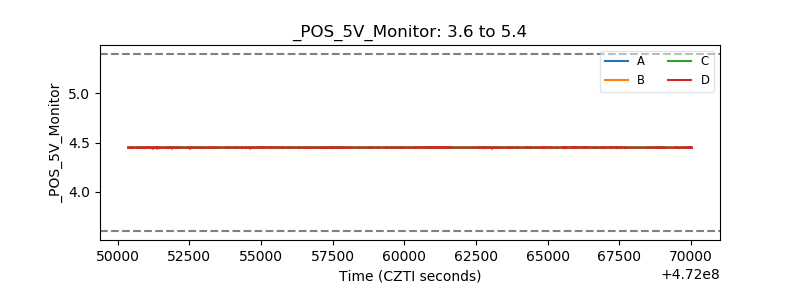 |
| _ROLL_ROT | 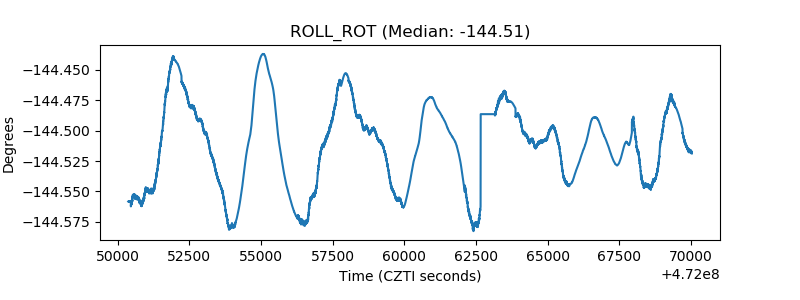 |
| _Roll_DEC | 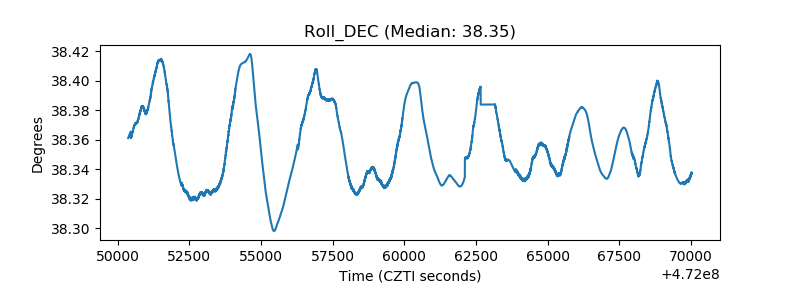 |
| _Roll_RA |  |
| Veto Counter | 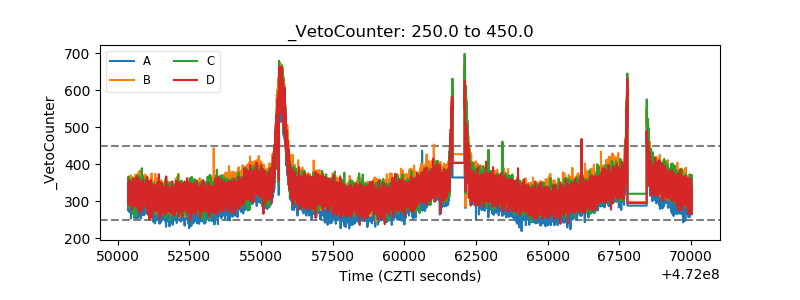 |