| Param | Original file | Final file |
|---|---|---|
| Filename | modeM0/AS1A13_037T01_9000006440_49864cztM0_level2.fits | modeM0/AS1A13_037T01_9000006440_49864cztM0_level2_quad_clean.evt |
| Size (bytes) | 1,176,298,560 | 39,983,040 |
| Size | 1.1 GB | 38.1 MB |
| Events in quadrant A | 14,136,813 | 71,179 |
| Events in quadrant B | 4,168,804 | 652,709 |
| Events in quadrant C | 12,562,507 | 18,854 |
| Events in quadrant D | 12,161,687 | 6,884 |
| Mode M9 | |||
|---|---|---|---|
| Quadrant | BADHDUFLAG | Total packets | Discarded packets |
| A | 0 | 8 | 0 |
| B | 0 | 8 | 0 |
| C | 0 | 8 | 0 |
| D | 0 | 8 | 0 |
| Mode SS | |||
|---|---|---|---|
| Quadrant | BADHDUFLAG | Total packets | Discarded packets |
| A | 0 | 134 | 0 |
| B | 0 | 134 | 0 |
| C | 0 | 134 | 0 |
| D | 0 | 134 | 0 |
| Mode M0 | |||
|---|---|---|---|
| Quadrant | BADHDUFLAG | Total packets | Discarded packets |
| A | 0 | 46534 | 1 |
| B | 0 | 16967 | 1 |
| C | 0 | 41898 | 5 |
| D | 0 | 40700 | 1 |
| Quadrant | Total seconds | Saturated seconds | Saturation percentage |
|---|---|---|---|
| A | 6607 | 5961 | 90.222491% |
| B | 6608 | 194 | 2.935835% |
| C | 6607 | 6450 | 97.623732% |
| D | 6607 | 6544 | 99.046466% |
Noise dominated data is calculated using 1-second bins in cleaned event files. If a bin has >2000 counts, and if more than 50% of those come from <1% of pixels, then it is considered to be noise-dominated and hence unusable.
| Quadrant | # 1 sec bins | Bins with >0 counts | Bins with >2000 counts | High rate bins dominated by noise | Noise dominated (total time) | Noise dominated (detector-on time) | Marked lightcurve |
|---|---|---|---|---|---|---|---|
| A | 7461 | 6606 | 4393 | 4393 | 58.88% | 66.50% | 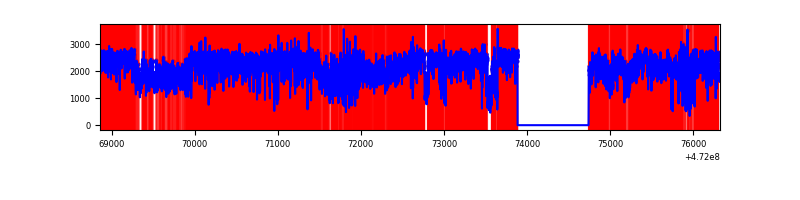 |
| B | 7463 | 6609 | 133 | 133 | 1.78% | 2.01% | 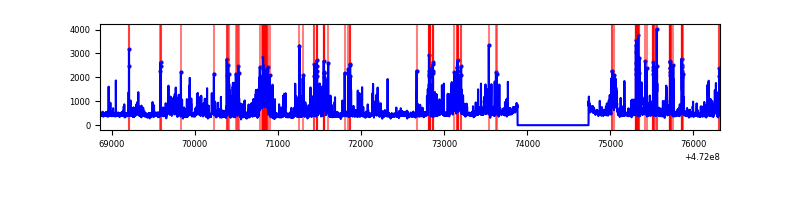 |
| C | 7461 | 6606 | 2971 | 2971 | 39.82% | 44.97% | 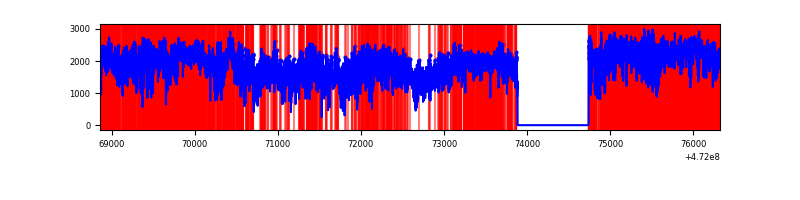 |
| D | 7461 | 6606 | 1735 | 1735 | 23.25% | 26.26% | 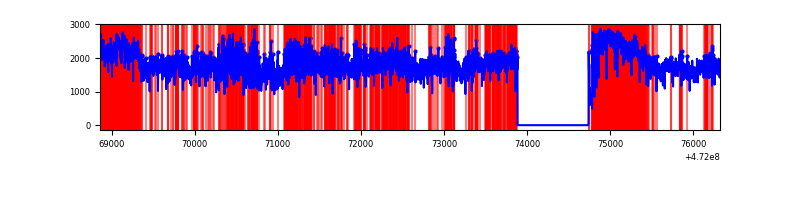 |
Top three noisy pixels from each quadrant. If the there are fewer than three noisy pixels in the level2.evt file, extra rows are filled as -1
| Pixel properties | Quadrant properties | ||||||
|---|---|---|---|---|---|---|---|
| Quadrant | DetID | PixID | Counts | Sigma | Mean | Median | Sigma |
| A | 4 | 4 | 10914185 | 144123.39 | 271 | 261 | 75.7 |
| A | 0 | 98 | 823766 | 10874.76 | 271 | 261 | 75.7 |
| A | 6 | 35 | 376900 | 4973.69 | 271 | 261 | 75.7 |
| B | 4 | 206 | 683842 | 4595.87 | 693 | 669 | 148.6 |
| B | 0 | 229 | 329483 | 2212.01 | 693 | 669 | 148.6 |
| B | 4 | 216 | 114930 | 768.66 | 693 | 669 | 148.6 |
| C | 15 | 230 | 3089502 | 62199.61 | 149 | 146 | 49.7 |
| C | 15 | 197 | 1794438 | 36125.42 | 149 | 146 | 49.7 |
| C | 4 | 111 | 1162814 | 23408.6 | 149 | 146 | 49.7 |
| D | 7 | 61 | 7225741 | 185560.88 | 107 | 101 | 38.9 |
| D | 8 | 129 | 2173851 | 55823.84 | 107 | 101 | 38.9 |
| D | 15 | 185 | 608645 | 15627.95 | 107 | 101 | 38.9 |
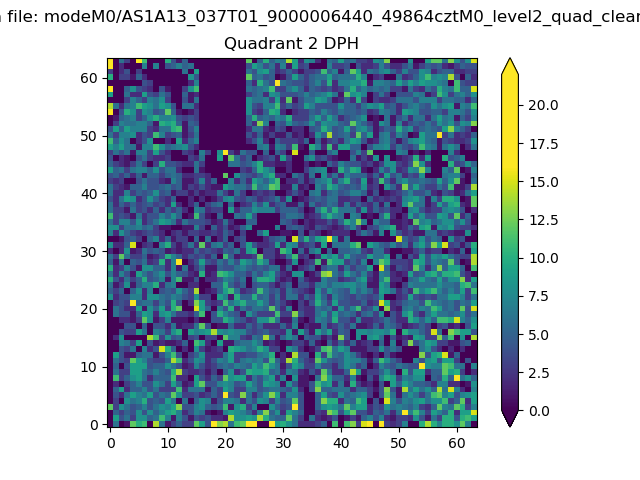
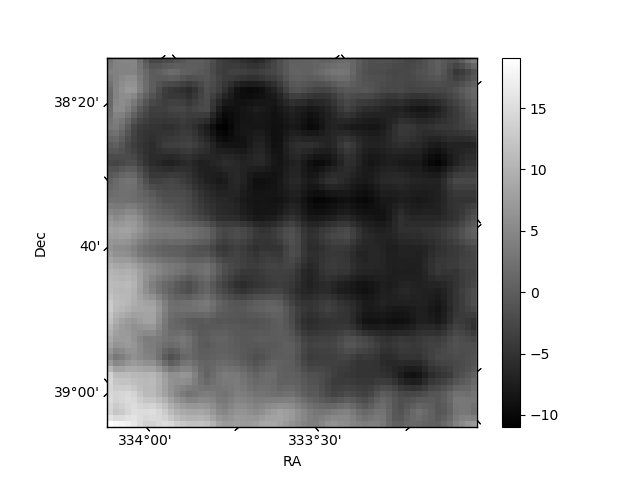
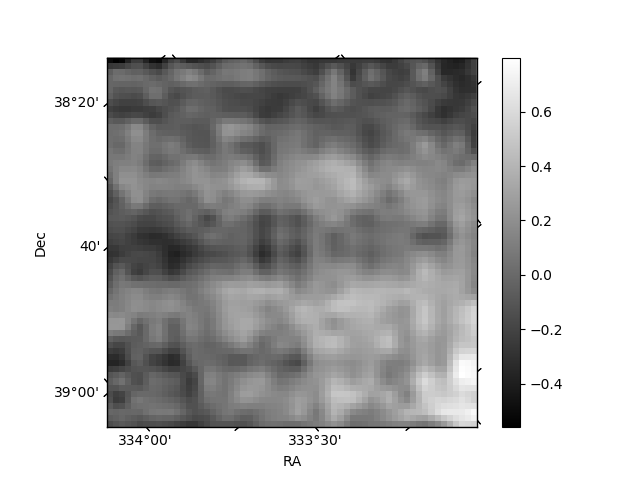
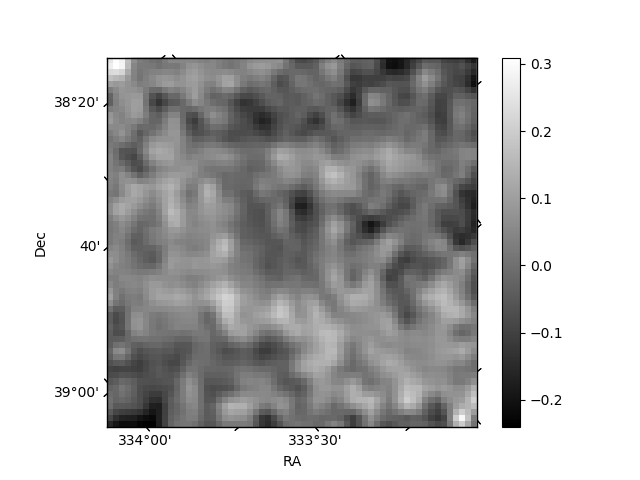
Histogram calculated using DETX and DETY for each event in the final _common_clean file
| Quadrant A | 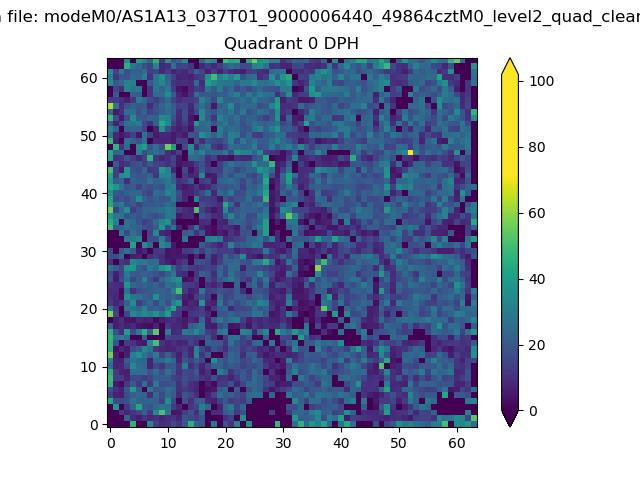 |
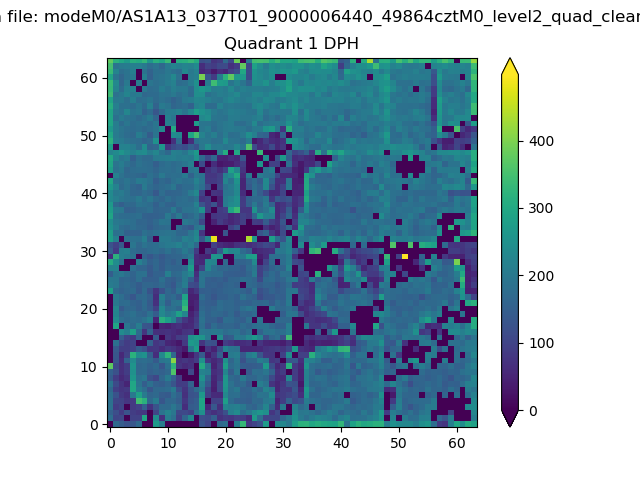 |
Quadrant B |
|---|---|---|---|
| Quadrant D | 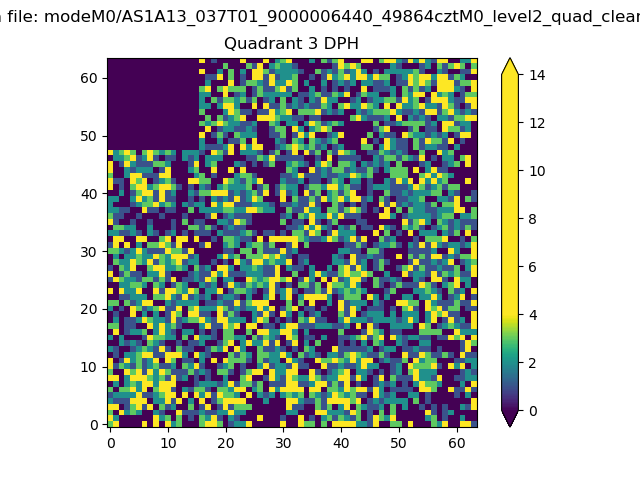 |
 |
Quadrant C |
| Plot type | Count rate plots | Images |
|---|---|---|
| Comparison with Poisson distribution Blue bars denote a histogram of data divided into 1 sec bins. Red curve is a Poisson curve with rate = median count rate of data. |
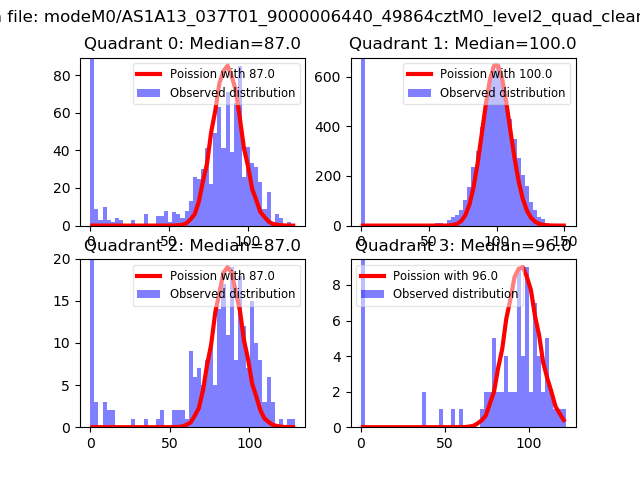 |
 |
| Quadrant-wise count rates Data is divided into 100 sec bins |
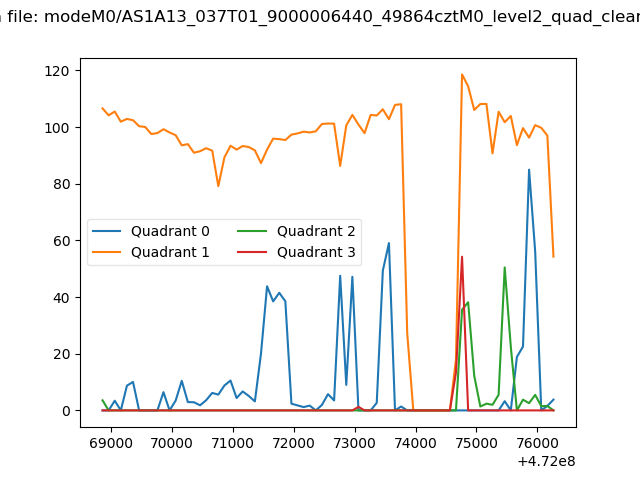 |
|
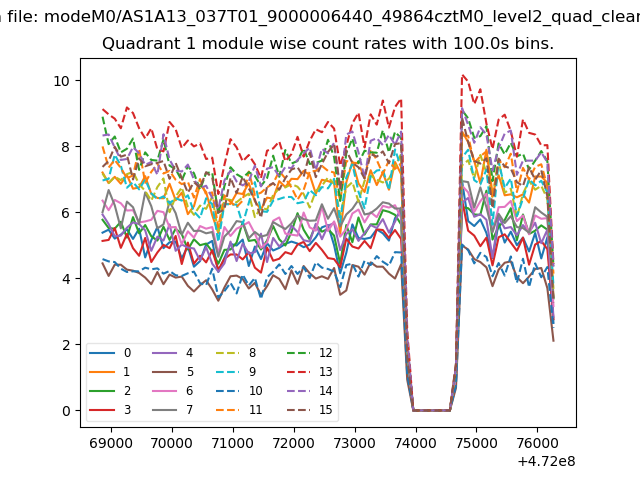
| Module-wise count rates for Quadrant A Data is divided into 100 sec bins |
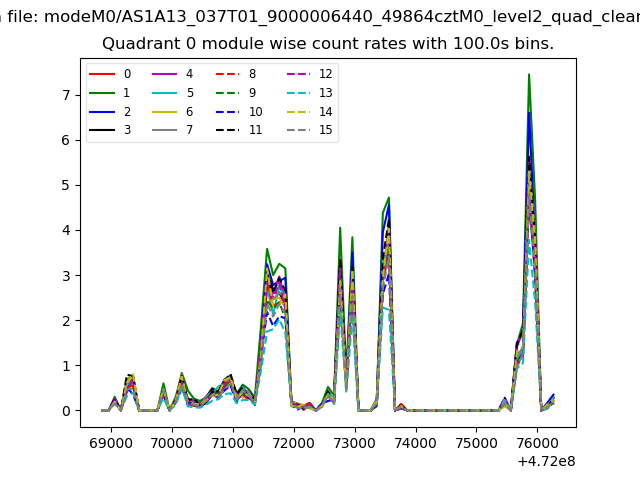 |
 |
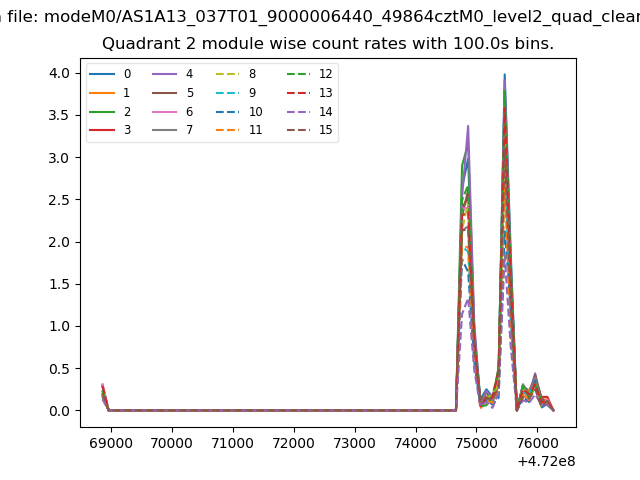
| Module-wise count rates for Quadrant B Data is divided into 100 sec bins |
 |
 |
| Module-wise count rates for Quadrant C Data is divided into 100 sec bins |
 |
 |
| Module-wise count rates for Quadrant D Data is divided into 100 sec bins |
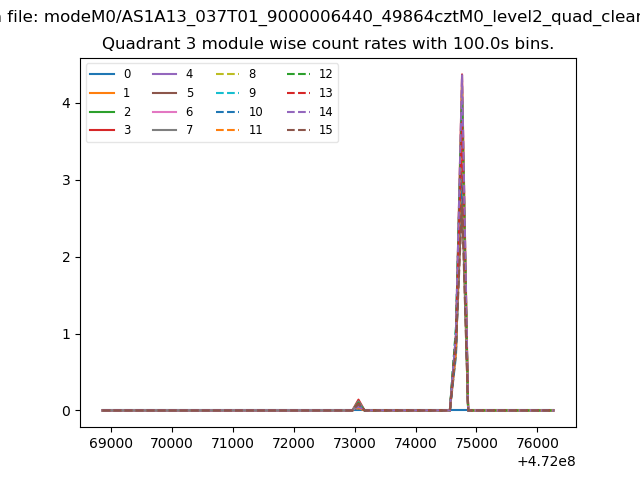 |
 |
| Parameter | Plot |
|---|---|
| CZT HV Monitor | 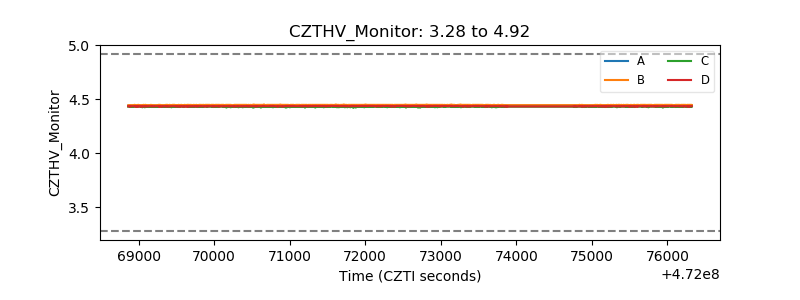 |
| D_VDD | 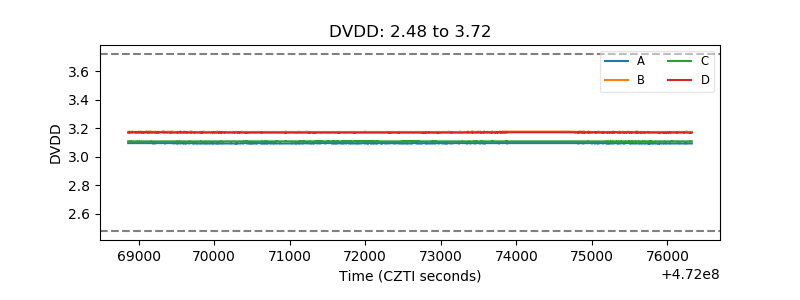 |
| Temperature 1 | 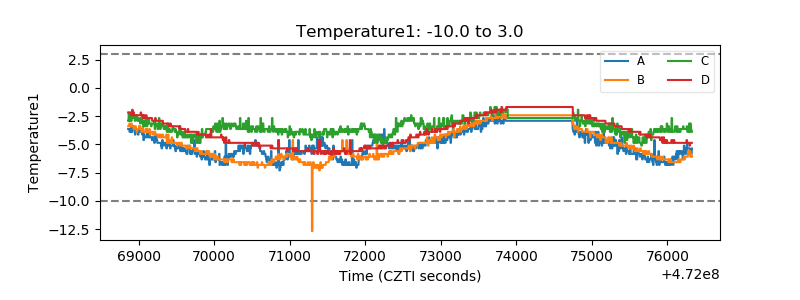 |
| Veto HV Monitor | 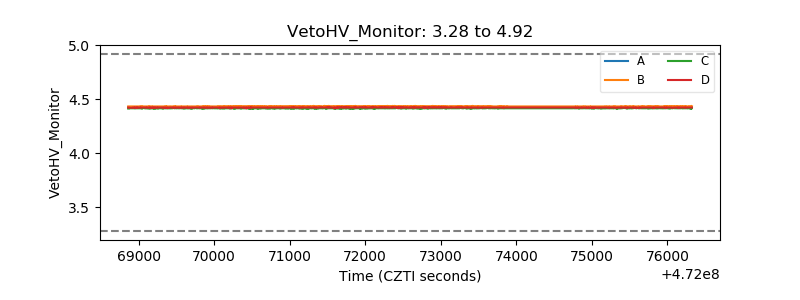 |
| Veto LLD | 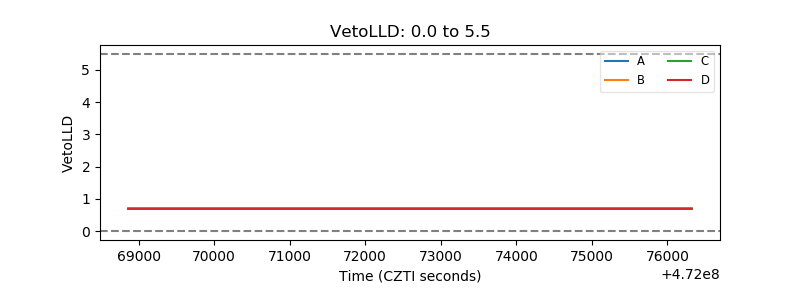 |
| Alpha Counter | 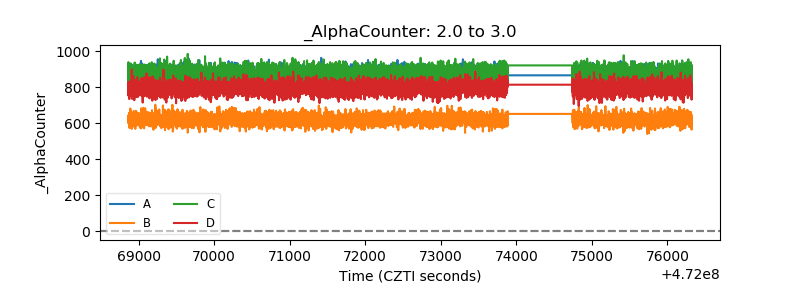 |
| _CPM_Rate | 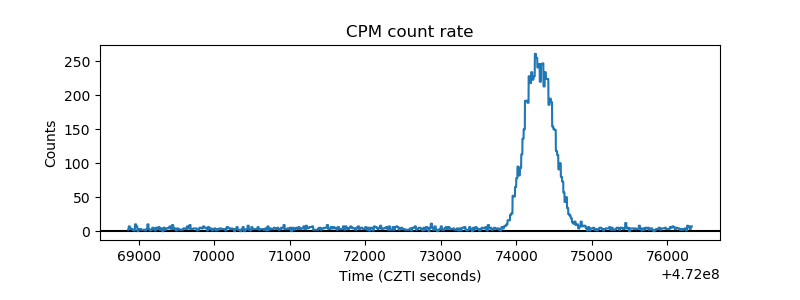 |
| CZT Counter | 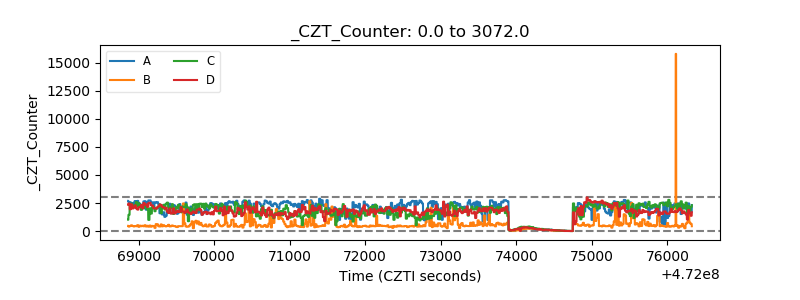 |
| +2.5 Volts monitor | 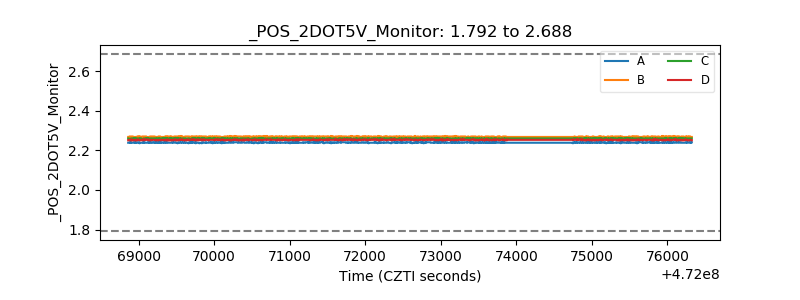 |
| +5 Volts monitor | 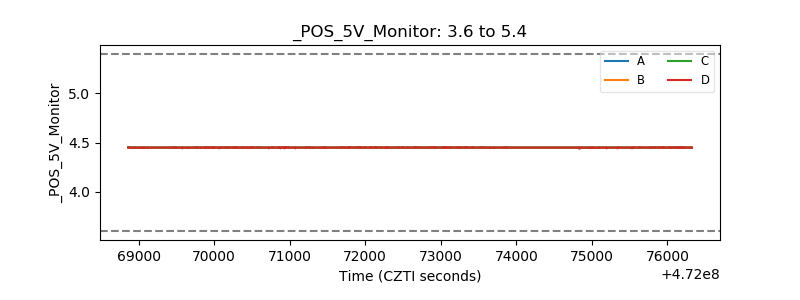 |
| _ROLL_ROT | 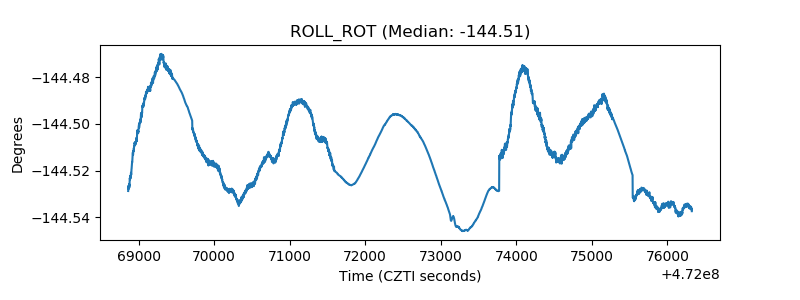 |
| _Roll_DEC | 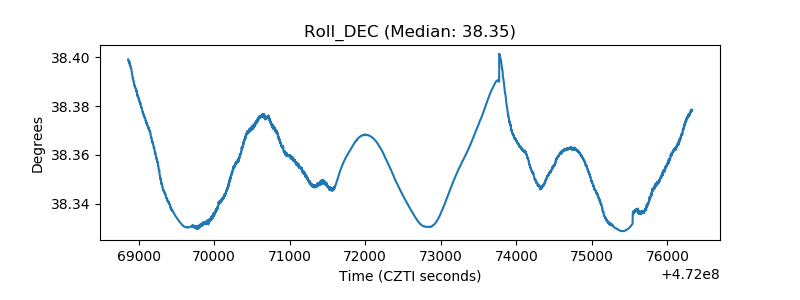 |
| _Roll_RA | 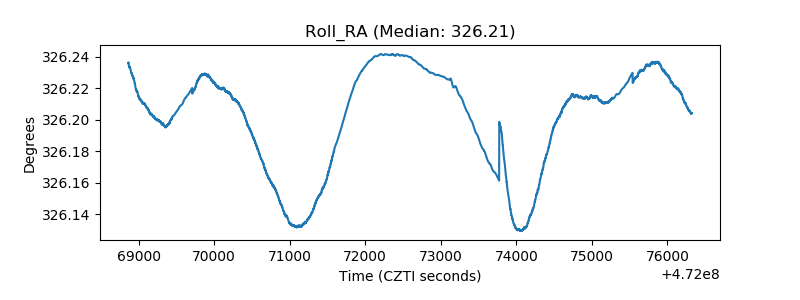 |
| Veto Counter | 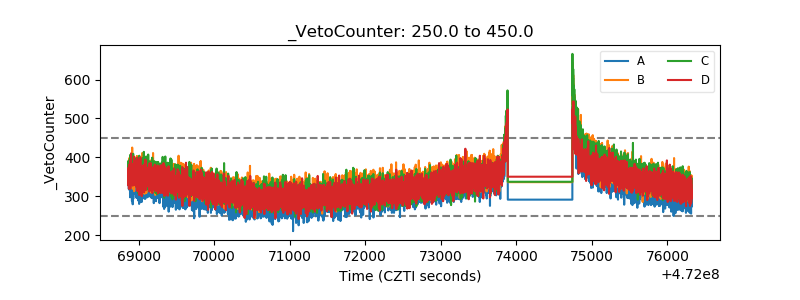 |