| Param | Original file | Final file |
|---|---|---|
| Filename | modeM0/AS1A13_037T01_9000006440_49866cztM0_level2.fits | modeM0/AS1A13_037T01_9000006440_49866cztM0_level2_quad_clean.evt |
| Size (bytes) | 1,118,525,760 | 35,637,120 |
| Size | 1.0 GB | 34.0 MB |
| Events in quadrant A | 12,920,737 | 78,435 |
| Events in quadrant B | 4,632,072 | 570,907 |
| Events in quadrant C | 11,964,881 | 9,227 |
| Events in quadrant D | 11,422,964 | 1,872 |
| Mode M9 | |||
|---|---|---|---|
| Quadrant | BADHDUFLAG | Total packets | Discarded packets |
| A | 0 | 10 | 0 |
| B | 0 | 10 | 0 |
| C | 0 | 10 | 0 |
| D | 0 | 10 | 0 |
| Mode SS | |||
|---|---|---|---|
| Quadrant | BADHDUFLAG | Total packets | Discarded packets |
| A | 0 | 124 | 0 |
| B | 0 | 124 | 0 |
| C | 0 | 124 | 0 |
| D | 0 | 124 | 0 |
| Mode M0 | |||
|---|---|---|---|
| Quadrant | BADHDUFLAG | Total packets | Discarded packets |
| A | 0 | 42486 | 2 |
| B | 0 | 17906 | 1 |
| C | 0 | 39677 | 1 |
| D | 0 | 38118 | 1 |
| Quadrant | Total seconds | Saturated seconds | Saturation percentage |
|---|---|---|---|
| A | 5980 | 5251 | 87.809365% |
| B | 5980 | 504 | 8.428094% |
| C | 5980 | 5904 | 98.729097% |
| D | 5980 | 5966 | 99.765886% |
Noise dominated data is calculated using 1-second bins in cleaned event files. If a bin has >2000 counts, and if more than 50% of those come from <1% of pixels, then it is considered to be noise-dominated and hence unusable.
| Quadrant | # 1 sec bins | Bins with >0 counts | Bins with >2000 counts | High rate bins dominated by noise | Noise dominated (total time) | Noise dominated (detector-on time) | Marked lightcurve |
|---|---|---|---|---|---|---|---|
| A | 7009 | 5979 | 4210 | 4210 | 60.07% | 70.41% | 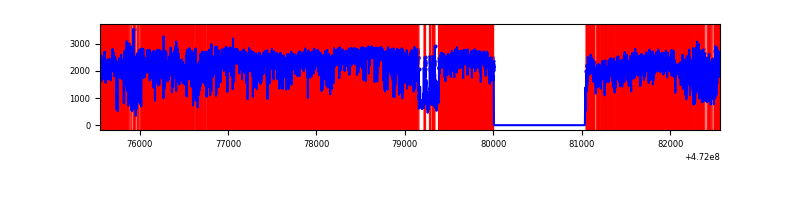 |
| B | 7009 | 5979 | 375 | 375 | 5.35% | 6.27% | 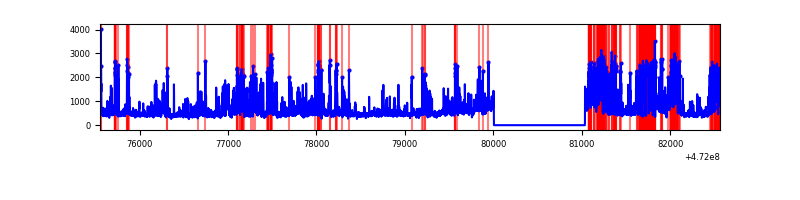 |
| C | 7009 | 5979 | 3471 | 3471 | 49.52% | 58.05% | 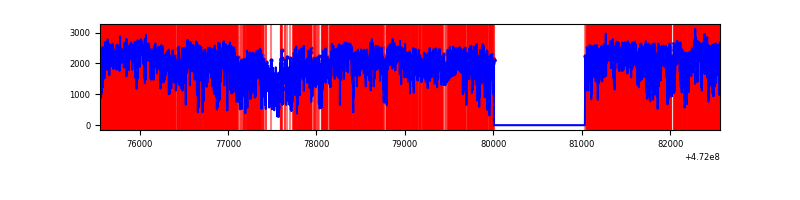 |
| D | 7009 | 5979 | 2085 | 2085 | 29.75% | 34.87% | 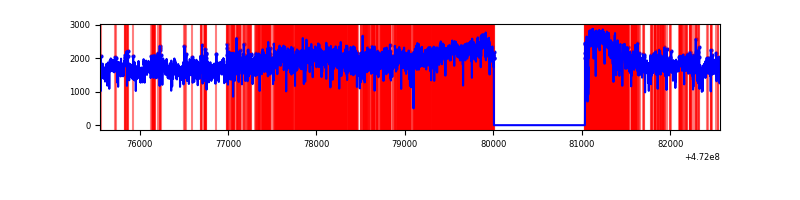 |
Top three noisy pixels from each quadrant. If the there are fewer than three noisy pixels in the level2.evt file, extra rows are filled as -1
| Pixel properties | Quadrant properties | ||||||
|---|---|---|---|---|---|---|---|
| Quadrant | DetID | PixID | Counts | Sigma | Mean | Median | Sigma |
| A | 4 | 4 | 9189506 | 127145.47 | 269 | 261 | 72.3 |
| A | 0 | 98 | 1290390 | 17850.66 | 269 | 261 | 72.3 |
| A | 8 | 62 | 418297 | 5784.09 | 269 | 261 | 72.3 |
| B | 4 | 206 | 864283 | 6588.65 | 614 | 594 | 131.1 |
| B | 5 | 172 | 558897 | 4259.02 | 614 | 594 | 131.1 |
| B | 0 | 229 | 411818 | 3137.02 | 614 | 594 | 131.1 |
| C | 4 | 111 | 2965749 | 54479.08 | 132 | 129 | 54.4 |
| C | 15 | 230 | 2920698 | 53651.48 | 132 | 129 | 54.4 |
| C | 15 | 197 | 1259076 | 23127.13 | 132 | 129 | 54.4 |
| D | 7 | 61 | 5628985 | 188058.71 | 77 | 72 | 29.9 |
| D | 8 | 129 | 3803116 | 127057.48 | 77 | 72 | 29.9 |
| D | 15 | 185 | 491069 | 16403.91 | 77 | 72 | 29.9 |
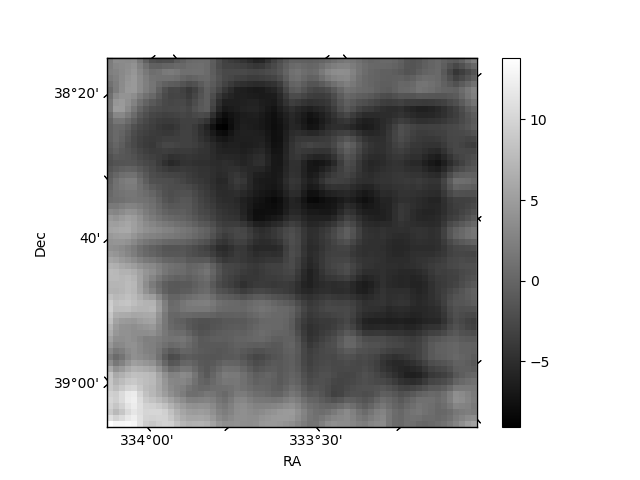
Histogram calculated using DETX and DETY for each event in the final _common_clean file
| Quadrant A | 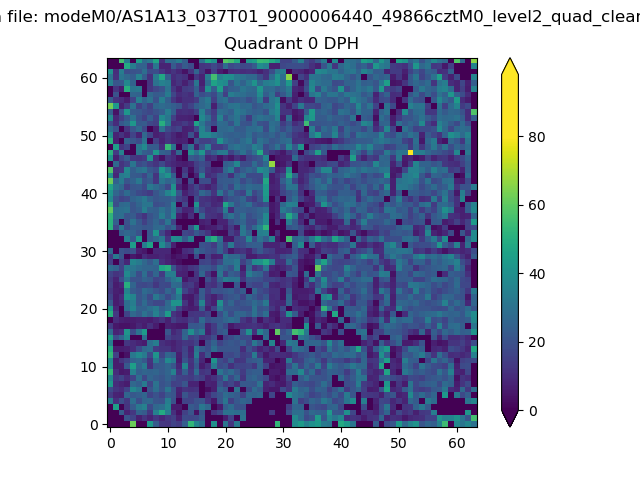 |
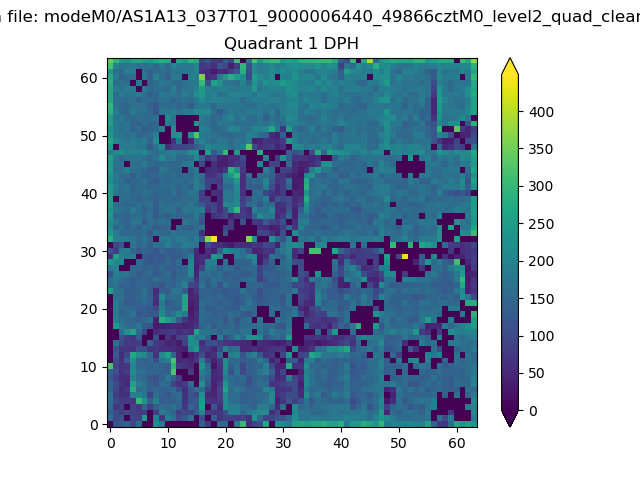 |
Quadrant B |
|---|---|---|---|
| Quadrant D |  |
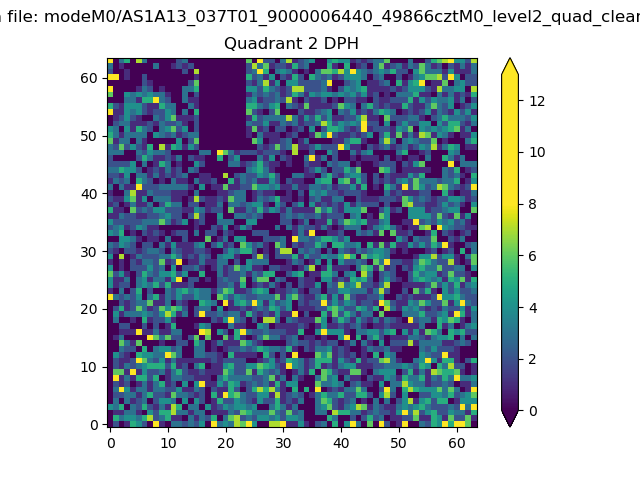 |
Quadrant C |
| Plot type | Count rate plots | Images |
|---|---|---|
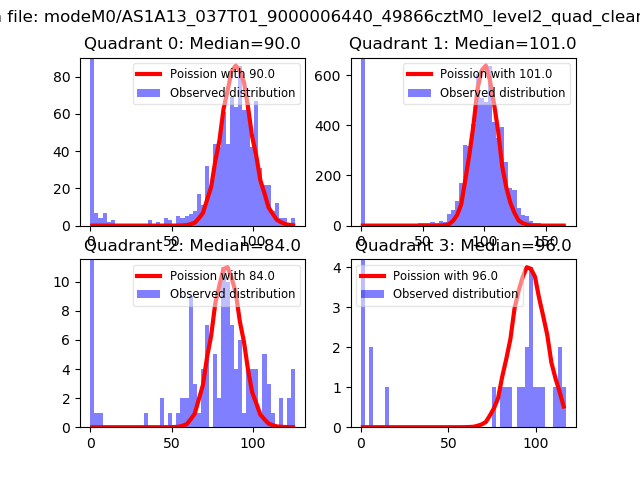
| Comparison with Poisson distribution Blue bars denote a histogram of data divided into 1 sec bins. Red curve is a Poisson curve with rate = median count rate of data. |
 |
 |
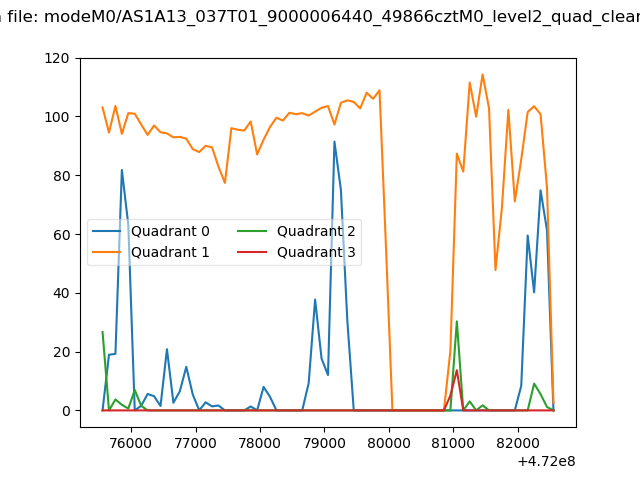
| Quadrant-wise count rates Data is divided into 100 sec bins |
 |
|
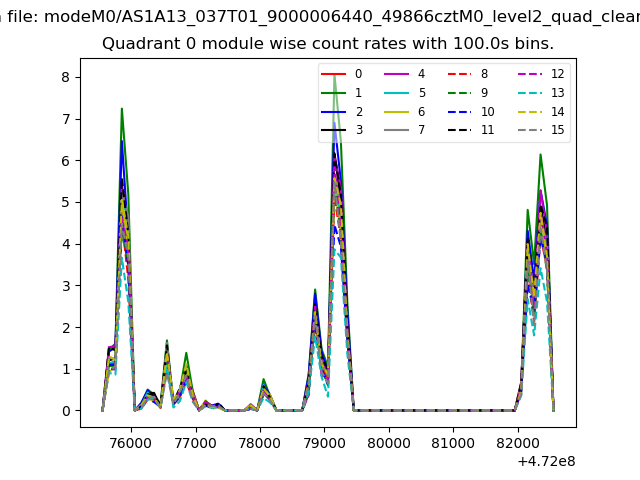
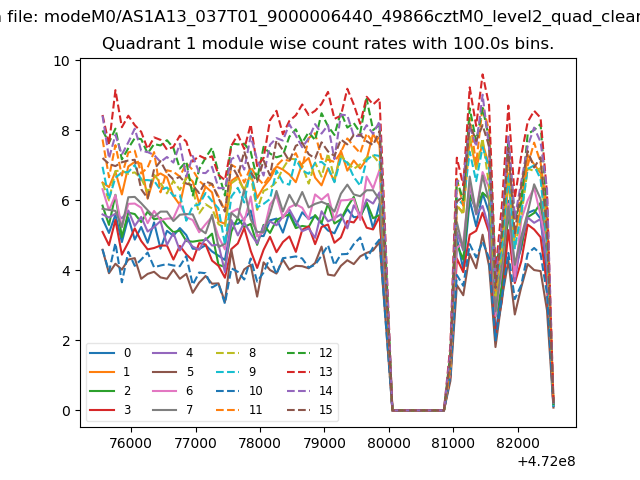
| Module-wise count rates for Quadrant A Data is divided into 100 sec bins |
 |
 |
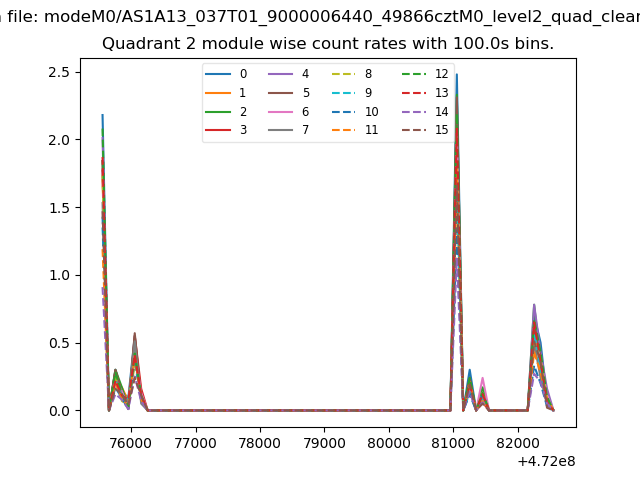
| Module-wise count rates for Quadrant B Data is divided into 100 sec bins |
 |
 |
| Module-wise count rates for Quadrant C Data is divided into 100 sec bins |
 |
 |
| Module-wise count rates for Quadrant D Data is divided into 100 sec bins |
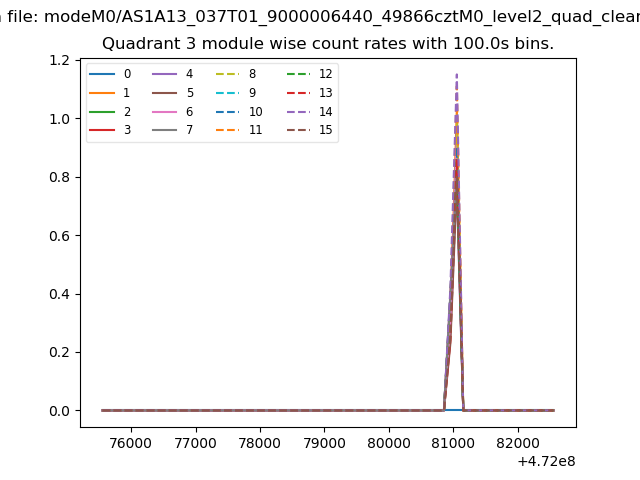 |
 |
| Parameter | Plot |
|---|---|
| CZT HV Monitor | 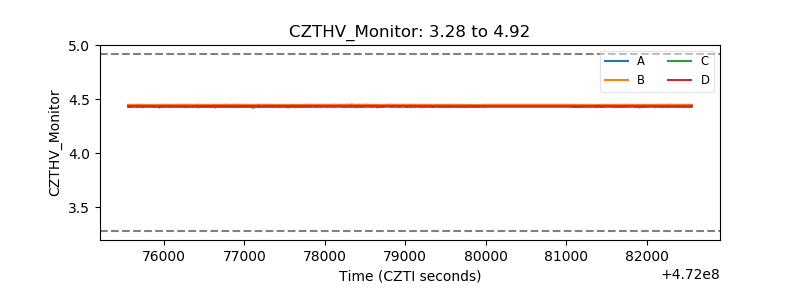 |
| D_VDD | 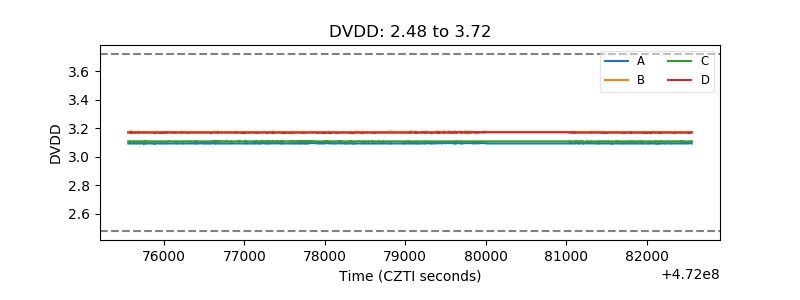 |
| Temperature 1 | 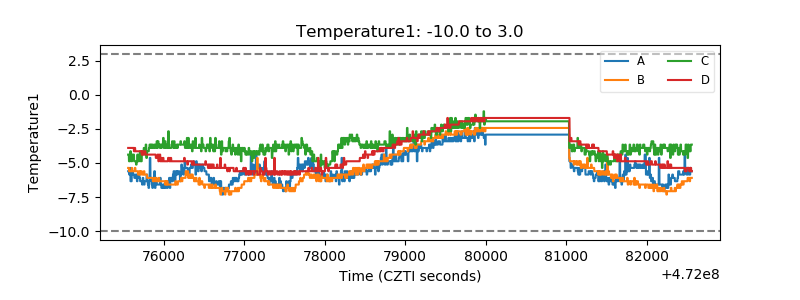 |
| Veto HV Monitor | 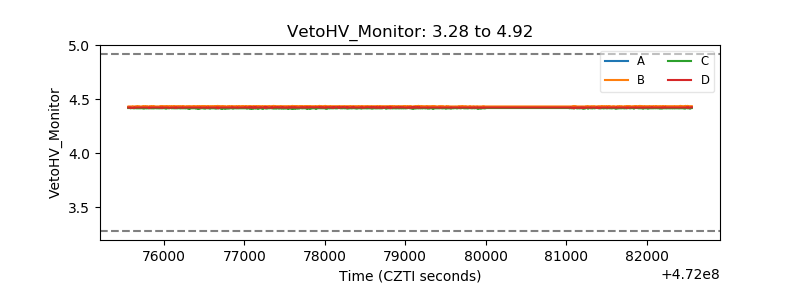 |
| Veto LLD | 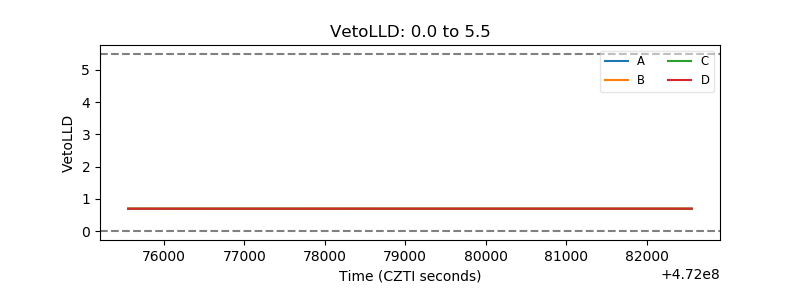 |
| Alpha Counter | 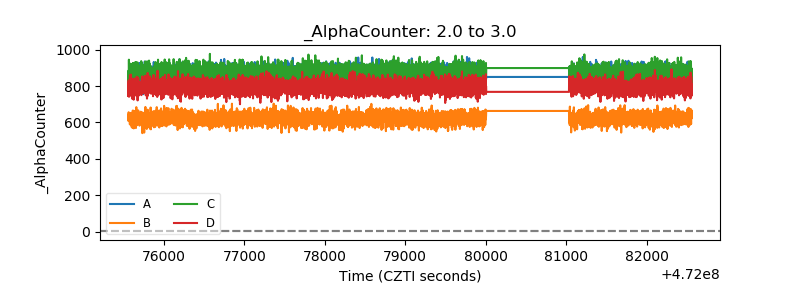 |
| _CPM_Rate | 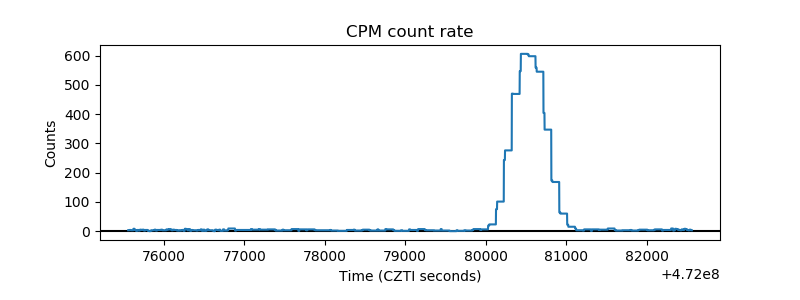 |
| CZT Counter | 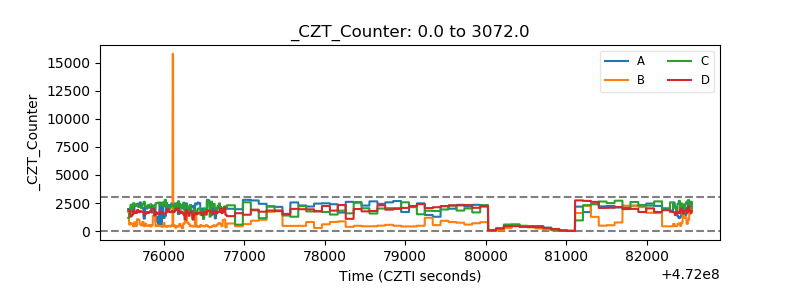 |
| +2.5 Volts monitor | 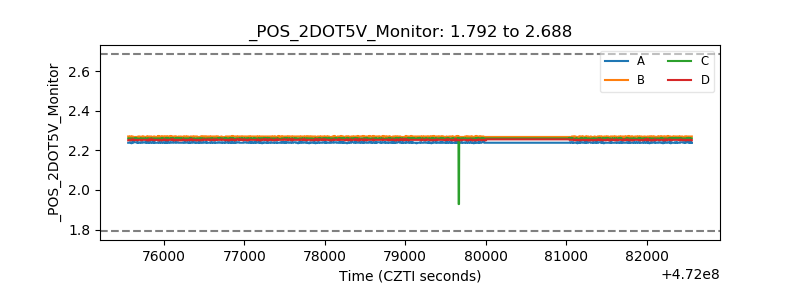 |
| +5 Volts monitor | 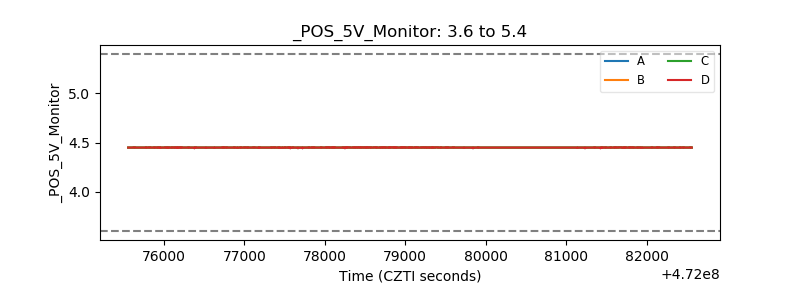 |
| _ROLL_ROT | 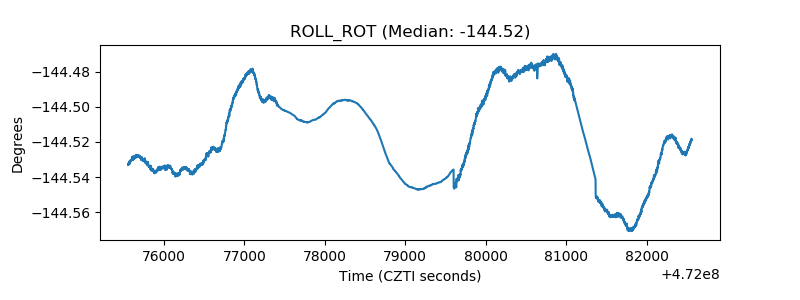 |
| _Roll_DEC | 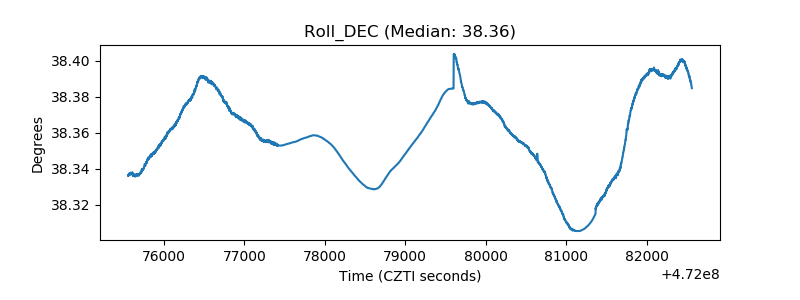 |
| _Roll_RA | 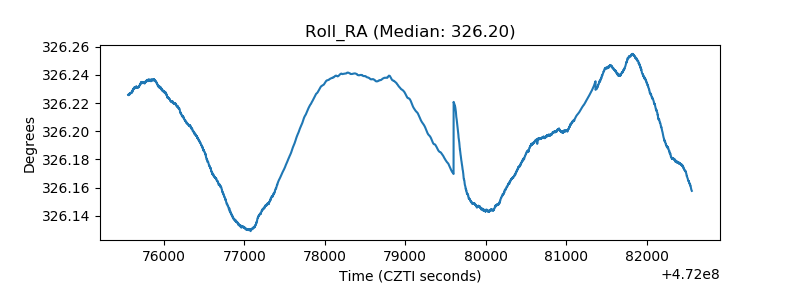 |
| Veto Counter | 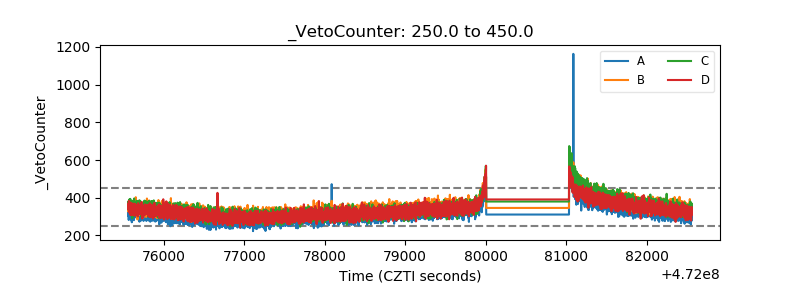 |