| Param | Original file | Final file |
|---|---|---|
| Filename | modeM0/AS1A13_037T01_9000006440_49867cztM0_level2.fits | modeM0/AS1A13_037T01_9000006440_49867cztM0_level2_quad_clean.evt |
| Size (bytes) | 1,067,065,920 | 44,015,040 |
| Size | 1017.6 MB | 42.0 MB |
| Events in quadrant A | 12,083,859 | 278,014 |
| Events in quadrant B | 4,263,489 | 616,728 |
| Events in quadrant C | 9,865,582 | 4,187 |
| Events in quadrant D | 12,807,450 | 2,516 |
| Mode M9 | |||
|---|---|---|---|
| Quadrant | BADHDUFLAG | Total packets | Discarded packets |
| A | 0 | 11 | 0 |
| B | 0 | 11 | 0 |
| C | 0 | 11 | 0 |
| D | 0 | 11 | 0 |
| Mode SS | |||
|---|---|---|---|
| Quadrant | BADHDUFLAG | Total packets | Discarded packets |
| A | 0 | 126 | 0 |
| B | 0 | 126 | 0 |
| C | 0 | 126 | 0 |
| D | 0 | 126 | 0 |
| Mode M0 | |||
|---|---|---|---|
| Quadrant | BADHDUFLAG | Total packets | Discarded packets |
| A | 0 | 40103 | 1 |
| B | 0 | 16874 | 1 |
| C | 0 | 33638 | 3 |
| D | 0 | 42270 | 1 |
| Quadrant | Total seconds | Saturated seconds | Saturation percentage |
|---|---|---|---|
| A | 6171 | 3744 | 60.670880% |
| B | 6171 | 422 | 6.838438% |
| C | 6171 | 6143 | 99.546265% |
| D | 6171 | 6157 | 99.773132% |
Noise dominated data is calculated using 1-second bins in cleaned event files. If a bin has >2000 counts, and if more than 50% of those come from <1% of pixels, then it is considered to be noise-dominated and hence unusable.
| Quadrant | # 1 sec bins | Bins with >0 counts | Bins with >2000 counts | High rate bins dominated by noise | Noise dominated (total time) | Noise dominated (detector-on time) | Marked lightcurve |
|---|---|---|---|---|---|---|---|
| A | 7286 | 6171 | 3337 | 3337 | 45.80% | 54.08% | 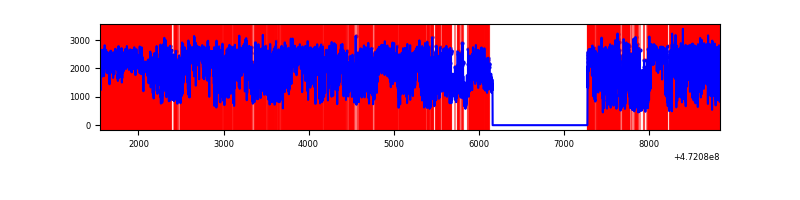 |
| B | 7286 | 6171 | 311 | 311 | 4.27% | 5.04% | 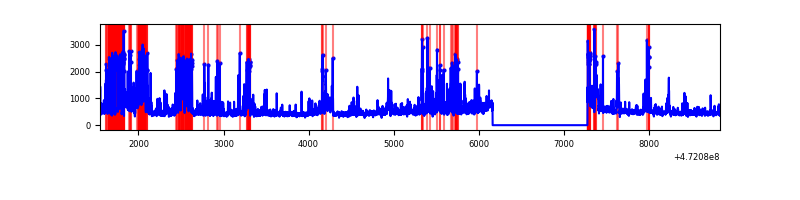 |
| C | 7285 | 6170 | 1982 | 1982 | 27.21% | 32.12% | 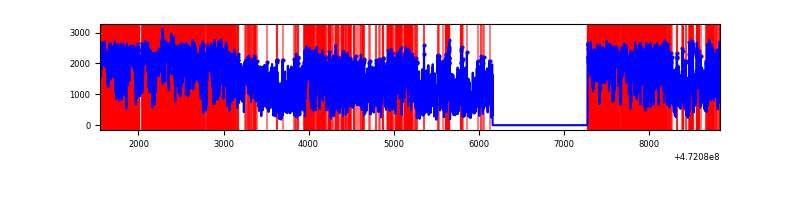 |
| D | 7285 | 6170 | 3795 | 3795 | 52.09% | 61.51% | 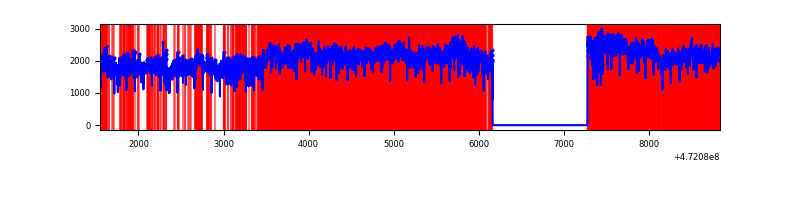 |
Top three noisy pixels from each quadrant. If the there are fewer than three noisy pixels in the level2.evt file, extra rows are filled as -1
| Pixel properties | Quadrant properties | ||||||
|---|---|---|---|---|---|---|---|
| Quadrant | DetID | PixID | Counts | Sigma | Mean | Median | Sigma |
| A | 4 | 4 | 7941075 | 68372.79 | 461 | 450 | 116.1 |
| A | 8 | 8 | 719161 | 6188.46 | 461 | 450 | 116.1 |
| A | 8 | 62 | 497592 | 4280.64 | 461 | 450 | 116.1 |
| B | 4 | 206 | 590756 | 4174.4 | 655 | 632 | 141.4 |
| B | 5 | 172 | 361384 | 2551.88 | 655 | 632 | 141.4 |
| B | 0 | 229 | 131797 | 927.83 | 655 | 632 | 141.4 |
| C | 4 | 111 | 4725525 | 126840.38 | 81 | 78 | 37.3 |
| C | 15 | 230 | 2034870 | 54617.86 | 81 | 78 | 37.3 |
| C | 15 | 196 | 525234 | 14096.23 | 81 | 78 | 37.3 |
| D | 7 | 61 | 7298942 | 189046.91 | 103 | 98 | 38.6 |
| D | 8 | 129 | 2545626 | 65931.56 | 103 | 98 | 38.6 |
| D | 15 | 185 | 1008836 | 26127.26 | 103 | 98 | 38.6 |
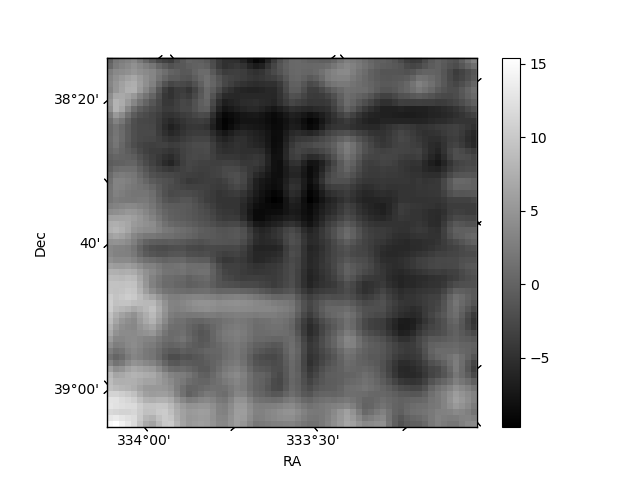
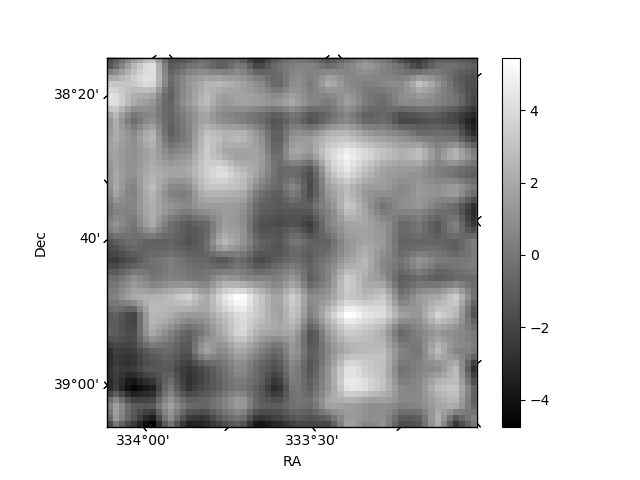
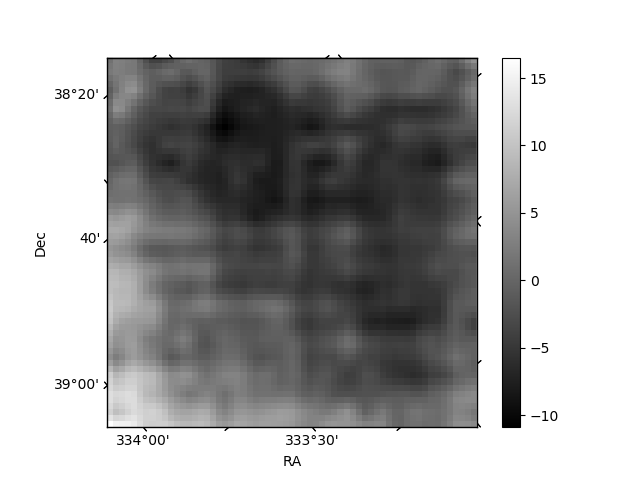
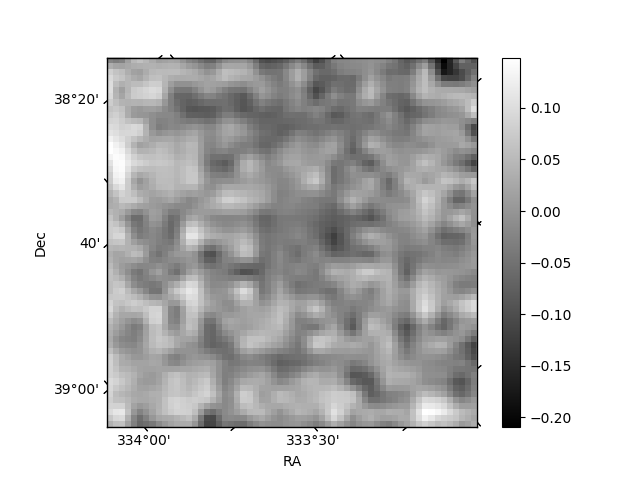
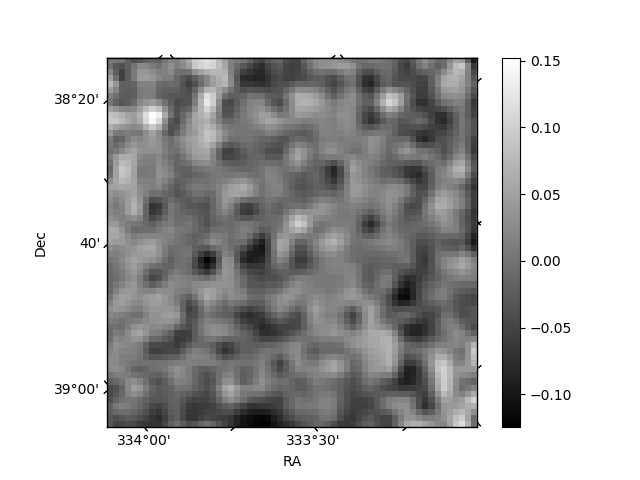
Histogram calculated using DETX and DETY for each event in the final _common_clean file
| Quadrant A | 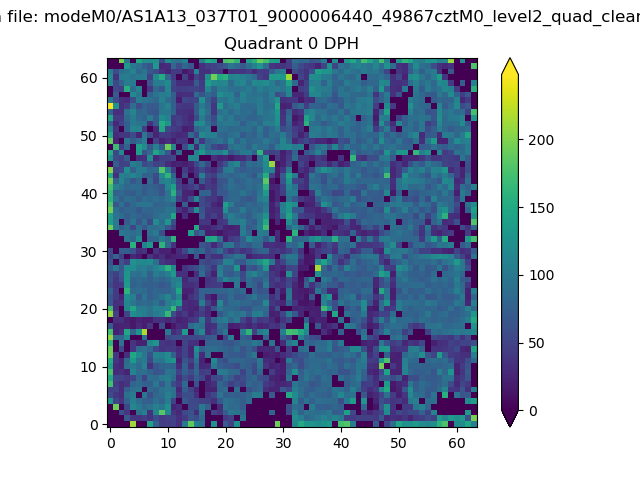 |
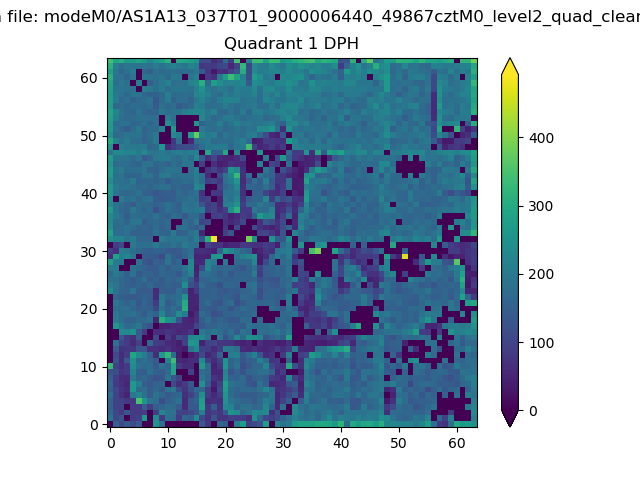 |
Quadrant B |
|---|---|---|---|
| Quadrant D | 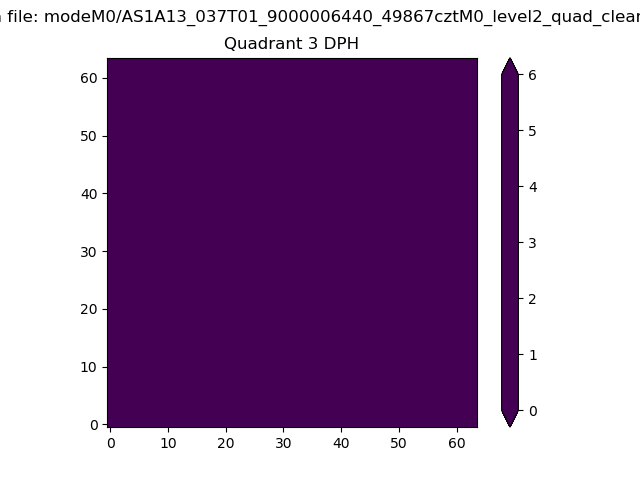 |
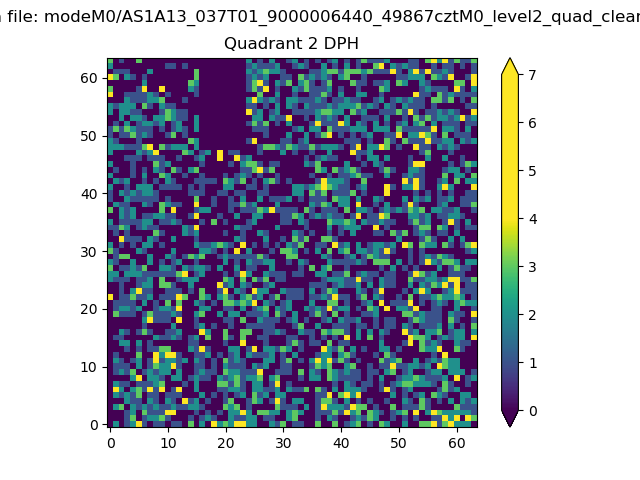 |
Quadrant C |
| Plot type | Count rate plots | Images |
|---|---|---|
| Comparison with Poisson distribution Blue bars denote a histogram of data divided into 1 sec bins. Red curve is a Poisson curve with rate = median count rate of data. |
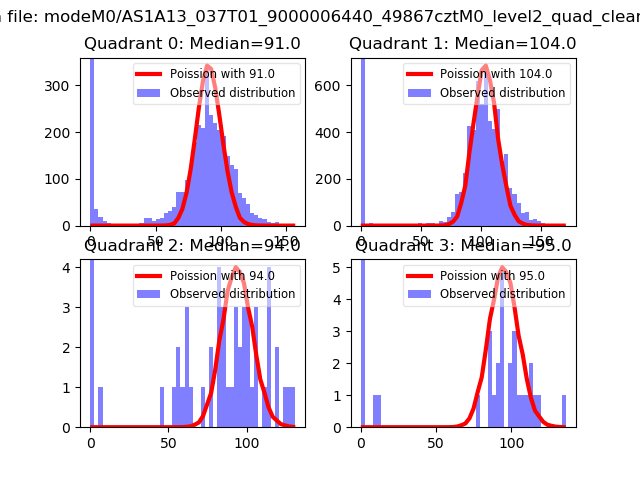 |
 |
| Quadrant-wise count rates Data is divided into 100 sec bins |
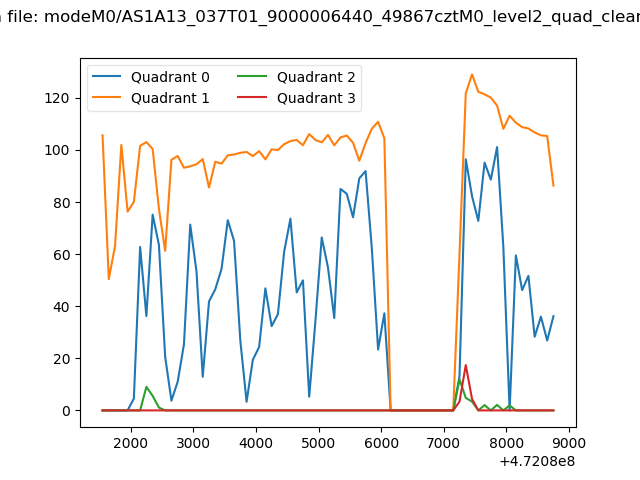 |
|
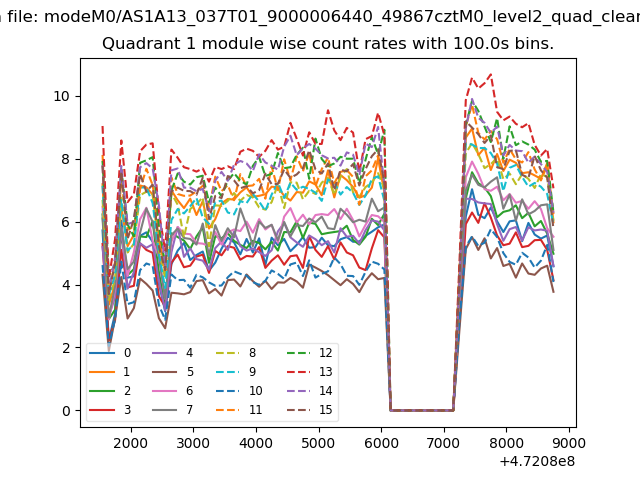
| Module-wise count rates for Quadrant A Data is divided into 100 sec bins |
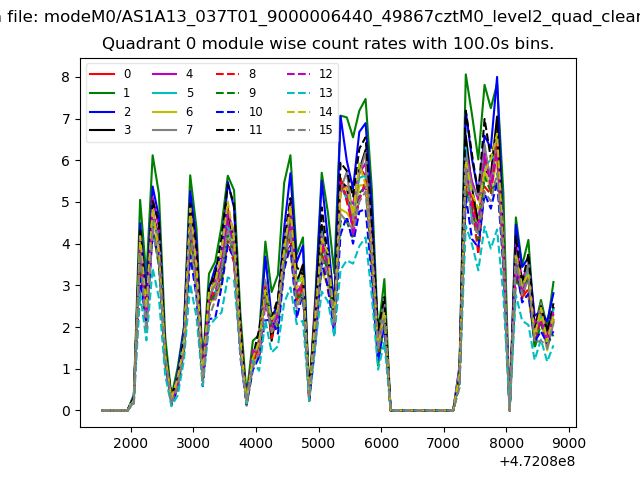 |
 |
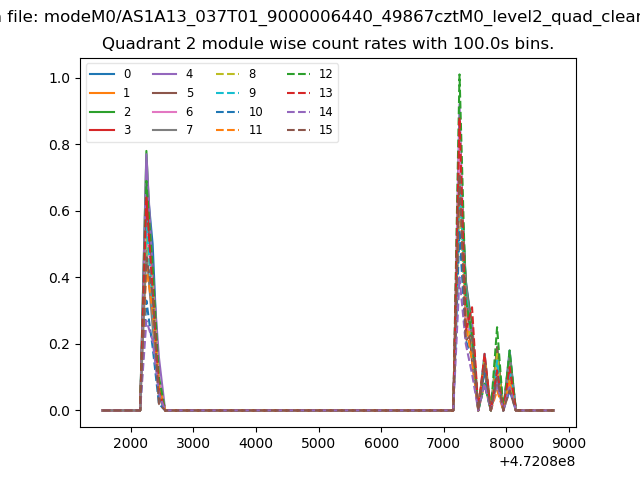
| Module-wise count rates for Quadrant B Data is divided into 100 sec bins |
 |
 |
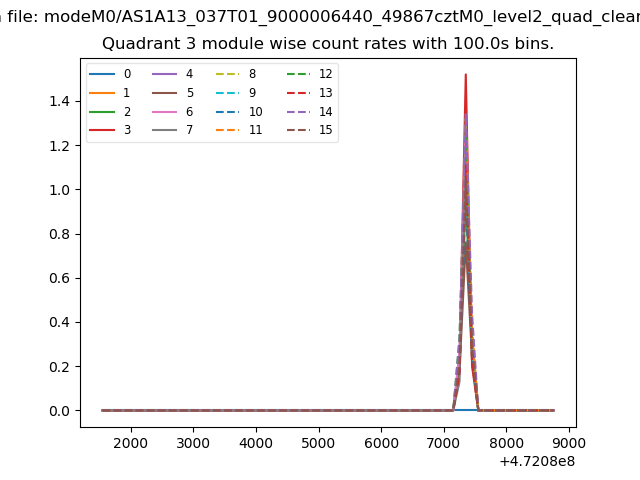
| Module-wise count rates for Quadrant C Data is divided into 100 sec bins |
 |
 |
| Module-wise count rates for Quadrant D Data is divided into 100 sec bins |
 |
 |
| Parameter | Plot |
|---|---|
| CZT HV Monitor | 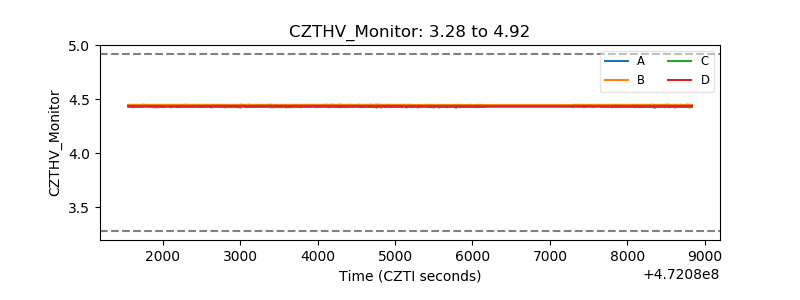 |
| D_VDD | 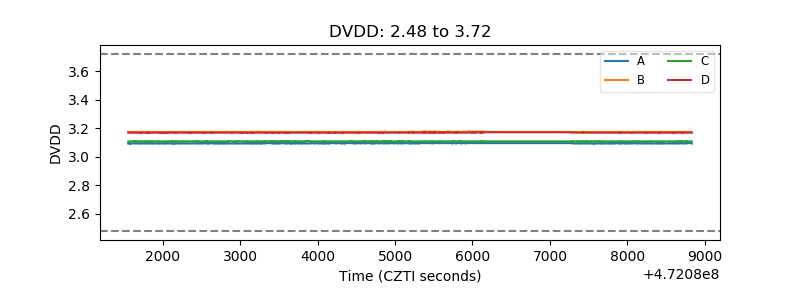 |
| Temperature 1 | 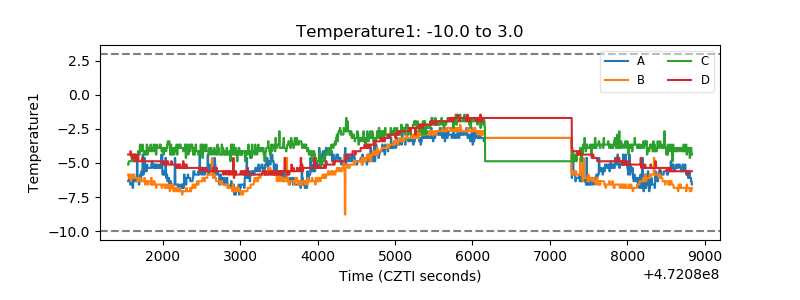 |
| Veto HV Monitor | 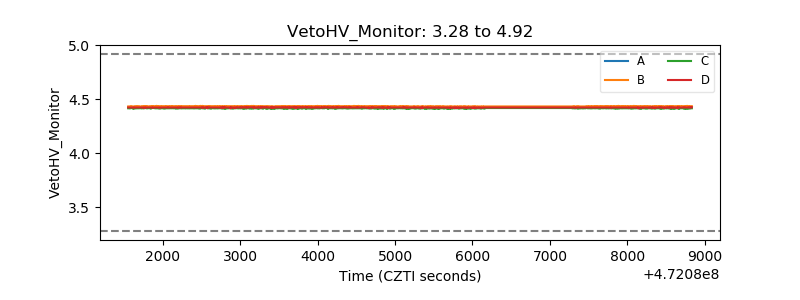 |
| Veto LLD | 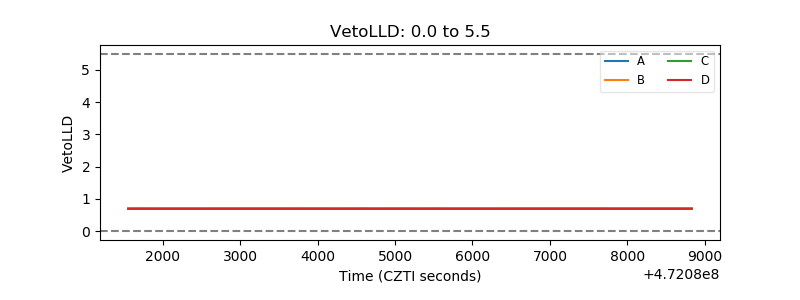 |
| Alpha Counter | 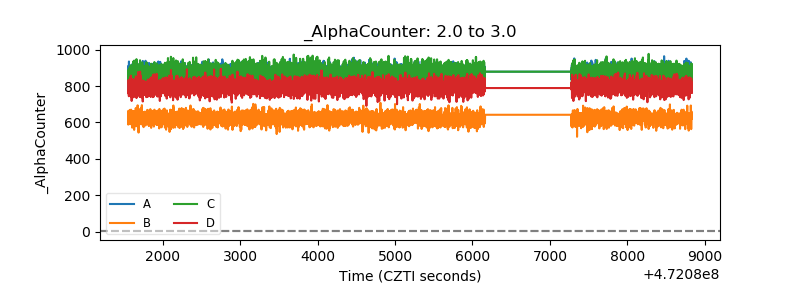 |
| _CPM_Rate | 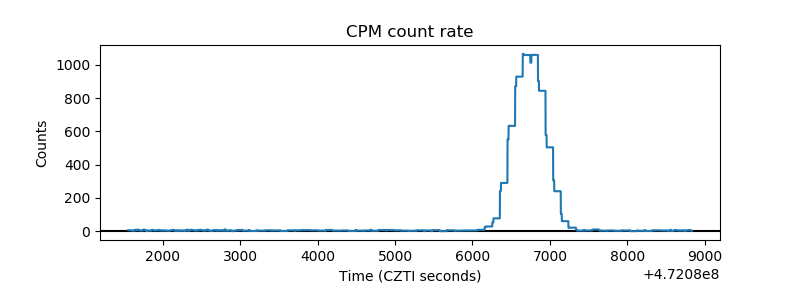 |
| CZT Counter | 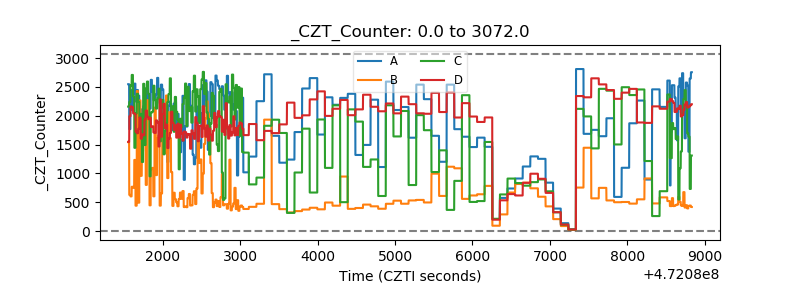 |
| +2.5 Volts monitor | 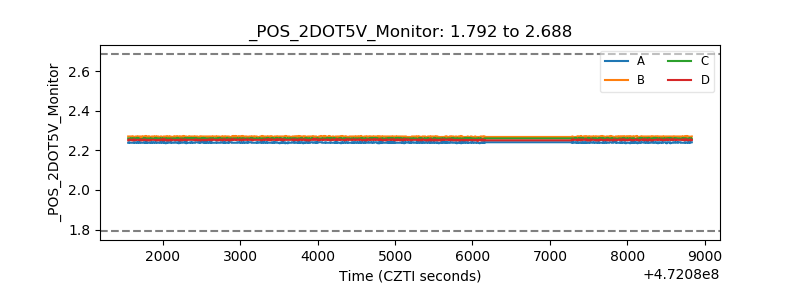 |
| +5 Volts monitor | 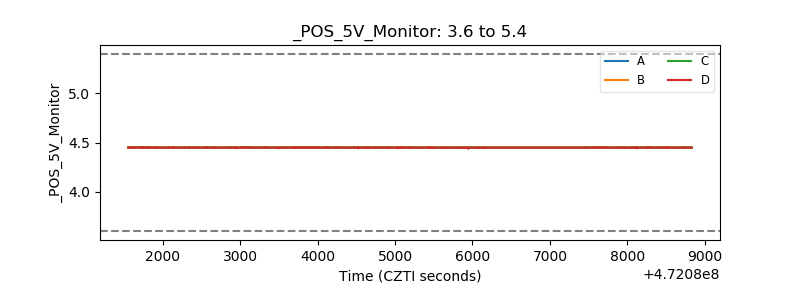 |
| _ROLL_ROT | 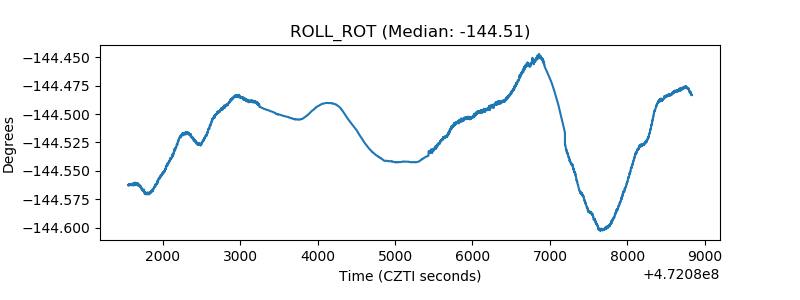 |
| _Roll_DEC | 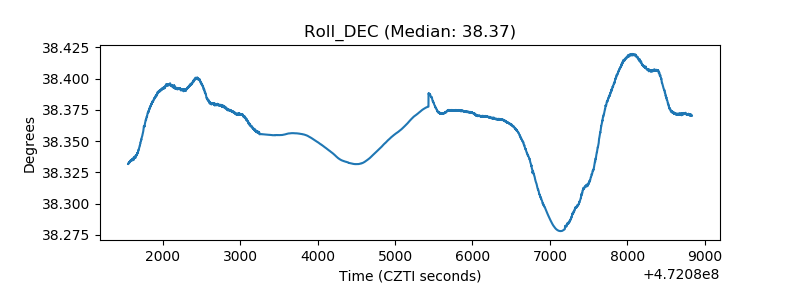 |
| _Roll_RA | 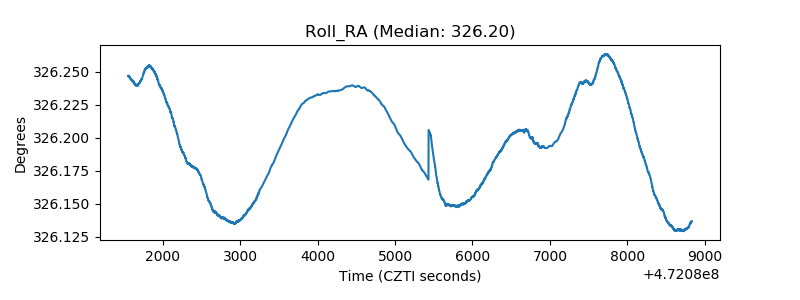 |
| Veto Counter | 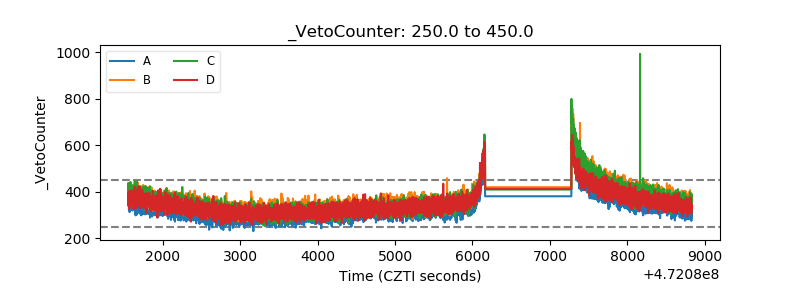 |