| Param | Original file | Final file |
|---|---|---|
| Filename | modeM0/AS1A13_037T01_9000006440_49868cztM0_level2.fits | modeM0/AS1A13_037T01_9000006440_49868cztM0_level2_quad_clean.evt |
| Size (bytes) | 1,062,673,920 | 41,019,840 |
| Size | 1013.4 MB | 39.1 MB |
| Events in quadrant A | 13,331,309 | 146,446 |
| Events in quadrant B | 4,162,119 | 647,327 |
| Events in quadrant C | 9,370,241 | 12,886 |
| Events in quadrant D | 11,999,530 | 9,438 |
| Mode M9 | |||
|---|---|---|---|
| Quadrant | BADHDUFLAG | Total packets | Discarded packets |
| A | 0 | 12 | 0 |
| B | 0 | 12 | 0 |
| C | 0 | 12 | 0 |
| D | 0 | 12 | 0 |
| Mode SS | |||
|---|---|---|---|
| Quadrant | BADHDUFLAG | Total packets | Discarded packets |
| A | 0 | 124 | 0 |
| B | 0 | 124 | 0 |
| C | 0 | 124 | 0 |
| D | 0 | 124 | 0 |
| Mode M0 | |||
|---|---|---|---|
| Quadrant | BADHDUFLAG | Total packets | Discarded packets |
| A | 0 | 43793 | 1 |
| B | 0 | 16552 | 1 |
| C | 0 | 32101 | 1 |
| D | 0 | 39874 | 1 |
| Quadrant | Total seconds | Saturated seconds | Saturation percentage |
|---|---|---|---|
| A | 6093 | 4807 | 78.893813% |
| B | 6094 | 267 | 4.381359% |
| C | 6094 | 6002 | 98.490318% |
| D | 6094 | 6023 | 98.834920% |
Noise dominated data is calculated using 1-second bins in cleaned event files. If a bin has >2000 counts, and if more than 50% of those come from <1% of pixels, then it is considered to be noise-dominated and hence unusable.
| Quadrant | # 1 sec bins | Bins with >0 counts | Bins with >2000 counts | High rate bins dominated by noise | Noise dominated (total time) | Noise dominated (detector-on time) | Marked lightcurve |
|---|---|---|---|---|---|---|---|
| A | 7298 | 6093 | 4432 | 4432 | 60.73% | 72.74% | 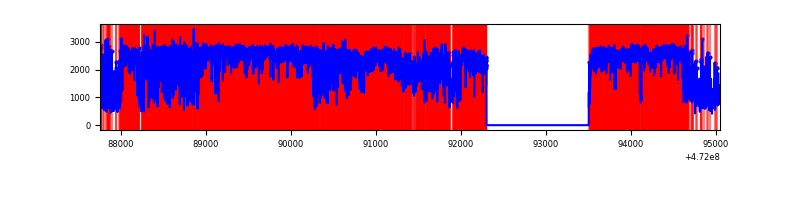 |
| B | 7299 | 6094 | 140 | 140 | 1.92% | 2.30% | 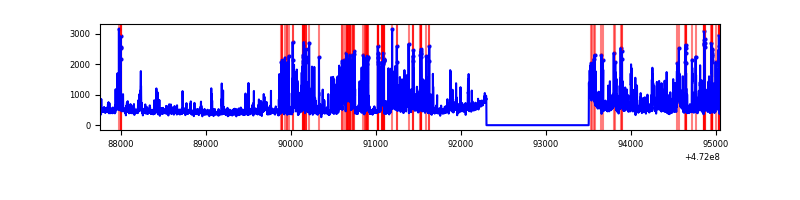 |
| C | 7298 | 6093 | 1698 | 1698 | 23.27% | 27.87% | 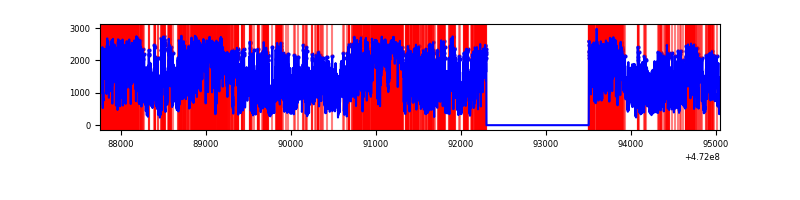 |
| D | 7298 | 6093 | 2661 | 2661 | 36.46% | 43.67% | 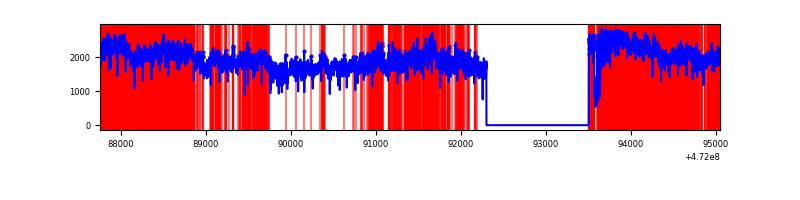 |
Top three noisy pixels from each quadrant. If the there are fewer than three noisy pixels in the level2.evt file, extra rows are filled as -1
| Pixel properties | Quadrant properties | ||||||
|---|---|---|---|---|---|---|---|
| Quadrant | DetID | PixID | Counts | Sigma | Mean | Median | Sigma |
| A | 4 | 4 | 10802445 | 142819.31 | 294 | 287 | 75.6 |
| A | 8 | 62 | 354485 | 4682.98 | 294 | 287 | 75.6 |
| A | 3 | 14 | 119354 | 1574.22 | 294 | 287 | 75.6 |
| B | 4 | 206 | 733092 | 5167.96 | 667 | 645 | 141.7 |
| B | 0 | 213 | 191401 | 1345.93 | 667 | 645 | 141.7 |
| B | 0 | 229 | 183336 | 1289.02 | 667 | 645 | 141.7 |
| C | 4 | 111 | 4978713 | 203658.33 | 69 | 68 | 24.4 |
| C | 15 | 196 | 738439 | 30204.08 | 69 | 68 | 24.4 |
| C | 15 | 197 | 659767 | 26985.9 | 69 | 68 | 24.4 |
| D | 7 | 61 | 8465161 | 231603.66 | 111 | 106 | 36.5 |
| D | 15 | 185 | 1048205 | 28675.96 | 111 | 106 | 36.5 |
| D | 8 | 129 | 798454 | 21842.78 | 111 | 106 | 36.5 |
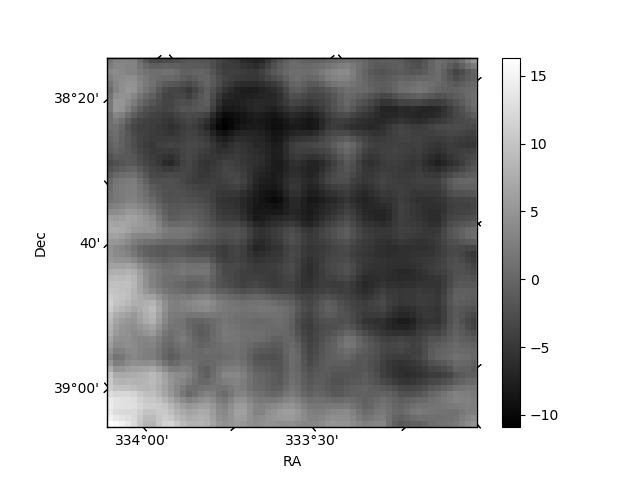
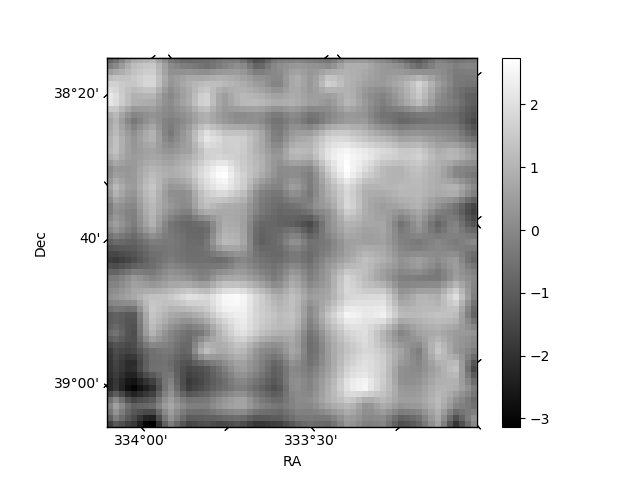
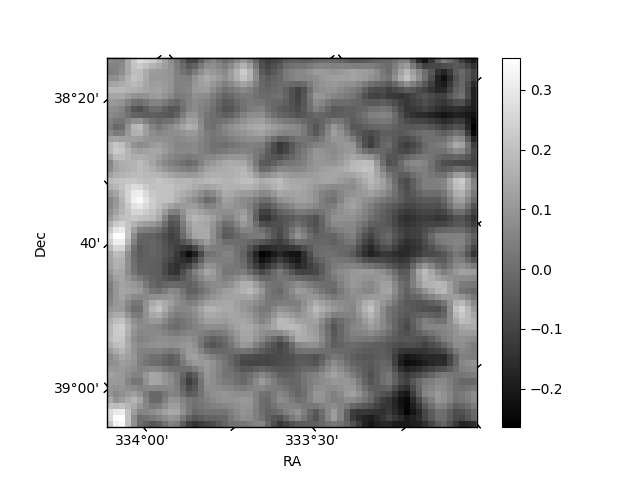
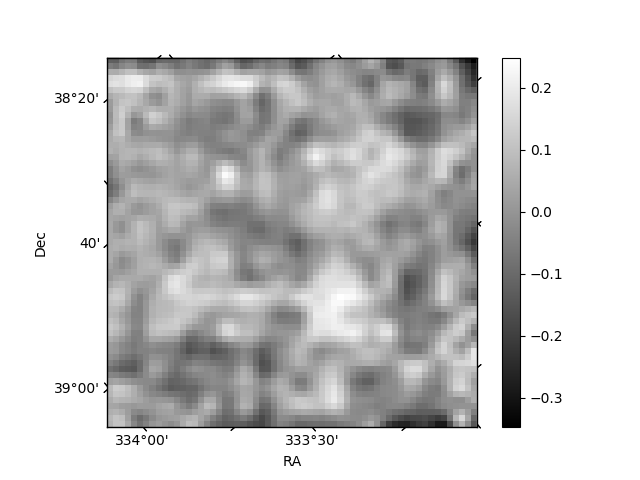
Histogram calculated using DETX and DETY for each event in the final _common_clean file
| Quadrant A | 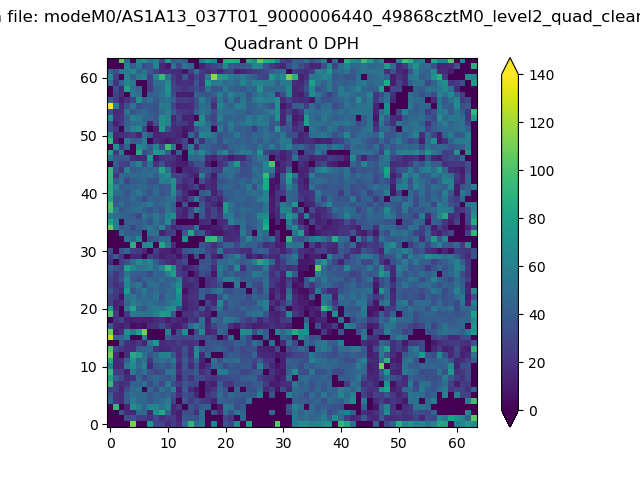 |
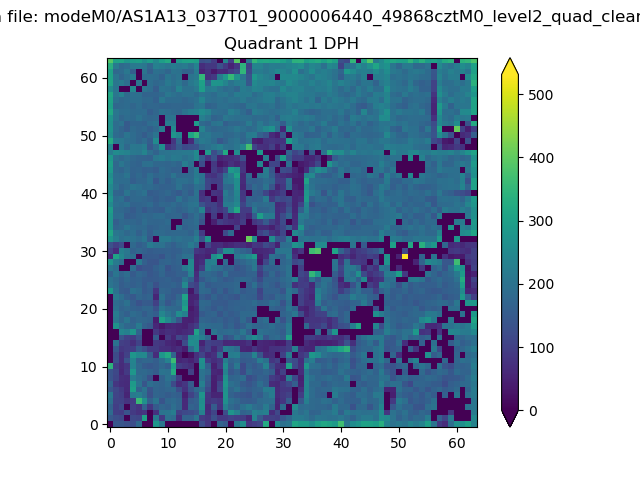 |
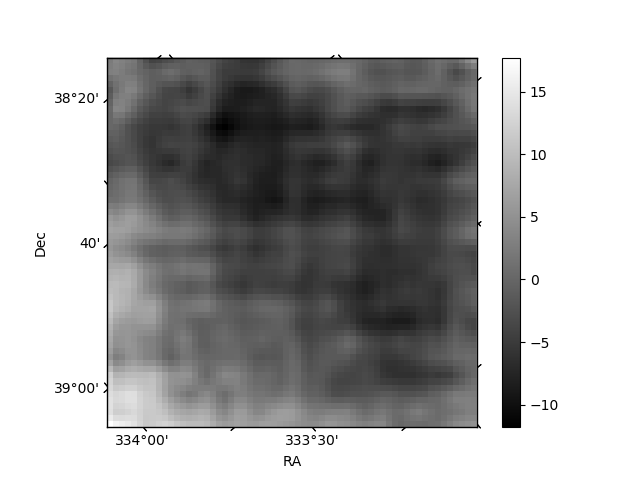
Quadrant B |
|---|---|---|---|
| Quadrant D | 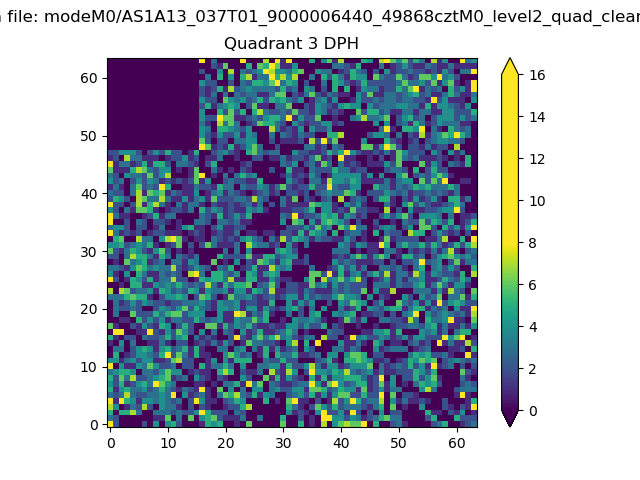 |
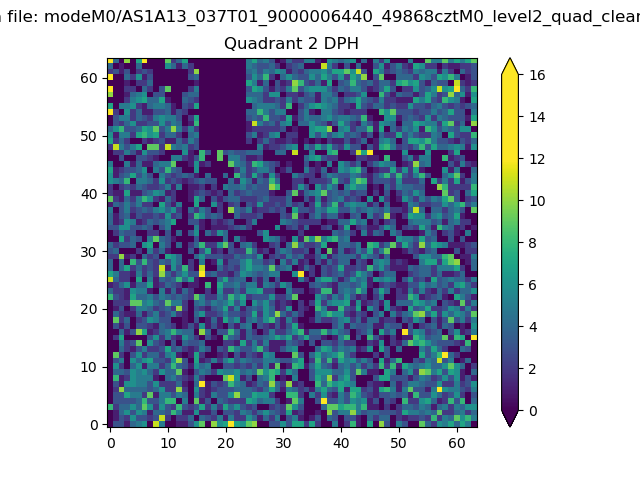 |
Quadrant C |
| Plot type | Count rate plots | Images |
|---|---|---|
| Comparison with Poisson distribution Blue bars denote a histogram of data divided into 1 sec bins. Red curve is a Poisson curve with rate = median count rate of data. |
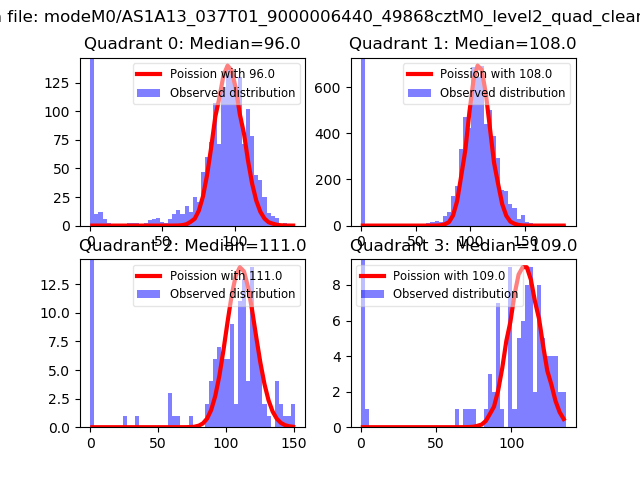 |
 |
| Quadrant-wise count rates Data is divided into 100 sec bins |
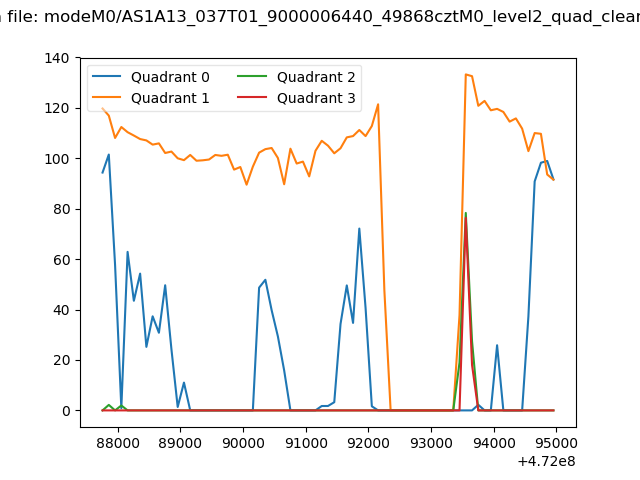 |
|
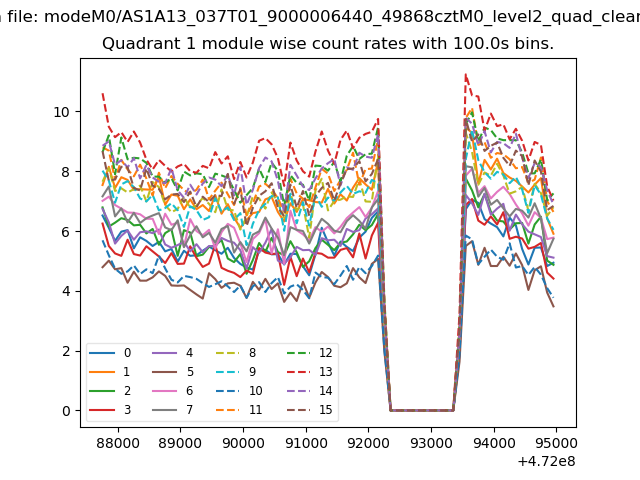
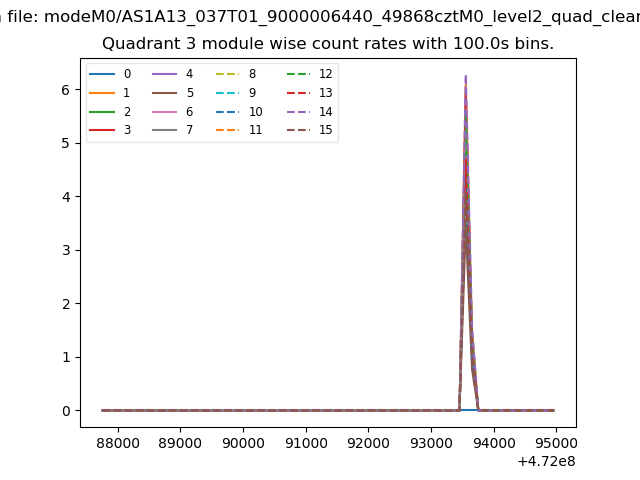
| Module-wise count rates for Quadrant A Data is divided into 100 sec bins |
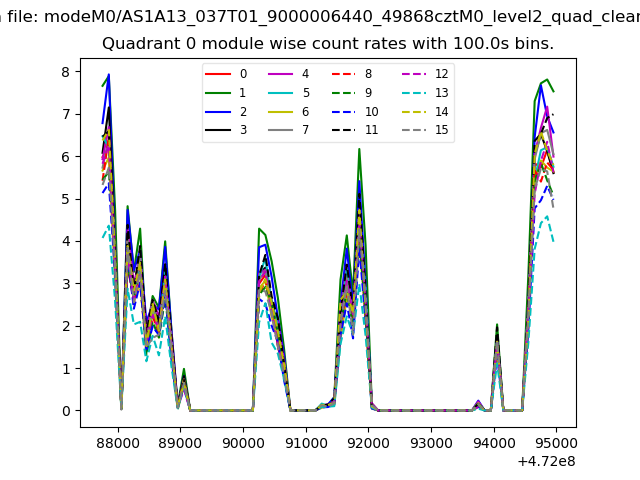 |
 |
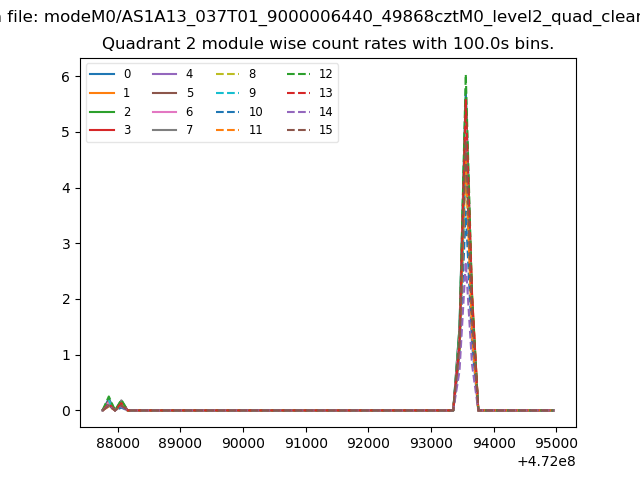
| Module-wise count rates for Quadrant B Data is divided into 100 sec bins |
 |
 |
| Module-wise count rates for Quadrant C Data is divided into 100 sec bins |
 |
 |
| Module-wise count rates for Quadrant D Data is divided into 100 sec bins |
 |
 |
| Parameter | Plot |
|---|---|
| CZT HV Monitor | 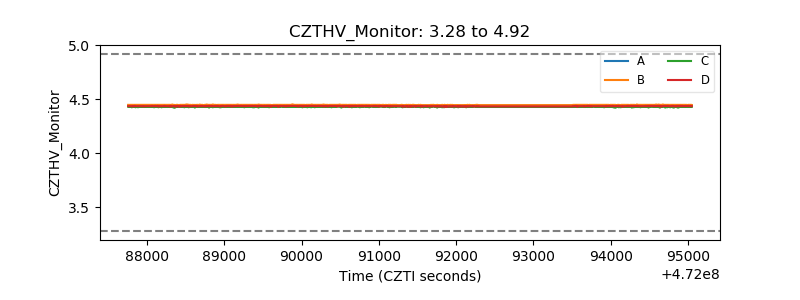 |
| D_VDD | 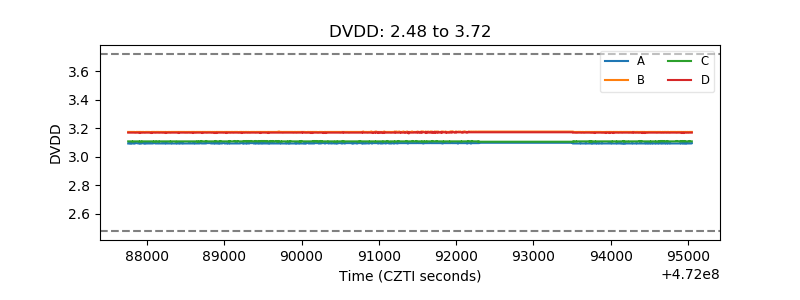 |
| Temperature 1 | 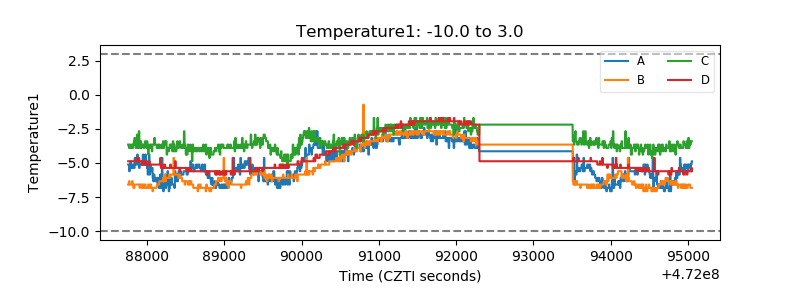 |
| Veto HV Monitor | 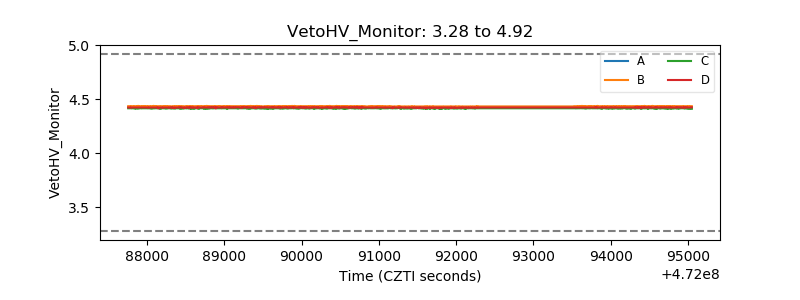 |
| Veto LLD | 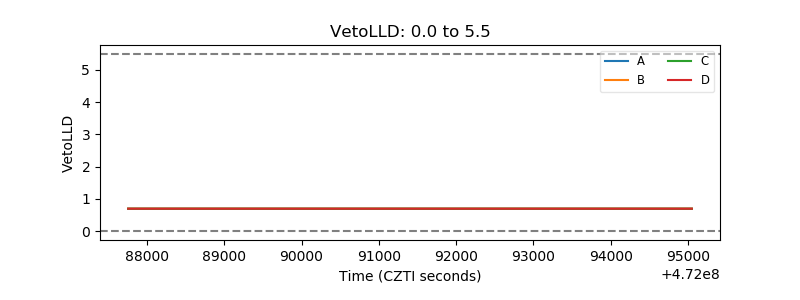 |
| Alpha Counter | 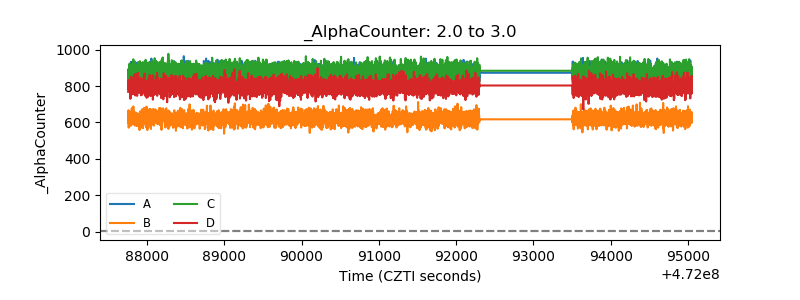 |
| _CPM_Rate | 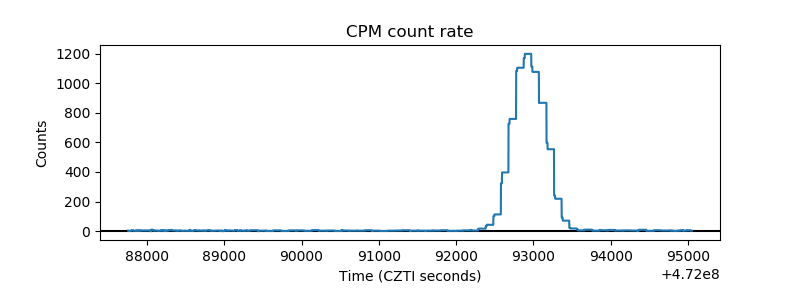 |
| CZT Counter | 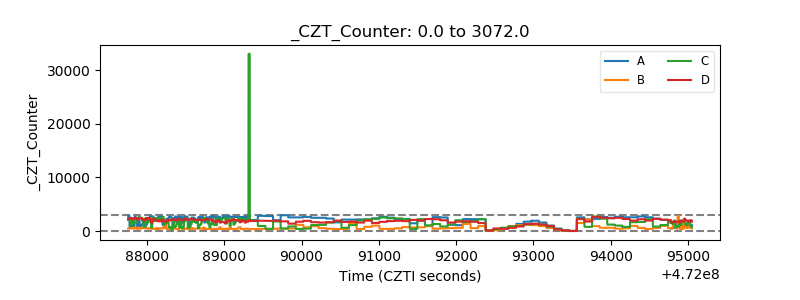 |
| +2.5 Volts monitor |  |
| +5 Volts monitor | 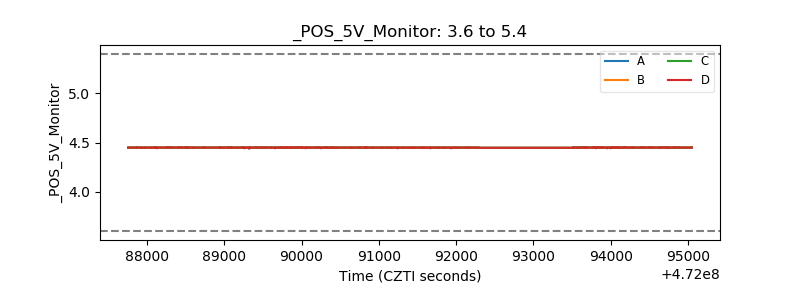 |
| _ROLL_ROT | 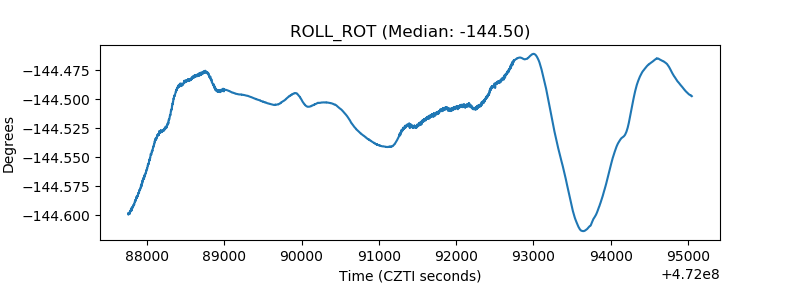 |
| _Roll_DEC | 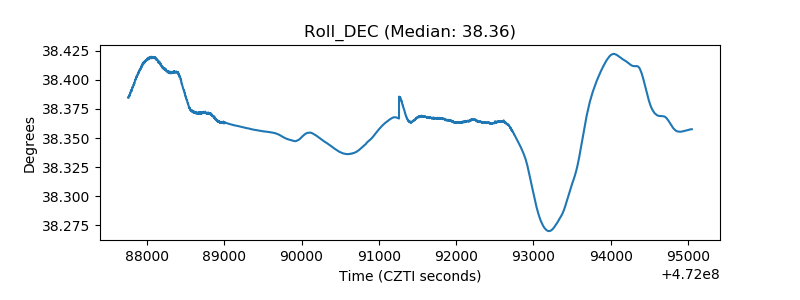 |
| _Roll_RA | 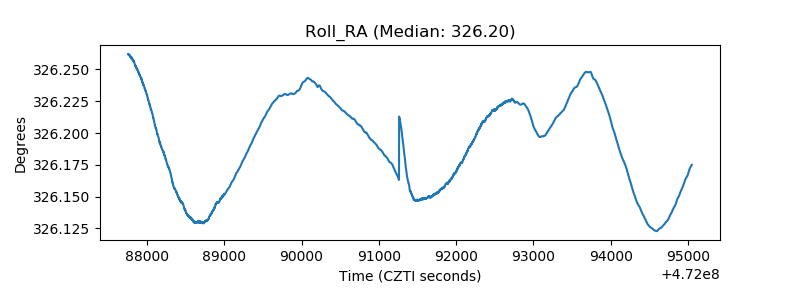 |
| Veto Counter | 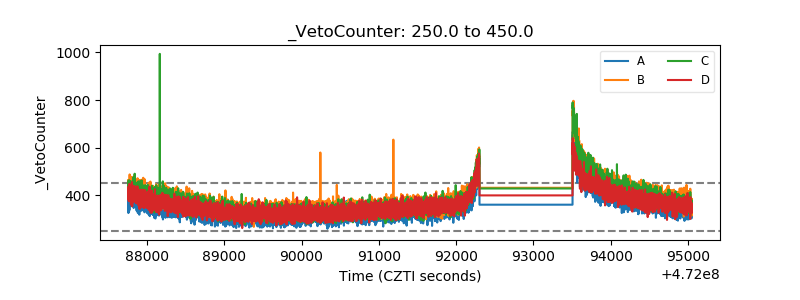 |