| Param | Original file | Final file |
|---|---|---|
| Filename | modeM0/AS1A13_037T01_9000006440_49869cztM0_level2.fits | modeM0/AS1A13_037T01_9000006440_49869cztM0_level2_quad_clean.evt |
| Size (bytes) | 1,069,905,600 | 45,239,040 |
| Size | 1020.3 MB | 43.1 MB |
| Events in quadrant A | 11,488,114 | 289,301 |
| Events in quadrant B | 4,036,888 | 641,947 |
| Events in quadrant C | 10,886,766 | 8,258 |
| Events in quadrant D | 12,724,852 | 8,909 |
| Mode M9 | |||
|---|---|---|---|
| Quadrant | BADHDUFLAG | Total packets | Discarded packets |
| A | 0 | 12 | 0 |
| B | 0 | 12 | 0 |
| C | 0 | 12 | 0 |
| D | 0 | 12 | 0 |
| Mode SS | |||
|---|---|---|---|
| Quadrant | BADHDUFLAG | Total packets | Discarded packets |
| A | 0 | 122 | 0 |
| B | 0 | 122 | 0 |
| C | 0 | 122 | 0 |
| D | 0 | 122 | 0 |
| Mode M0 | |||
|---|---|---|---|
| Quadrant | BADHDUFLAG | Total packets | Discarded packets |
| A | 0 | 38306 | 6 |
| B | 0 | 16082 | 1 |
| C | 0 | 36530 | 1 |
| D | 0 | 41974 | 1 |
| Quadrant | Total seconds | Saturated seconds | Saturation percentage |
|---|---|---|---|
| A | 6031 | 3401 | 56.391975% |
| B | 6031 | 308 | 5.106947% |
| C | 6032 | 5974 | 99.038462% |
| D | 6032 | 5959 | 98.789788% |
Noise dominated data is calculated using 1-second bins in cleaned event files. If a bin has >2000 counts, and if more than 50% of those come from <1% of pixels, then it is considered to be noise-dominated and hence unusable.
| Quadrant | # 1 sec bins | Bins with >0 counts | Bins with >2000 counts | High rate bins dominated by noise | Noise dominated (total time) | Noise dominated (detector-on time) | Marked lightcurve |
|---|---|---|---|---|---|---|---|
| A | 7245 | 6030 | 3238 | 3238 | 44.69% | 53.70% | 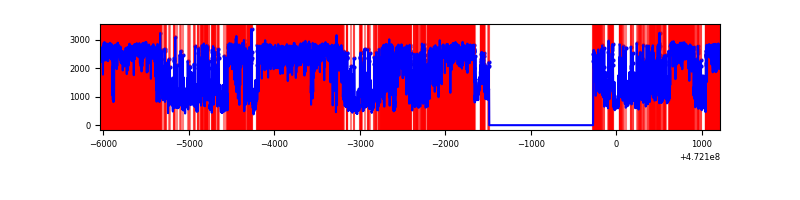 |
| B | 7246 | 6031 | 123 | 123 | 1.70% | 2.04% | 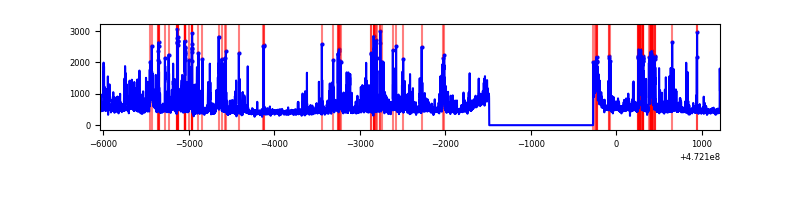 |
| C | 7246 | 6031 | 2462 | 2462 | 33.98% | 40.82% | 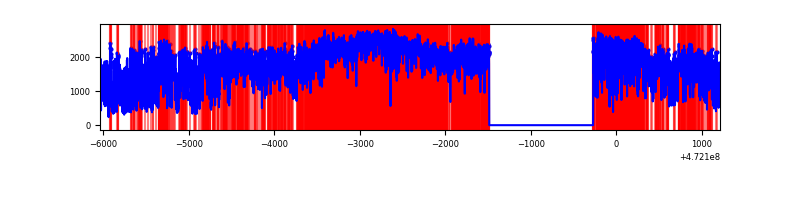 |
| D | 7246 | 6031 | 4011 | 4011 | 55.35% | 66.51% | 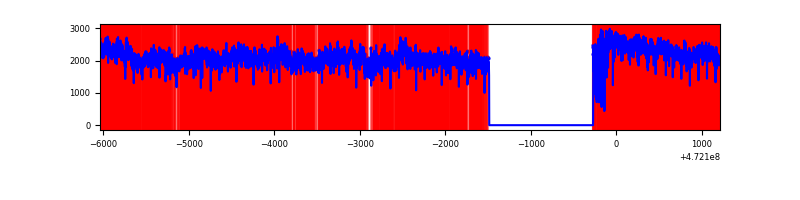 |
Top three noisy pixels from each quadrant. If the there are fewer than three noisy pixels in the level2.evt file, extra rows are filled as -1
| Pixel properties | Quadrant properties | ||||||
|---|---|---|---|---|---|---|---|
| Quadrant | DetID | PixID | Counts | Sigma | Mean | Median | Sigma |
| A | 4 | 4 | 6835317 | 59209.45 | 439 | 428 | 115.4 |
| A | 8 | 62 | 772783 | 6690.78 | 439 | 428 | 115.4 |
| A | 8 | 38 | 319411 | 2763.29 | 439 | 428 | 115.4 |
| B | 4 | 206 | 610320 | 4354.36 | 666 | 647 | 140.0 |
| B | 0 | 213 | 229560 | 1634.93 | 666 | 647 | 140.0 |
| B | 0 | 229 | 179600 | 1278.11 | 666 | 647 | 140.0 |
| C | 4 | 111 | 2588577 | 82678.63 | 98 | 97 | 31.3 |
| C | 15 | 196 | 2036494 | 65044.55 | 98 | 97 | 31.3 |
| C | 15 | 197 | 1266009 | 40434.49 | 98 | 97 | 31.3 |
| D | 7 | 61 | 9250853 | 241766.95 | 109 | 104 | 38.3 |
| D | 15 | 185 | 1040582 | 27192.74 | 109 | 104 | 38.3 |
| D | 8 | 176 | 580293 | 15163.15 | 109 | 104 | 38.3 |
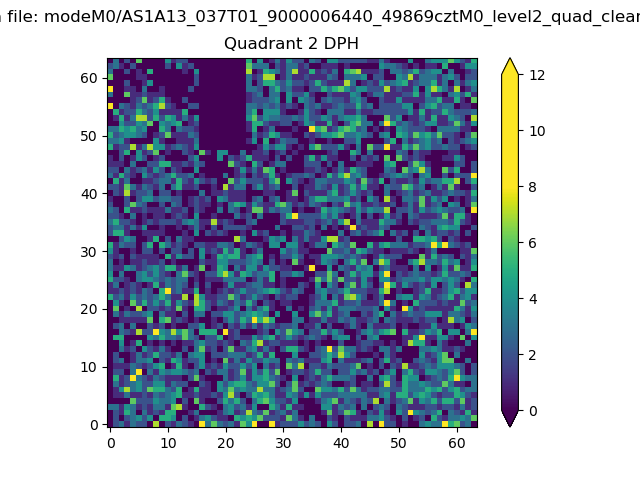
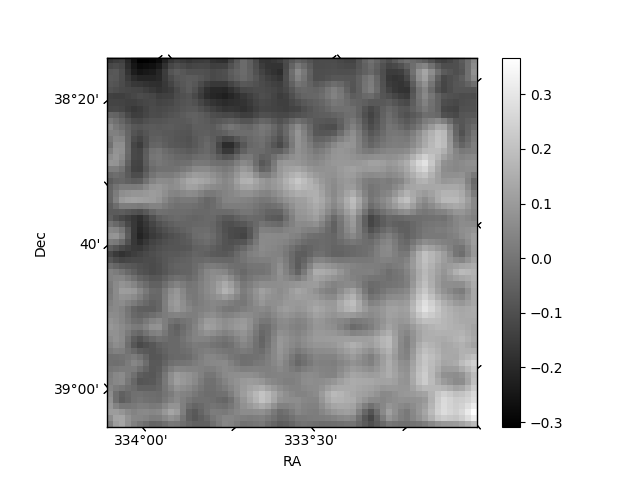
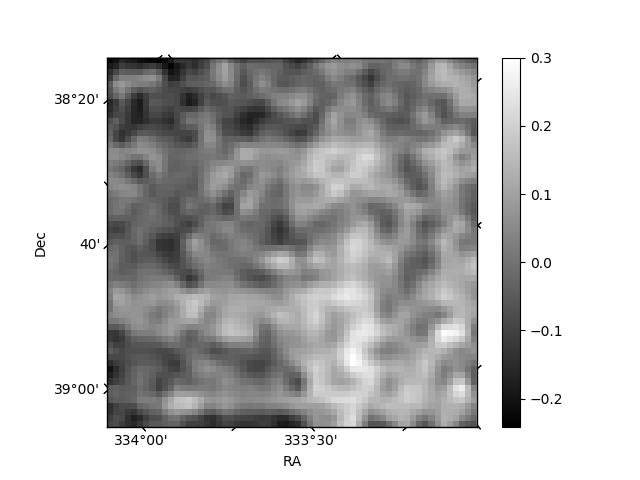
Histogram calculated using DETX and DETY for each event in the final _common_clean file
| Quadrant A | 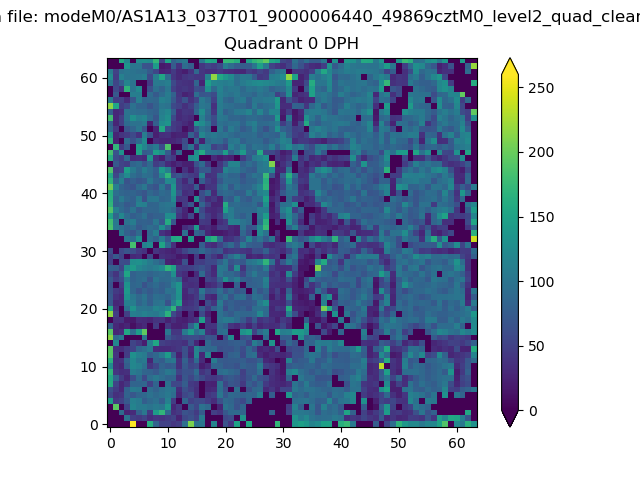 |
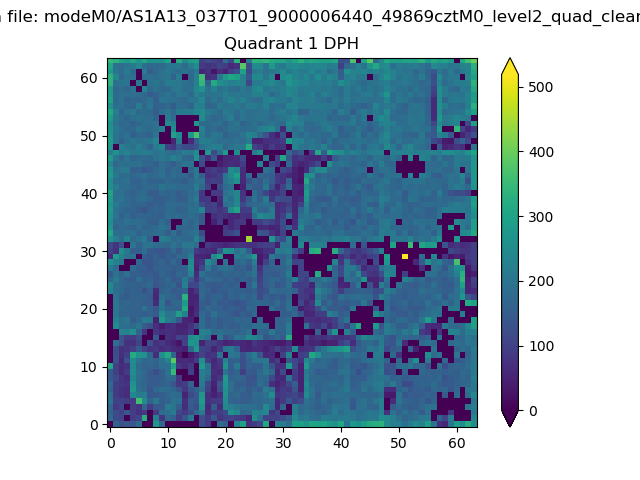 |
Quadrant B |
|---|---|---|---|
| Quadrant D | 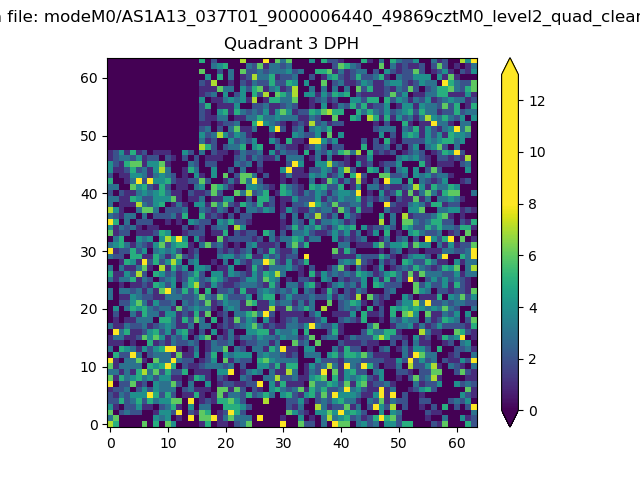 |
 |
Quadrant C |
| Plot type | Count rate plots | Images |
|---|---|---|
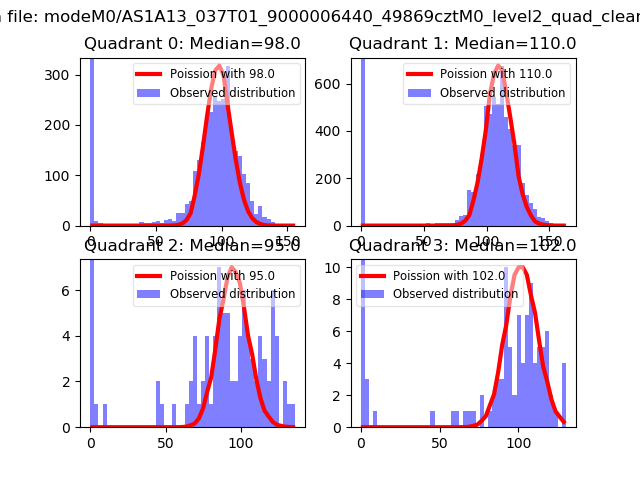
| Comparison with Poisson distribution Blue bars denote a histogram of data divided into 1 sec bins. Red curve is a Poisson curve with rate = median count rate of data. |
 |
 |
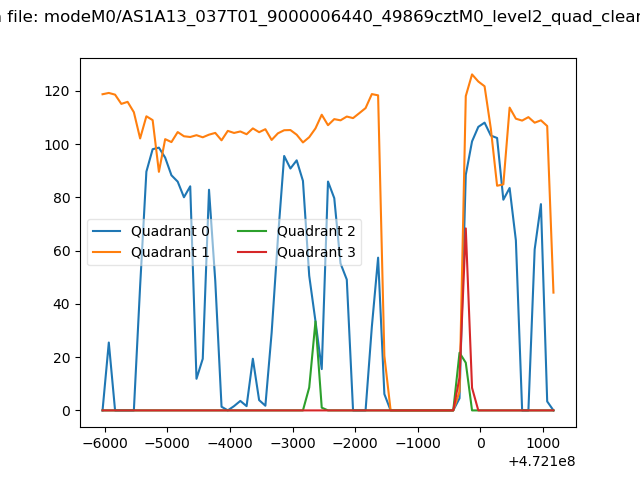
| Quadrant-wise count rates Data is divided into 100 sec bins |
 |
|
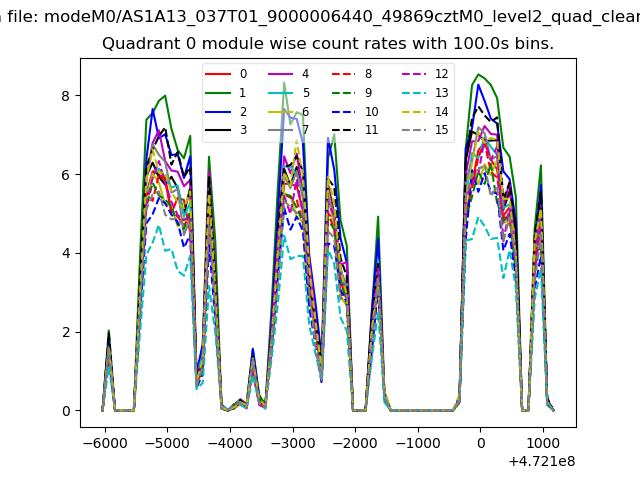
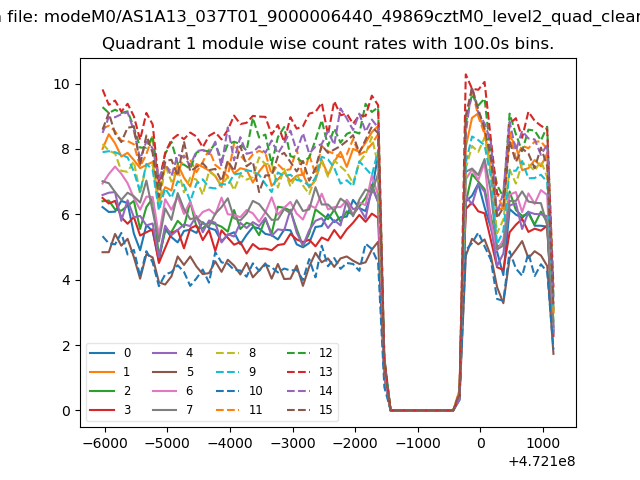
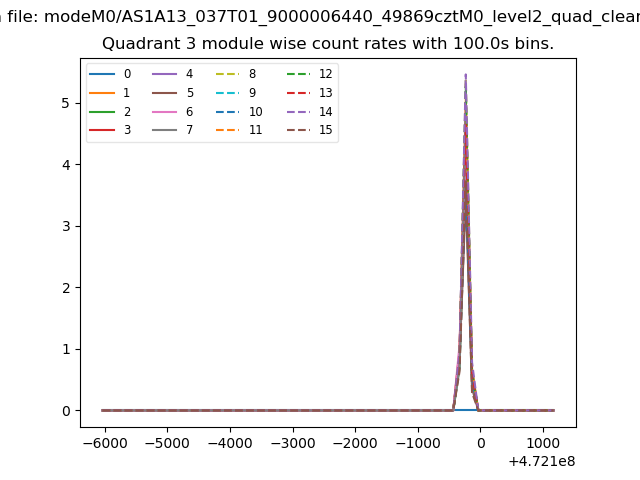
| Module-wise count rates for Quadrant A Data is divided into 100 sec bins |
 |
 |
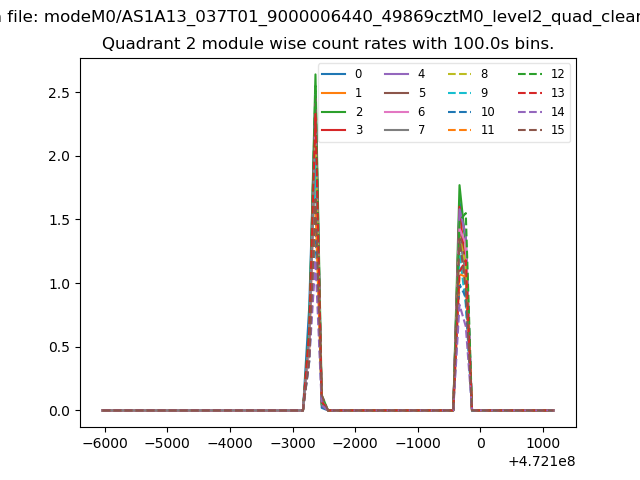
| Module-wise count rates for Quadrant B Data is divided into 100 sec bins |
 |
 |
| Module-wise count rates for Quadrant C Data is divided into 100 sec bins |
 |
 |
| Module-wise count rates for Quadrant D Data is divided into 100 sec bins |
 |
 |
| Parameter | Plot |
|---|---|
| CZT HV Monitor | 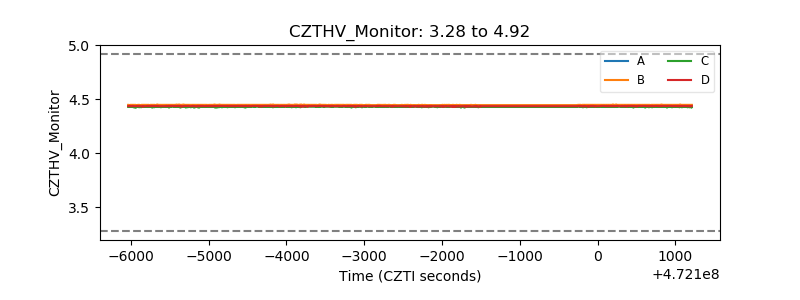 |
| D_VDD | 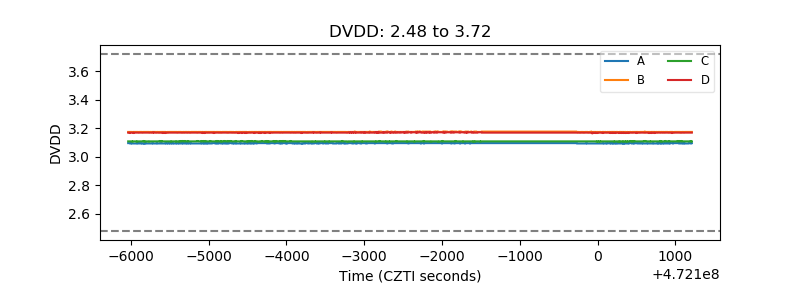 |
| Temperature 1 | 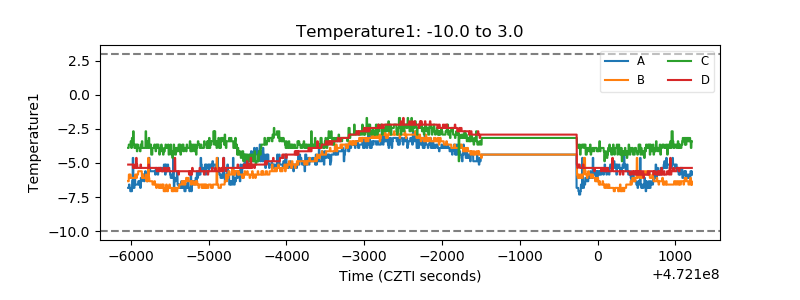 |
| Veto HV Monitor |  |
| Veto LLD | 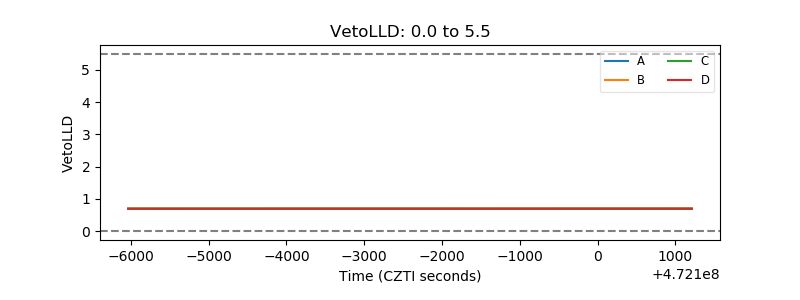 |
| Alpha Counter | 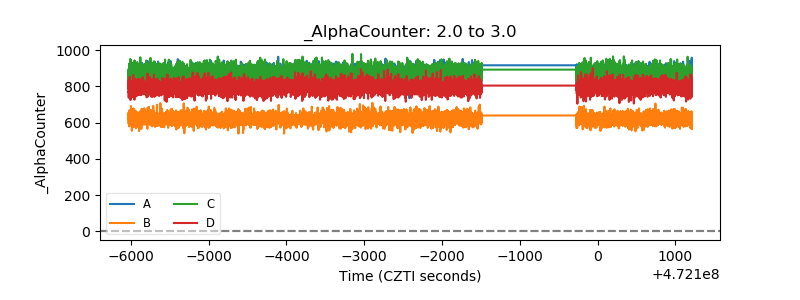 |
| _CPM_Rate | 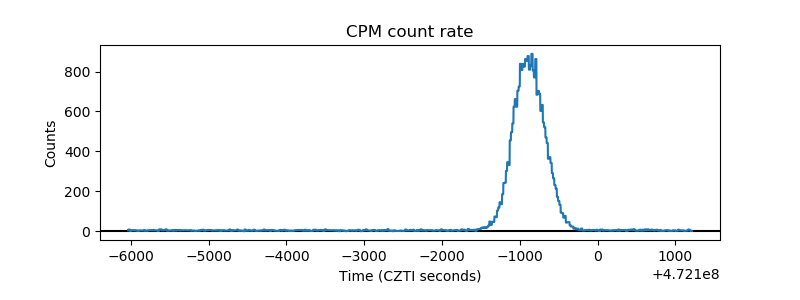 |
| CZT Counter | 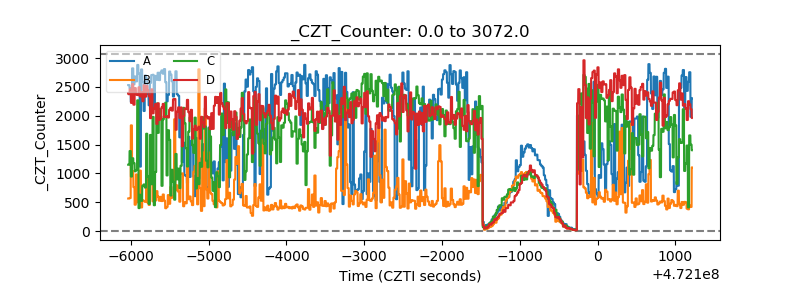 |
| +2.5 Volts monitor | 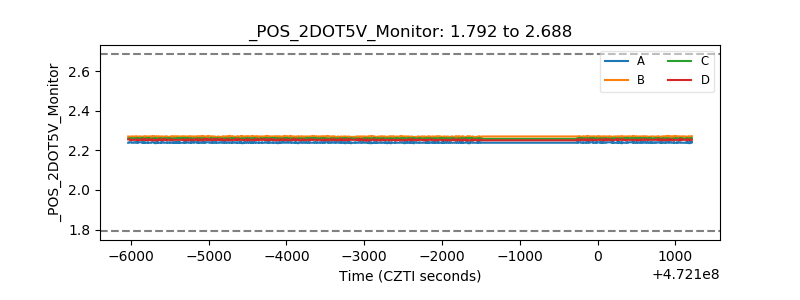 |
| +5 Volts monitor | 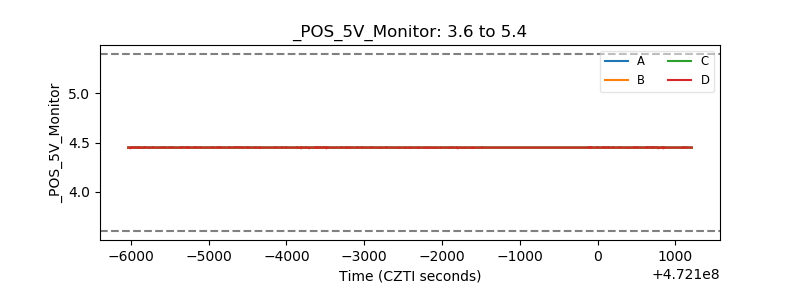 |
| _ROLL_ROT | 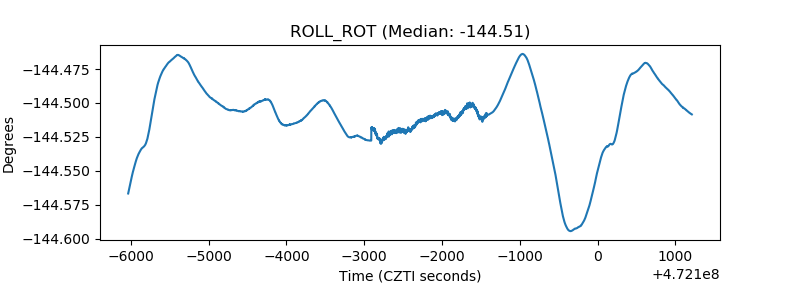 |
| _Roll_DEC | 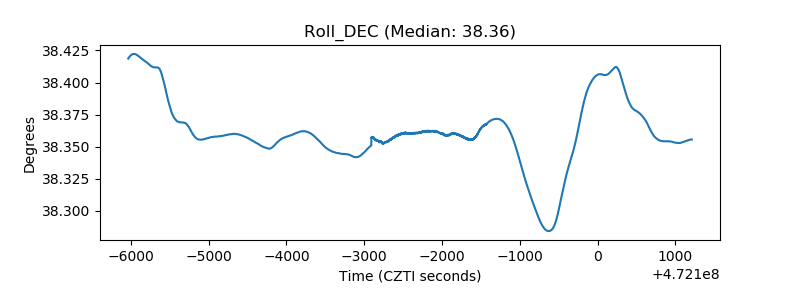 |
| _Roll_RA | 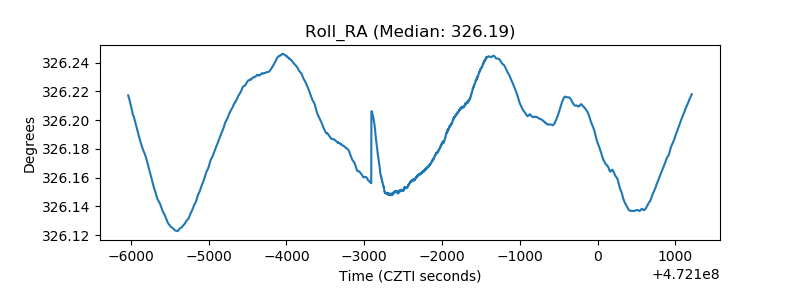 |
| Veto Counter | 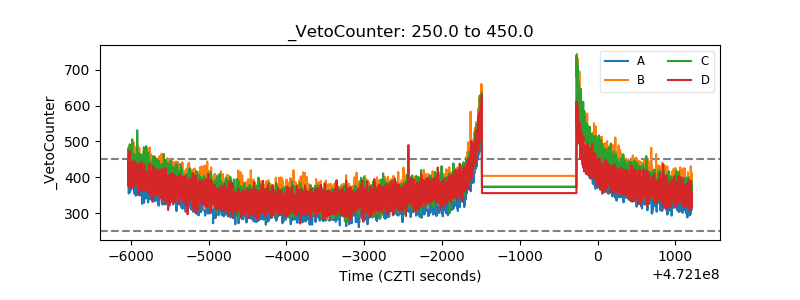 |