| Param | Original file | Final file |
|---|---|---|
| Filename | modeM0/AS1C09_003T01_9000006442cztM0_level2.fits | modeM0/AS1C09_003T01_9000006442cztM0_level2_quad_clean.evt |
| Size (bytes) | 55,656,000 | 79,891,200 |
| Size | 53.1 MB | 76.2 MB |
| Events in quadrant A | 322,880 | 500,456 |
| Events in quadrant B | 310,782 | 532,689 |
| Events in quadrant C | 317,216 | 487,204 |
| Events in quadrant D | 271,972 | 436,521 |
| Mode M9 | |||
|---|---|---|---|
| Quadrant | BADHDUFLAG | Total packets | Discarded packets |
| A | 0 | 15 | 0 |
| B | 0 | 16 | 0 |
| C | 0 | 16 | 0 |
| D | 0 | 16 | 0 |
| Mode M0 | |||
|---|---|---|---|
| Quadrant | BADHDUFLAG | Total packets | Discarded packets |
| A | 0 | 18183 | 0 |
| B | 0 | 17222 | 0 |
| C | 0 | 19139 | 0 |
| D | 0 | 21094 | 0 |
| Mode SS | |||
|---|---|---|---|
| Quadrant | BADHDUFLAG | Total packets | Discarded packets |
| A | 0 | 134 | 0 |
| B | 0 | 134 | 0 |
| C | 0 | 134 | 0 |
| D | 0 | 134 | 0 |
| Quadrant | Total seconds | Saturated seconds | Saturation percentage |
|---|---|---|---|
| A | 6629 | 343 | 5.174234% |
| B | 6629 | 399 | 6.019007% |
| C | 6629 | 308 | 4.646251% |
| D | 6628 | 579 | 8.735667% |
Noise dominated data is calculated using 1-second bins in cleaned event files. If a bin has >2000 counts, and if more than 50% of those come from <1% of pixels, then it is considered to be noise-dominated and hence unusable.
| Quadrant | # 1 sec bins | Bins with >0 counts | Bins with >2000 counts | High rate bins dominated by noise | Noise dominated (total time) | Noise dominated (detector-on time) | Marked lightcurve |
|---|---|---|---|---|---|---|---|
| A | 7657 | 6622 | 0 | 0 | 0.00% | 0.00% | 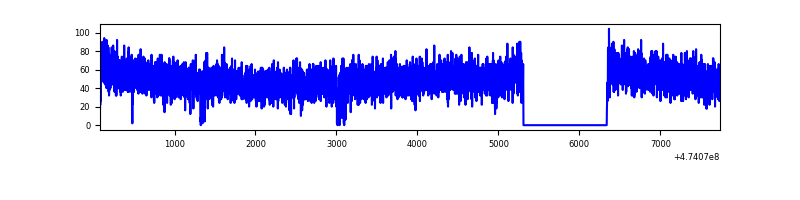 |
| B | 7658 | 6627 | 0 | 0 | 0.00% | 0.00% | 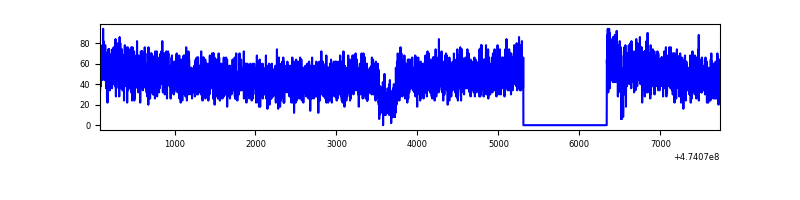 |
| C | 7658 | 6627 | 0 | 0 | 0.00% | 0.00% |  |
| D | 7656 | 6617 | 0 | 0 | 0.00% | 0.00% | 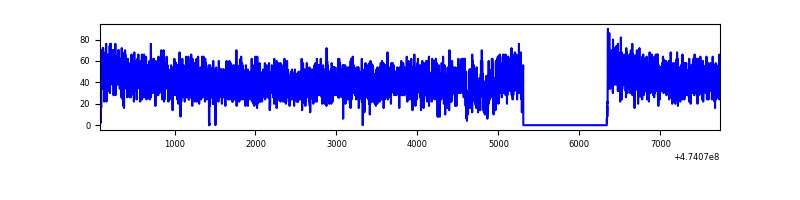 |
Top three noisy pixels from each quadrant. If the there are fewer than three noisy pixels in the level2.evt file, extra rows are filled as -1
| Pixel properties | Quadrant properties | ||||||
|---|---|---|---|---|---|---|---|
| Quadrant | DetID | PixID | Counts | Sigma | Mean | Median | Sigma |
| A | 14 | 188 | 342 | 9.16 | 85 | 79 | 28.7 |
| A | 9 | 255 | 314 | 8.18 | 85 | 79 | 28.7 |
| A | 14 | 204 | 285 | 7.17 | 85 | 79 | 28.7 |
| B | 2 | 245 | 275 | 9.11 | 82 | 78 | 21.6 |
| B | 10 | 3 | 248 | 7.86 | 82 | 78 | 21.6 |
| B | 9 | 173 | 244 | 7.68 | 82 | 78 | 21.6 |
| C | 2 | 31 | 283 | 6.8 | 85 | 77 | 30.3 |
| C | 7 | 221 | 263 | 6.14 | 85 | 77 | 30.3 |
| C | 3 | 202 | 258 | 5.97 | 85 | 77 | 30.3 |
| D | 6 | 218 | 337 | 9.66 | 78 | 69 | 27.7 |
| D | 3 | 30 | 264 | 7.03 | 78 | 69 | 27.7 |
| D | 11 | 3 | 258 | 6.81 | 78 | 69 | 27.7 |
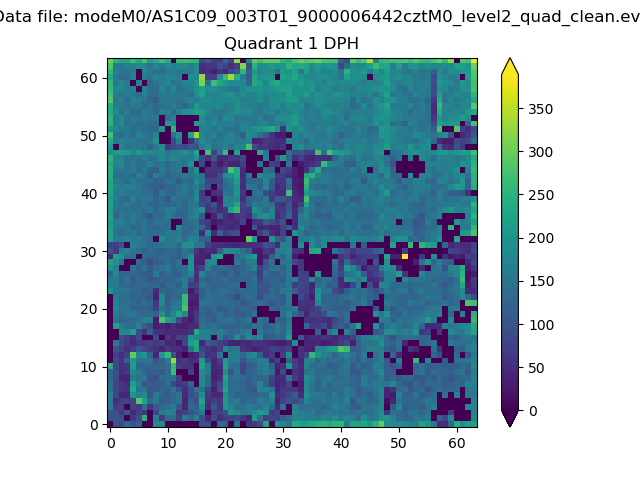
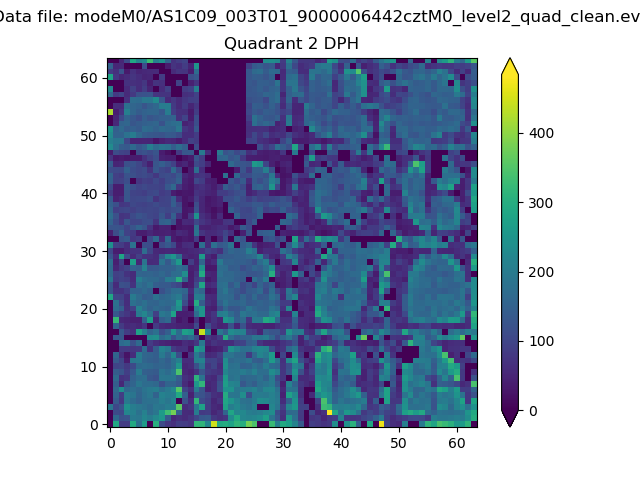
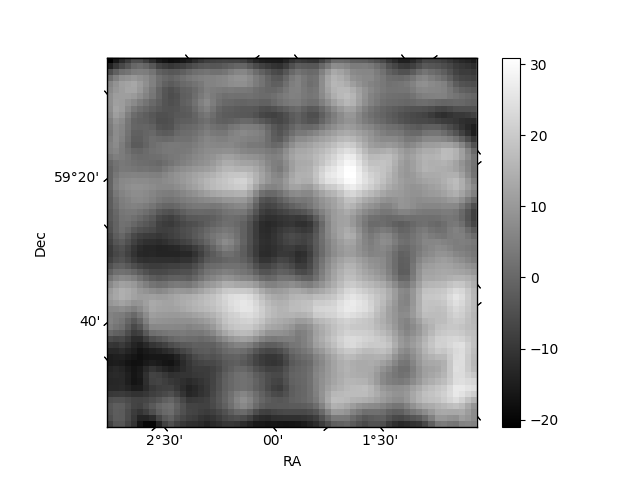
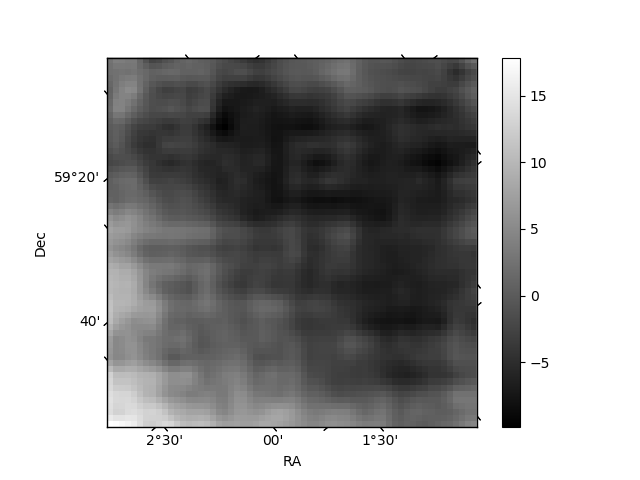
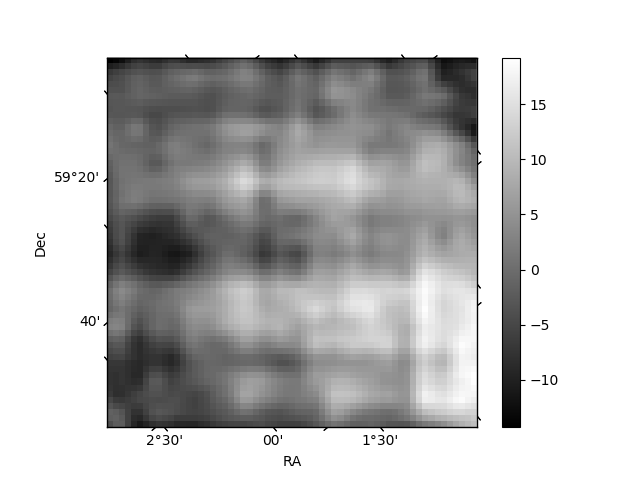
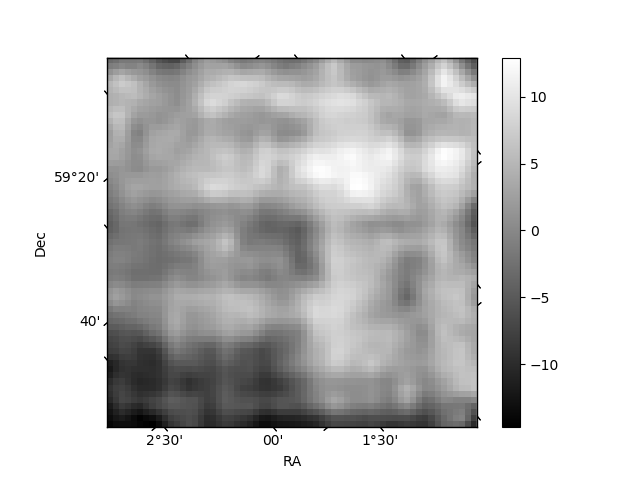
Histogram calculated using DETX and DETY for each event in the final _common_clean file
| Quadrant A | 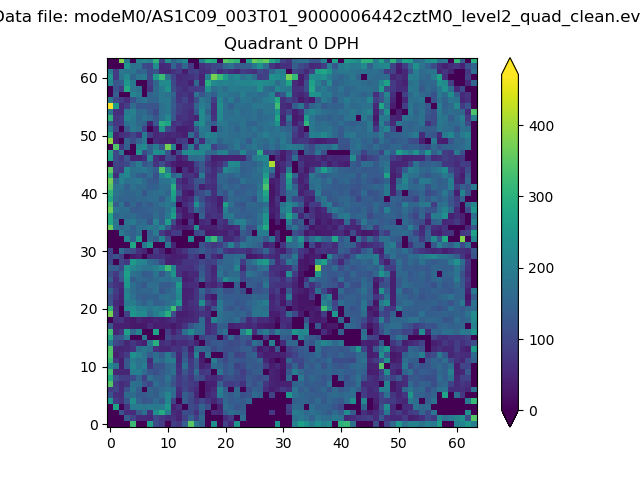 |
 |
Quadrant B |
|---|---|---|---|
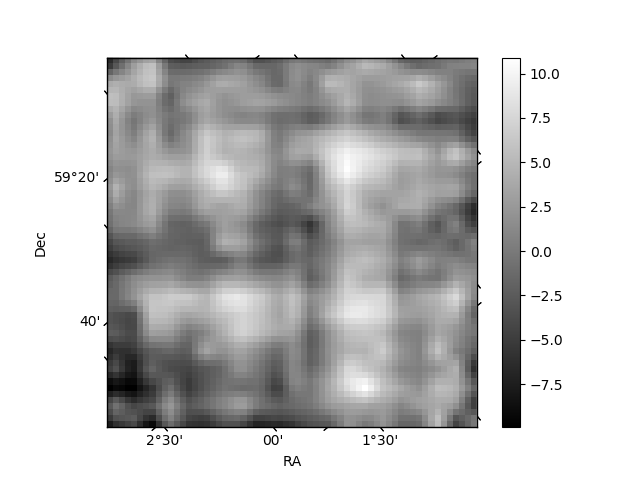
| Quadrant D | 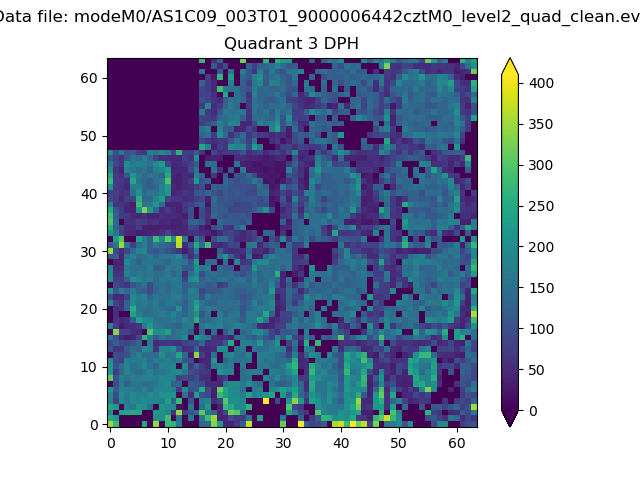 |
 |
Quadrant C |
| Plot type | Count rate plots | Images |
|---|---|---|
| Comparison with Poisson distribution Blue bars denote a histogram of data divided into 1 sec bins. Red curve is a Poisson curve with rate = median count rate of data. |
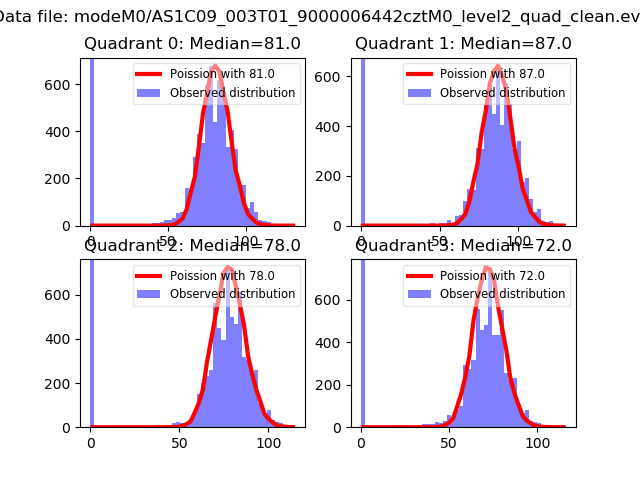 |
 |
| Quadrant-wise count rates Data is divided into 100 sec bins |
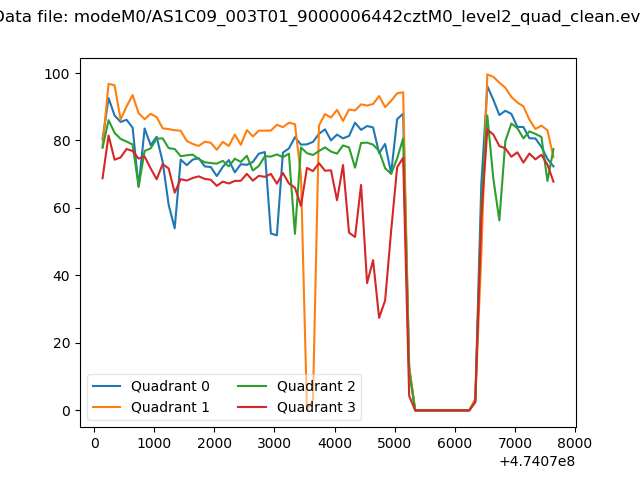 |
|
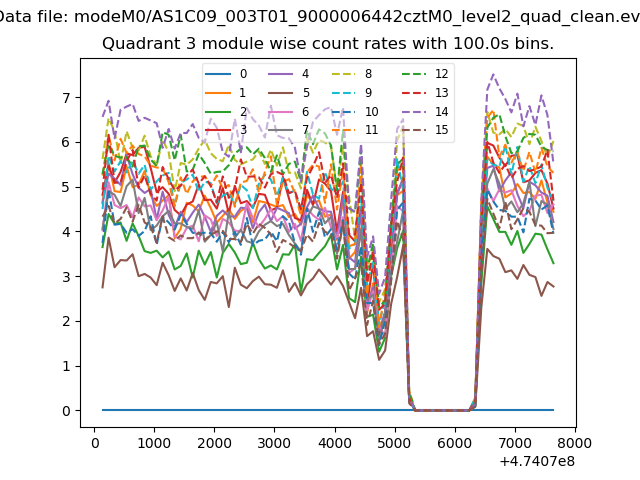
| Module-wise count rates for Quadrant A Data is divided into 100 sec bins |
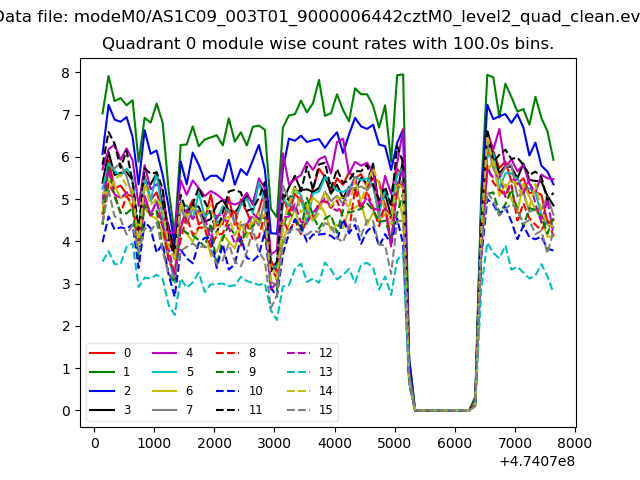 |
 |
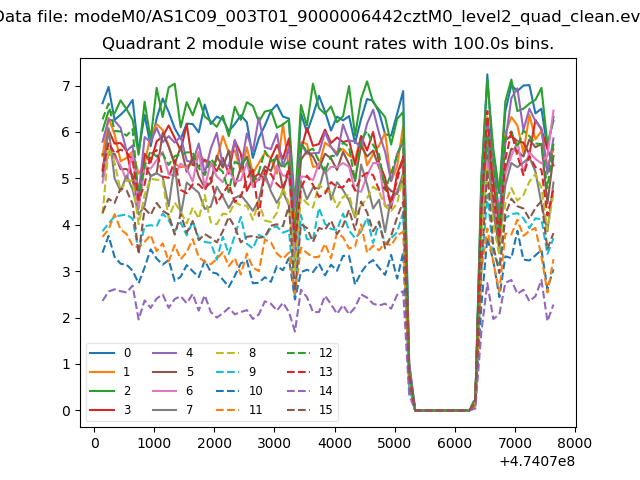
| Module-wise count rates for Quadrant B Data is divided into 100 sec bins |
 |
 |
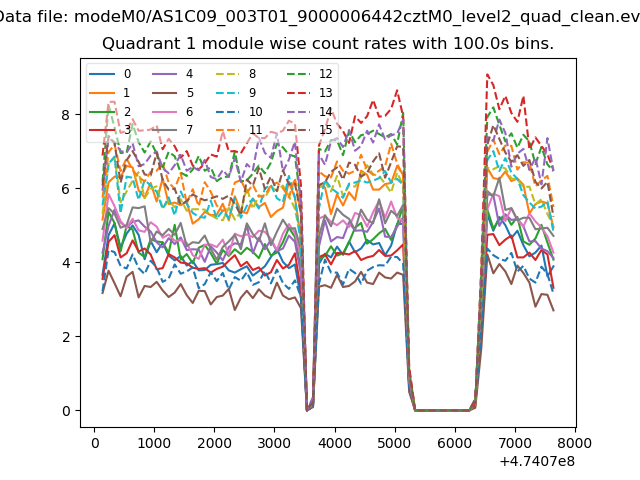
| Module-wise count rates for Quadrant C Data is divided into 100 sec bins |
 |
 |
| Module-wise count rates for Quadrant D Data is divided into 100 sec bins |
 |
 |
| Parameter | Plot |
|---|---|
| CZT HV Monitor | 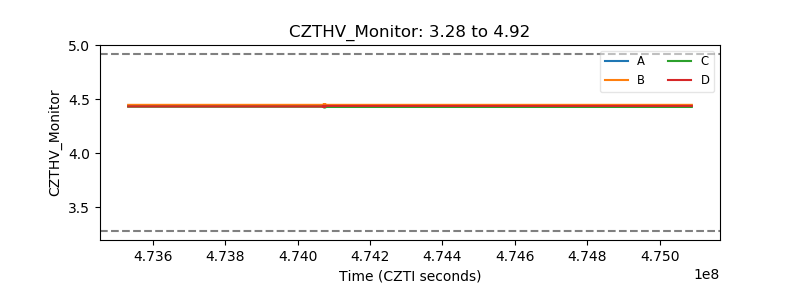 |
| D_VDD | 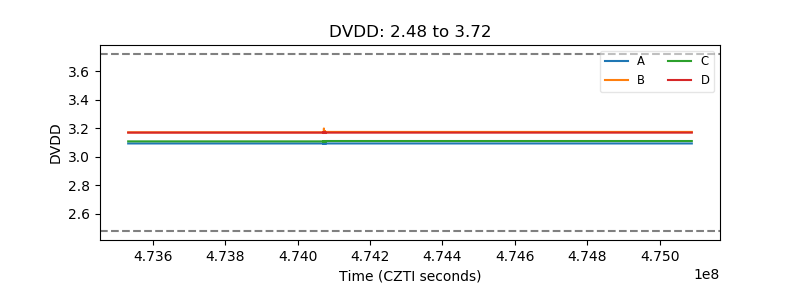 |
| Temperature 1 | 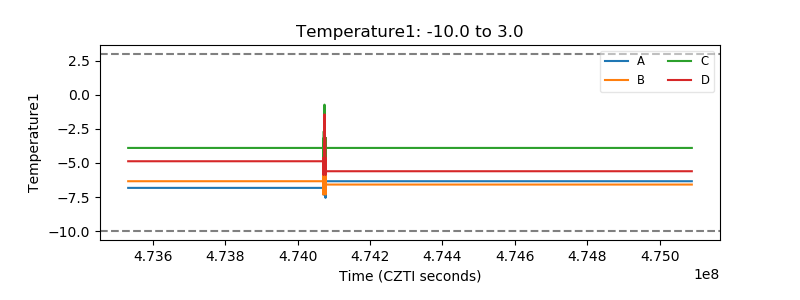 |
| Veto HV Monitor |  |
| Veto LLD | 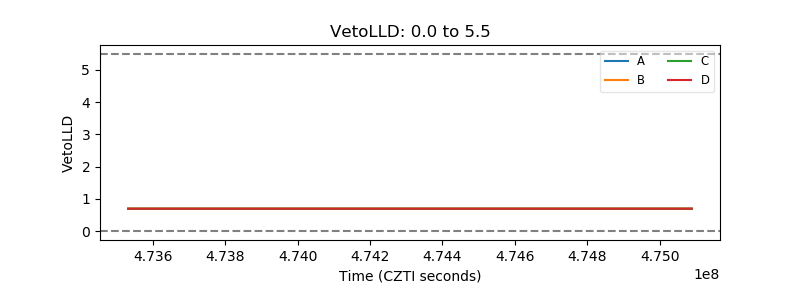 |
| Alpha Counter | 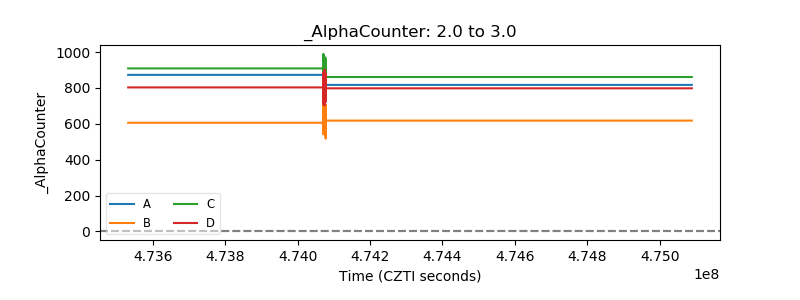 |
| _CPM_Rate | 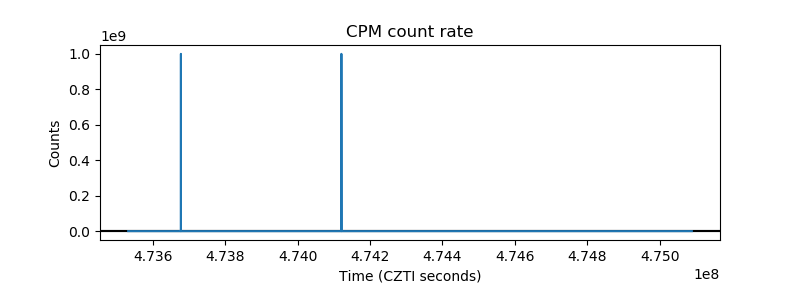 |
| CZT Counter | 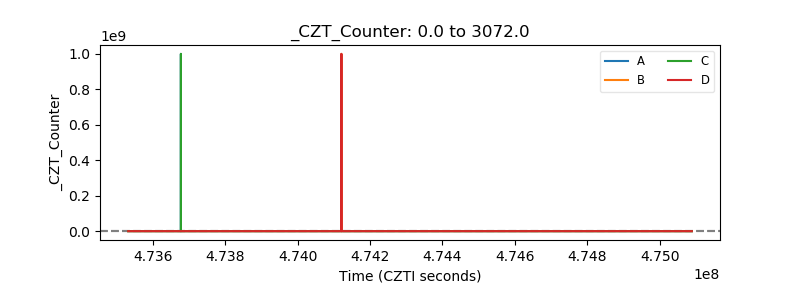 |
| +2.5 Volts monitor | 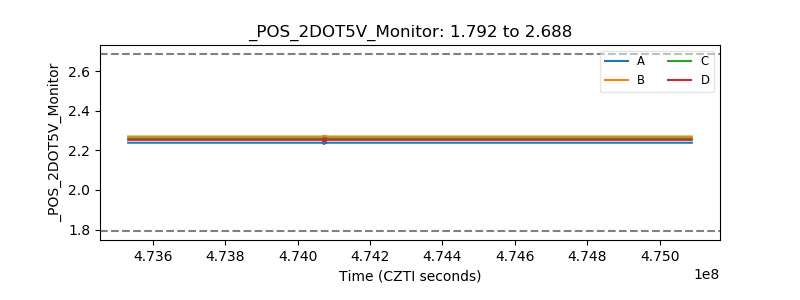 |
| +5 Volts monitor | 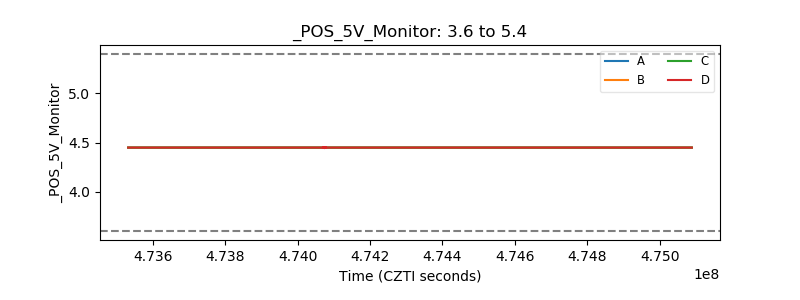 |
| _ROLL_ROT | 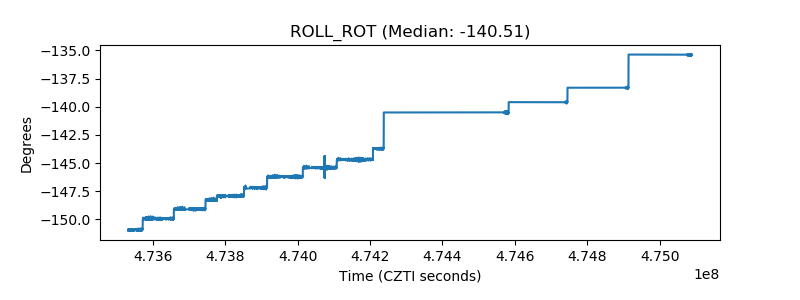 |
| _Roll_DEC | 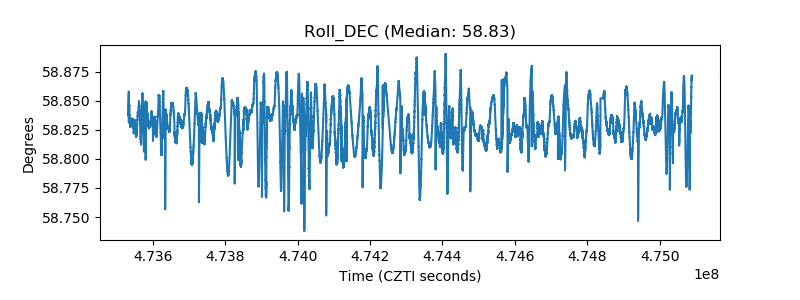 |
| _Roll_RA | 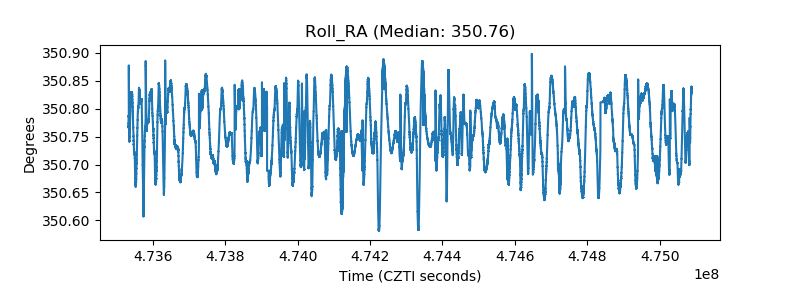 |
| Veto Counter | 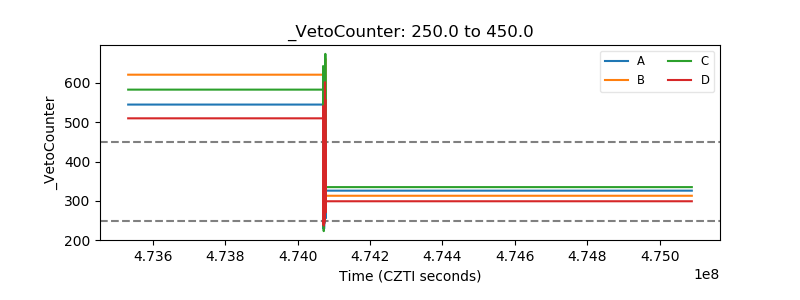 |