| Param | Original file | Final file |
|---|---|---|
| Filename | modeM0/AS1C09_003T01_9000006442_50116cztM0_level2.fits | modeM0/AS1C09_003T01_9000006442_50116cztM0_level2_quad_clean.evt |
| Size (bytes) | 1,085,299,200 | 56,067,840 |
| Size | 1.0 GB | 53.5 MB |
| Events in quadrant A | 11,806,812 | 298,742 |
| Events in quadrant B | 3,358,927 | 630,294 |
| Events in quadrant C | 13,114,142 | 94,567 |
| Events in quadrant D | 11,430,494 | 253,284 |
| Mode M9 | |||
|---|---|---|---|
| Quadrant | BADHDUFLAG | Total packets | Discarded packets |
| A | 0 | 11 | 0 |
| B | 0 | 11 | 0 |
| C | 0 | 11 | 0 |
| D | 0 | 11 | 0 |
| Mode M0 | |||
|---|---|---|---|
| Quadrant | BADHDUFLAG | Total packets | Discarded packets |
| A | 0 | 39197 | 1 |
| B | 0 | 14140 | 1 |
| C | 0 | 43009 | 1 |
| D | 0 | 38047 | 1 |
| Mode SS | |||
|---|---|---|---|
| Quadrant | BADHDUFLAG | Total packets | Discarded packets |
| A | 0 | 122 | 0 |
| B | 0 | 122 | 0 |
| C | 0 | 122 | 0 |
| D | 0 | 122 | 0 |
| Quadrant | Total seconds | Saturated seconds | Saturation percentage |
|---|---|---|---|
| A | 6019 | 3295 | 54.743313% |
| B | 6019 | 113 | 1.877388% |
| C | 6020 | 5166 | 85.813953% |
| D | 6020 | 3303 | 54.867110% |
Noise dominated data is calculated using 1-second bins in cleaned event files. If a bin has >2000 counts, and if more than 50% of those come from <1% of pixels, then it is considered to be noise-dominated and hence unusable.
| Quadrant | # 1 sec bins | Bins with >0 counts | Bins with >2000 counts | High rate bins dominated by noise | Noise dominated (total time) | Noise dominated (detector-on time) | Marked lightcurve |
|---|---|---|---|---|---|---|---|
| A | 7124 | 6020 | 3280 | 3280 | 46.04% | 54.49% | 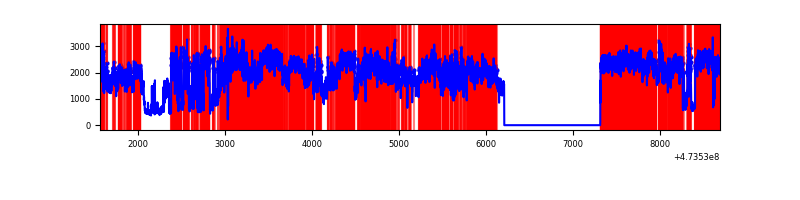 |
| B | 7124 | 6020 | 64 | 64 | 0.90% | 1.06% | 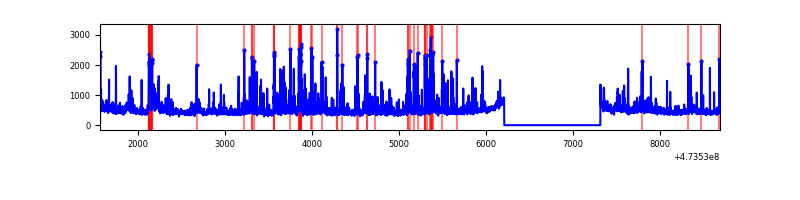 |
| C | 7125 | 6021 | 4071 | 4071 | 57.14% | 67.61% | 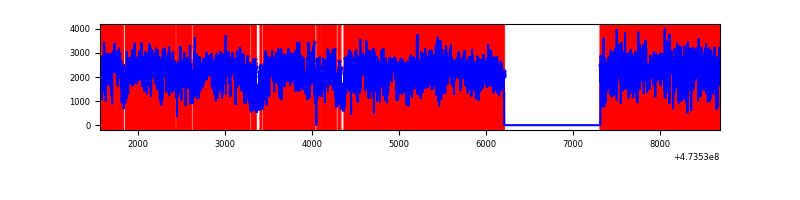 |
| D | 7125 | 6021 | 3455 | 3455 | 48.49% | 57.38% | 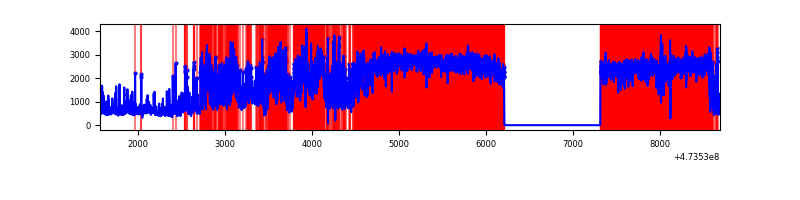 |
Top three noisy pixels from each quadrant. If the there are fewer than three noisy pixels in the level2.evt file, extra rows are filled as -1
| Pixel properties | Quadrant properties | ||||||
|---|---|---|---|---|---|---|---|
| Quadrant | DetID | PixID | Counts | Sigma | Mean | Median | Sigma |
| A | 6 | 250 | 4181896 | 31227.23 | 514 | 501 | 133.9 |
| A | 8 | 8 | 3214702 | 24004.09 | 514 | 501 | 133.9 |
| A | 15 | 191 | 783786 | 5849.68 | 514 | 501 | 133.9 |
| B | 2 | 176 | 277097 | 2101.73 | 627 | 604 | 131.6 |
| B | 0 | 213 | 108353 | 819.04 | 627 | 604 | 131.6 |
| B | 10 | 76 | 77489 | 584.43 | 627 | 604 | 131.6 |
| C | 4 | 111 | 7943325 | 99702.55 | 264 | 260 | 79.7 |
| C | 15 | 230 | 732811 | 9195.09 | 264 | 260 | 79.7 |
| C | 15 | 214 | 536321 | 6728.72 | 264 | 260 | 79.7 |
| D | 12 | 191 | 2924713 | 22048.71 | 458 | 444 | 132.6 |
| D | 15 | 106 | 2081833 | 15693.48 | 458 | 444 | 132.6 |
| D | 12 | 6 | 525535 | 3959.14 | 458 | 444 | 132.6 |
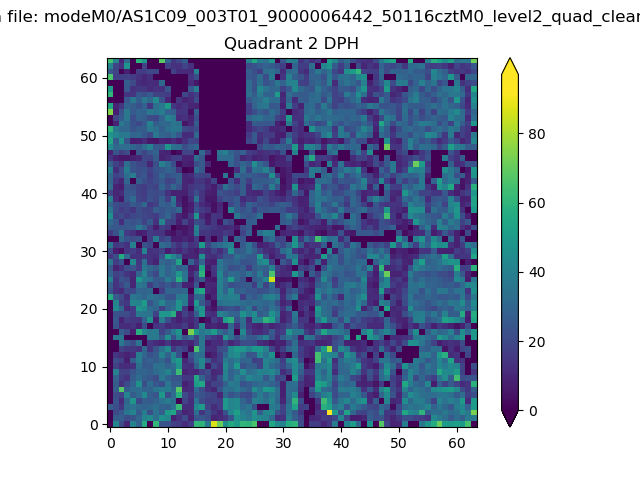
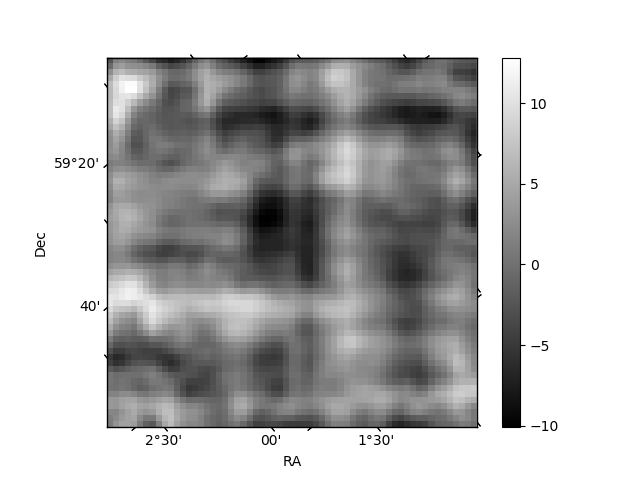
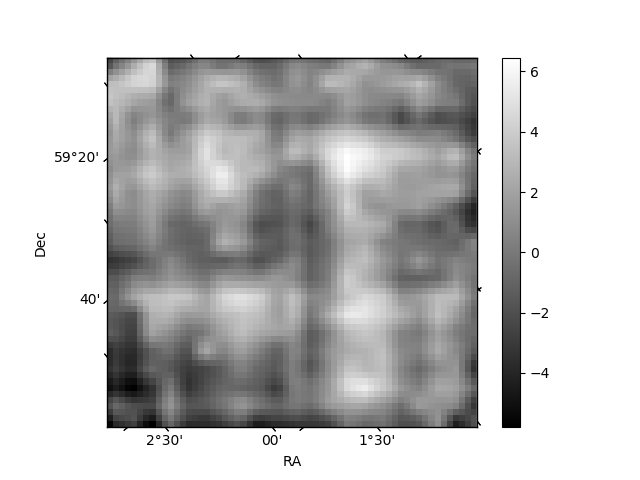
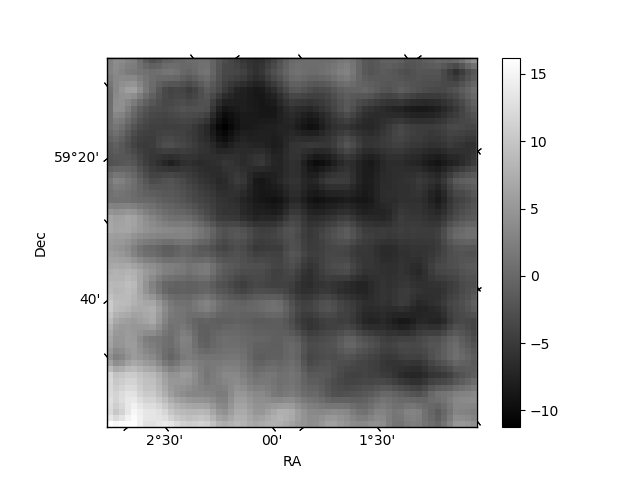
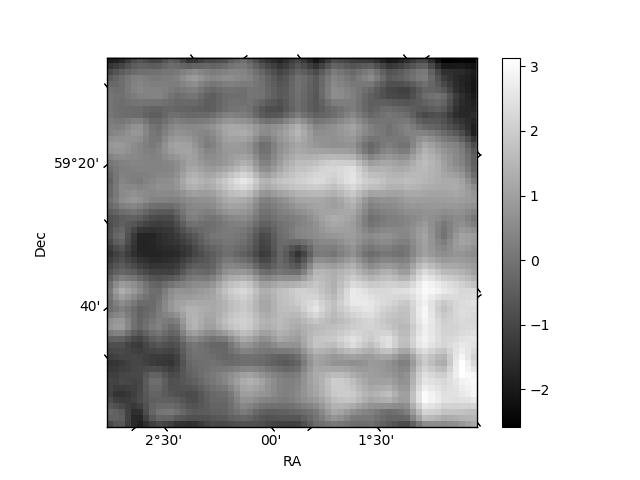
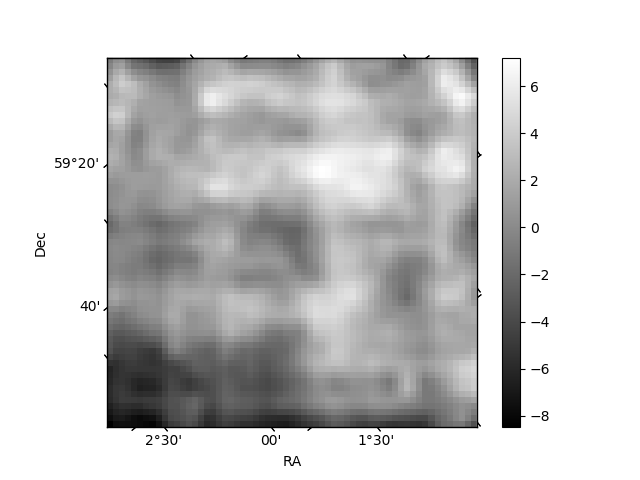
Histogram calculated using DETX and DETY for each event in the final _common_clean file
| Quadrant A | 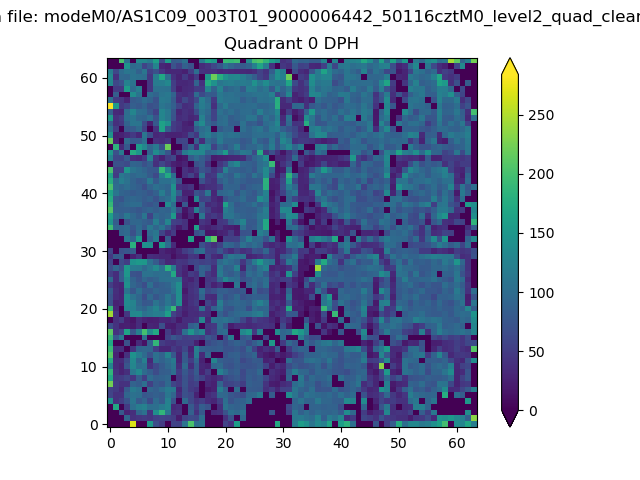 |
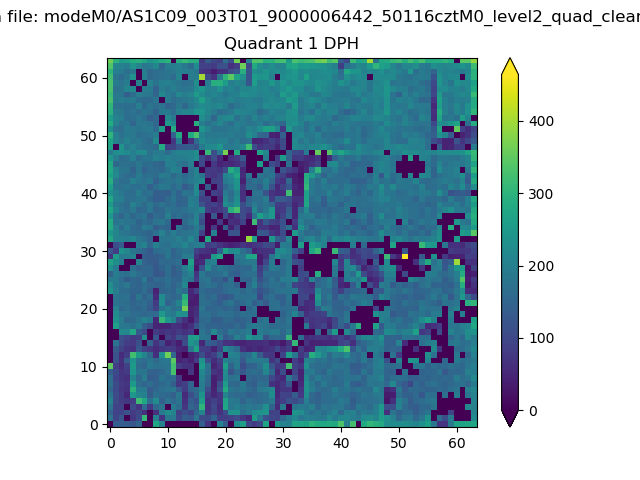 |
Quadrant B |
|---|---|---|---|
| Quadrant D | 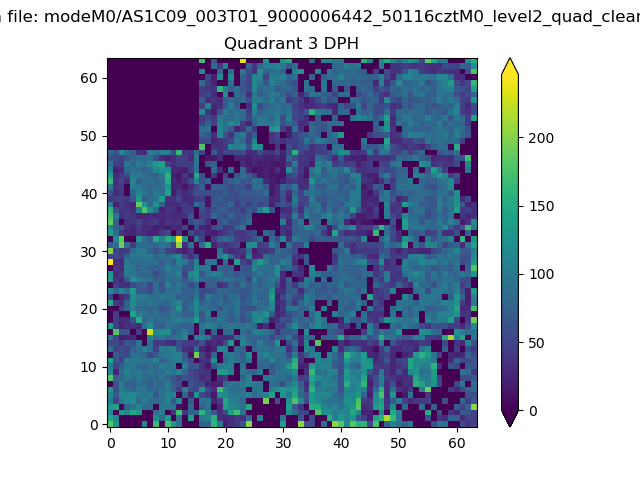 |
 |
Quadrant C |
| Plot type | Count rate plots | Images |
|---|---|---|
| Comparison with Poisson distribution Blue bars denote a histogram of data divided into 1 sec bins. Red curve is a Poisson curve with rate = median count rate of data. |
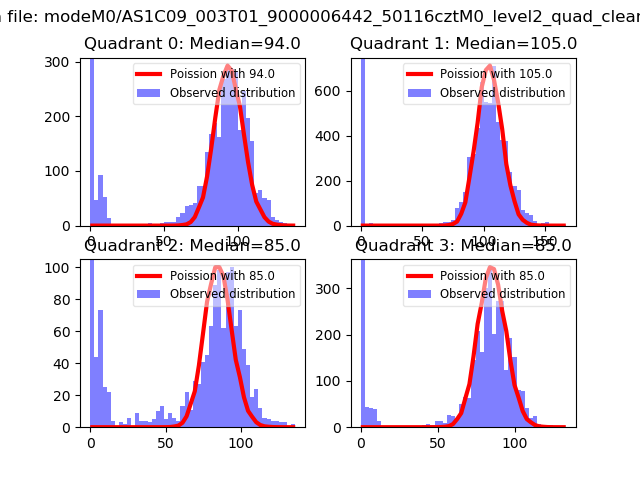 |
 |
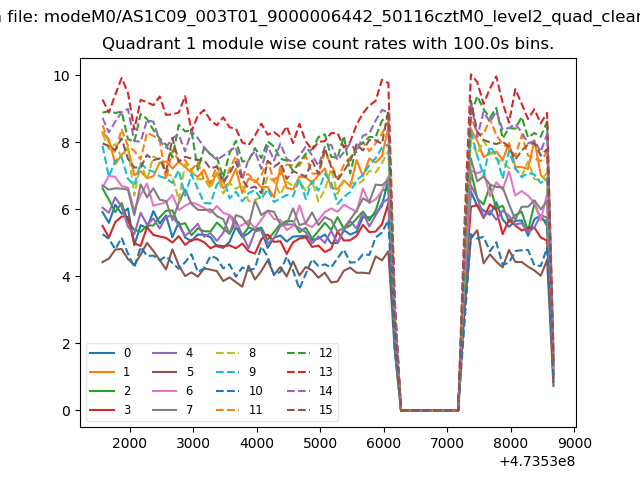
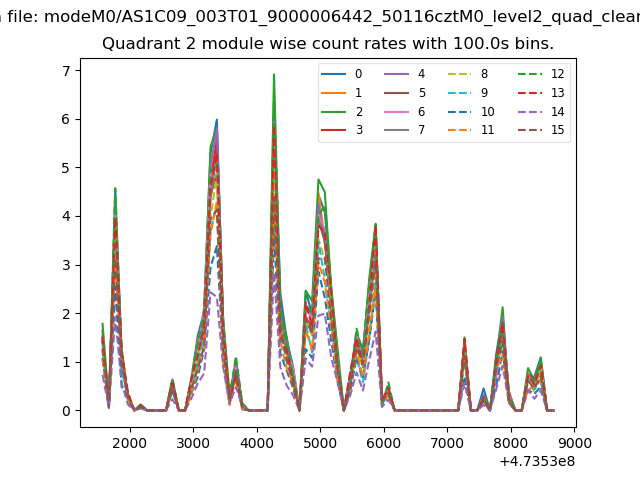
| Quadrant-wise count rates Data is divided into 100 sec bins |
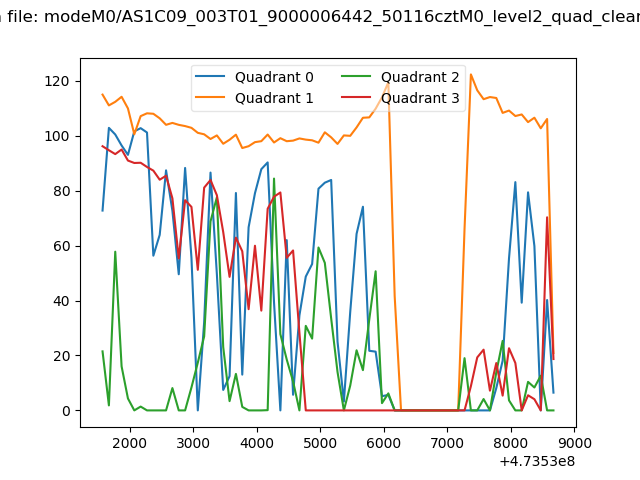 |
|
| Module-wise count rates for Quadrant A Data is divided into 100 sec bins |
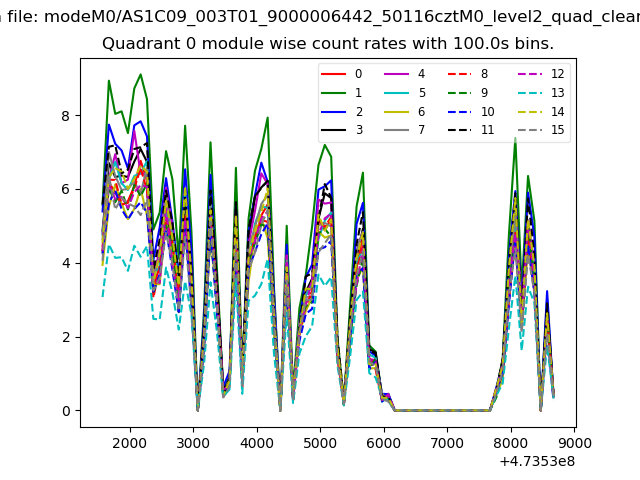 |
 |
| Module-wise count rates for Quadrant B Data is divided into 100 sec bins |
 |
 |
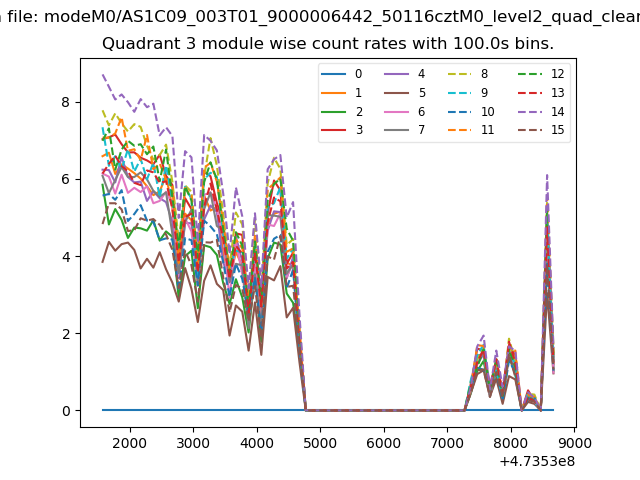
| Module-wise count rates for Quadrant C Data is divided into 100 sec bins |
 |
 |
| Module-wise count rates for Quadrant D Data is divided into 100 sec bins |
 |
 |
| Parameter | Plot |
|---|---|
| CZT HV Monitor | 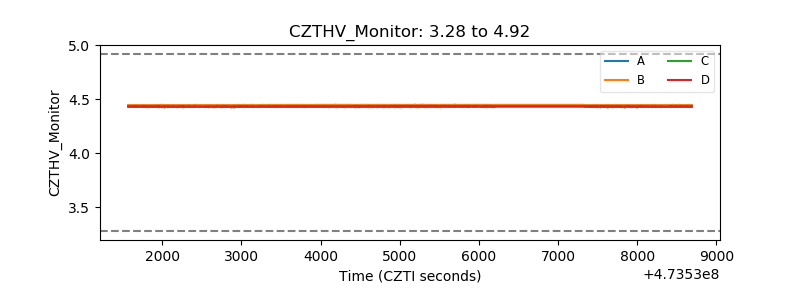 |
| D_VDD | 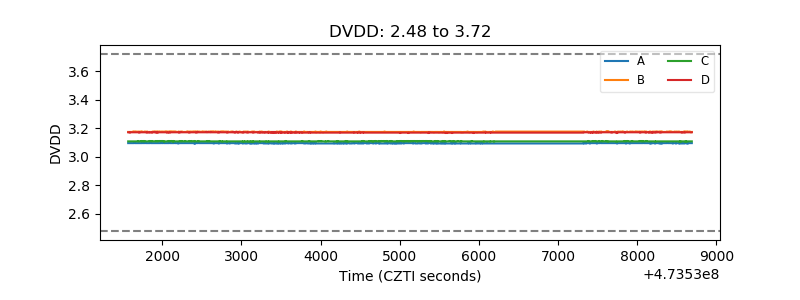 |
| Temperature 1 | 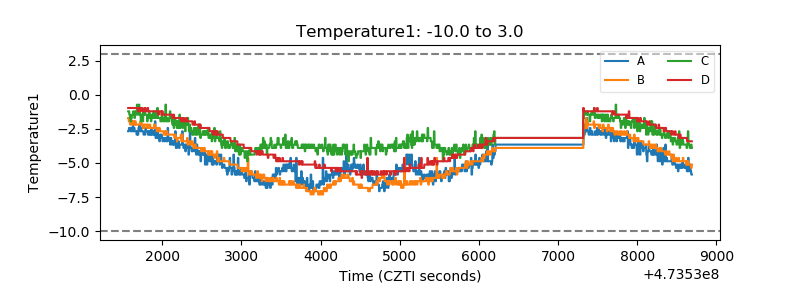 |
| Veto HV Monitor | 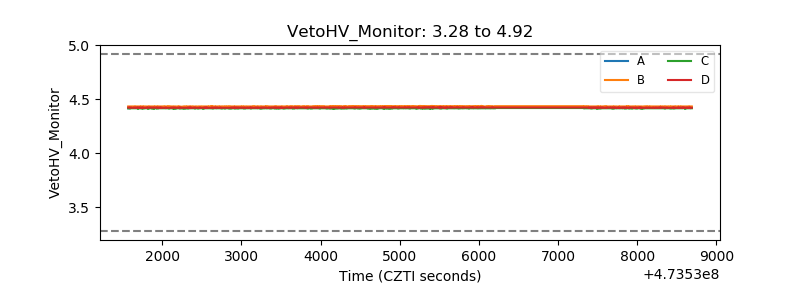 |
| Veto LLD | 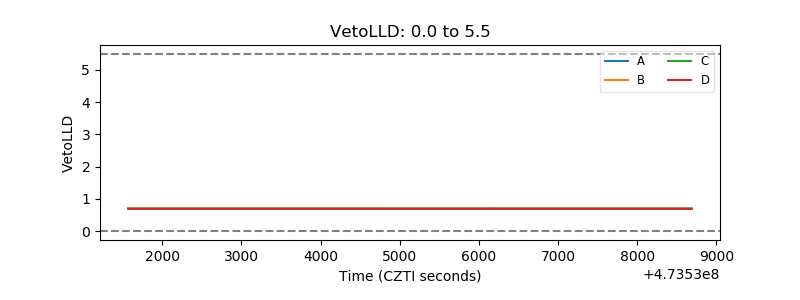 |
| Alpha Counter | 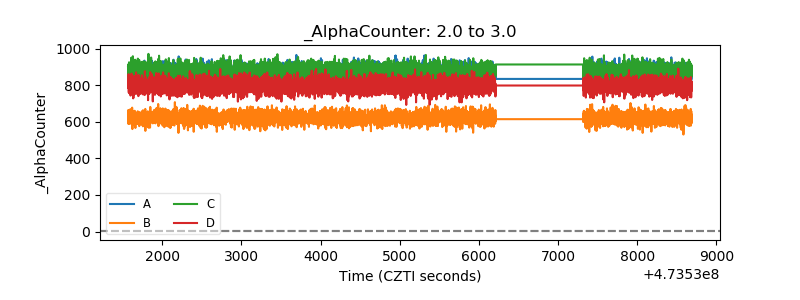 |
| _CPM_Rate | 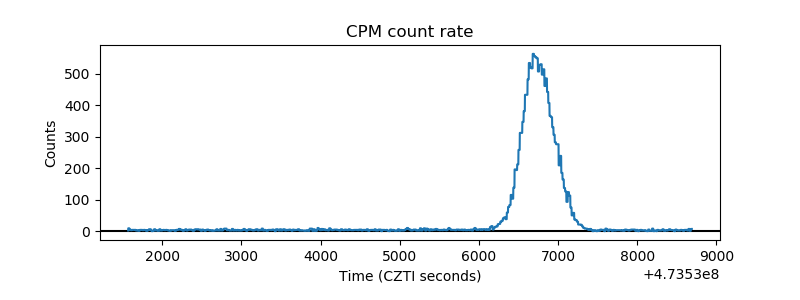 |
| CZT Counter | 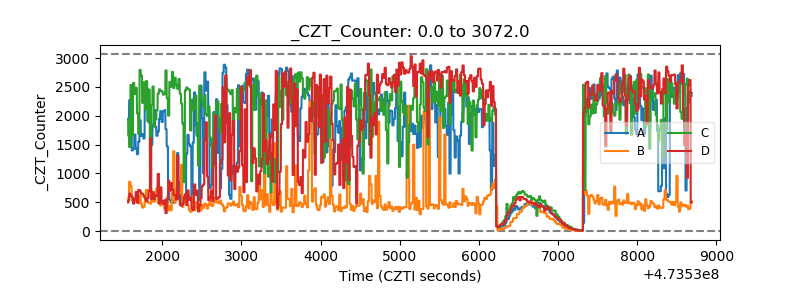 |
| +2.5 Volts monitor | 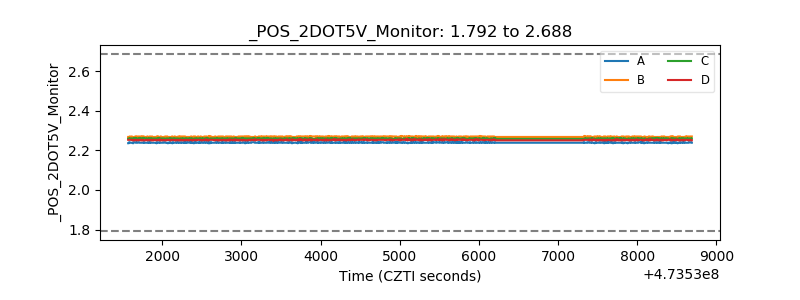 |
| +5 Volts monitor | 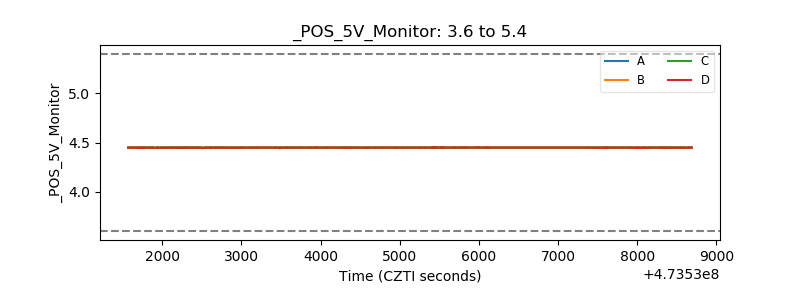 |
| _ROLL_ROT | 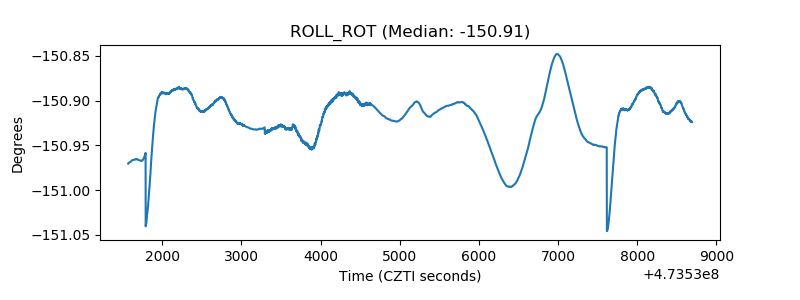 |
| _Roll_DEC | 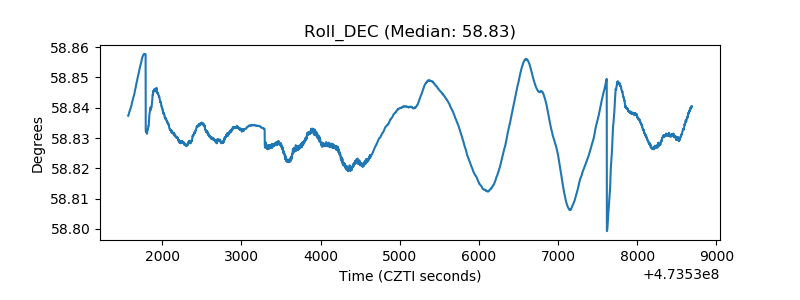 |
| _Roll_RA | 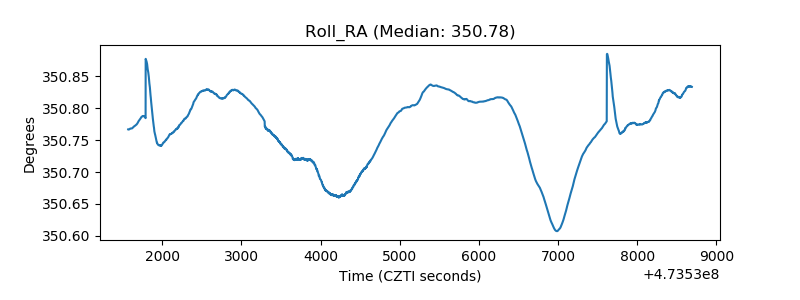 |
| Veto Counter | 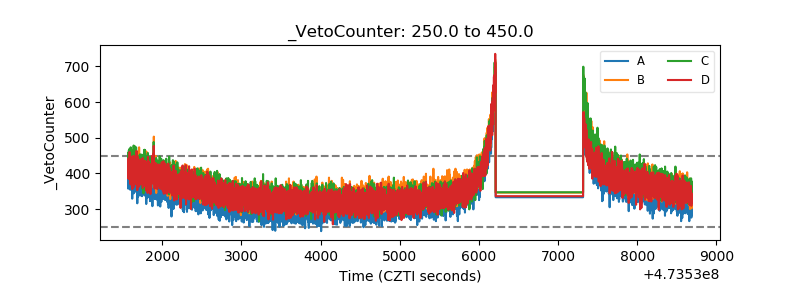 |