| Param | Original file | Final file |
|---|---|---|
| Filename | modeM0/AS1C09_003T01_9000006442_50117cztM0_level2.fits | modeM0/AS1C09_003T01_9000006442_50117cztM0_level2_quad_clean.evt |
| Size (bytes) | 1,247,927,040 | 53,389,440 |
| Size | 1.2 GB | 50.9 MB |
| Events in quadrant A | 14,156,532 | 224,842 |
| Events in quadrant B | 4,102,138 | 645,555 |
| Events in quadrant C | 15,001,904 | 33,500 |
| Events in quadrant D | 12,441,597 | 265,842 |
| Mode M9 | |||
|---|---|---|---|
| Quadrant | BADHDUFLAG | Total packets | Discarded packets |
| A | 0 | 11 | 0 |
| B | 0 | 11 | 0 |
| C | 0 | 11 | 0 |
| D | 0 | 11 | 0 |
| Mode M0 | |||
|---|---|---|---|
| Quadrant | BADHDUFLAG | Total packets | Discarded packets |
| A | 0 | 46383 | 1 |
| B | 0 | 16630 | 1 |
| C | 0 | 48952 | 1 |
| D | 0 | 41322 | 1 |
| Mode SS | |||
|---|---|---|---|
| Quadrant | BADHDUFLAG | Total packets | Discarded packets |
| A | 0 | 130 | 0 |
| B | 0 | 130 | 0 |
| C | 0 | 130 | 0 |
| D | 0 | 130 | 0 |
| Quadrant | Total seconds | Saturated seconds | Saturation percentage |
|---|---|---|---|
| A | 6399 | 4410 | 68.917018% |
| B | 6399 | 227 | 3.547429% |
| C | 6400 | 6117 | 95.578125% |
| D | 6400 | 3504 | 54.750000% |
Noise dominated data is calculated using 1-second bins in cleaned event files. If a bin has >2000 counts, and if more than 50% of those come from <1% of pixels, then it is considered to be noise-dominated and hence unusable.
| Quadrant | # 1 sec bins | Bins with >0 counts | Bins with >2000 counts | High rate bins dominated by noise | Noise dominated (total time) | Noise dominated (detector-on time) | Marked lightcurve |
|---|---|---|---|---|---|---|---|
| A | 7489 | 6400 | 4697 | 4697 | 62.72% | 73.39% | 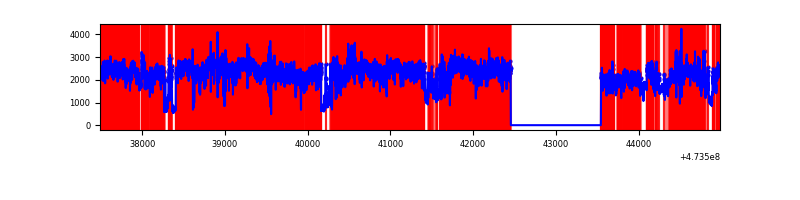 |
| B | 7489 | 6400 | 177 | 177 | 2.36% | 2.77% | 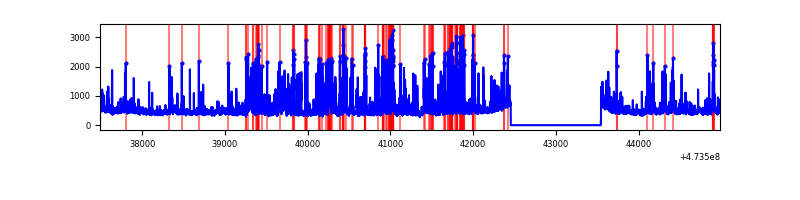 |
| C | 7490 | 6401 | 4888 | 4888 | 65.26% | 76.36% | 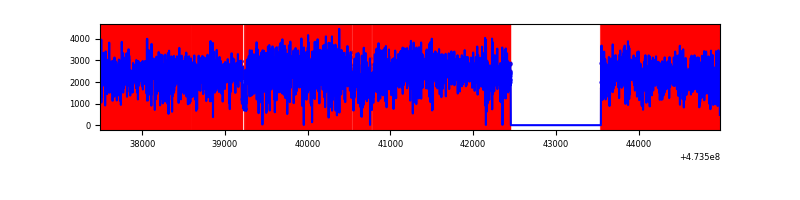 |
| D | 7490 | 6401 | 3529 | 3529 | 47.12% | 55.13% | 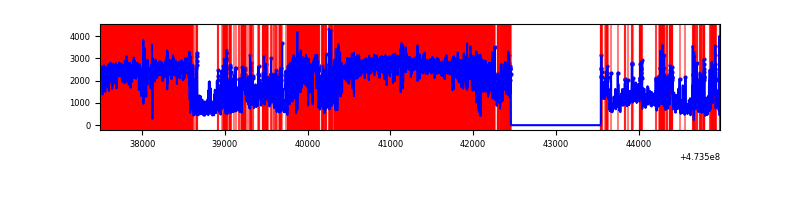 |
Top three noisy pixels from each quadrant. If the there are fewer than three noisy pixels in the level2.evt file, extra rows are filled as -1
| Pixel properties | Quadrant properties | ||||||
|---|---|---|---|---|---|---|---|
| Quadrant | DetID | PixID | Counts | Sigma | Mean | Median | Sigma |
| A | 6 | 250 | 6930871 | 57296.3 | 476 | 466 | 121.0 |
| A | 8 | 8 | 2489595 | 20578.58 | 476 | 466 | 121.0 |
| A | 0 | 98 | 1085500 | 8970.39 | 476 | 466 | 121.0 |
| B | 2 | 176 | 904447 | 6623.2 | 647 | 625 | 136.5 |
| B | 4 | 206 | 151626 | 1106.53 | 647 | 625 | 136.5 |
| B | 10 | 76 | 81808 | 594.91 | 647 | 625 | 136.5 |
| C | 4 | 111 | 5712934 | 93700.38 | 214 | 212 | 61.0 |
| C | 15 | 214 | 5433013 | 89109.1 | 214 | 212 | 61.0 |
| C | 15 | 178 | 645240 | 10579.78 | 214 | 212 | 61.0 |
| D | 12 | 191 | 3868674 | 26758.91 | 485 | 467 | 144.6 |
| D | 15 | 106 | 2010191 | 13902.57 | 485 | 467 | 144.6 |
| D | 15 | 218 | 410786 | 2838.44 | 485 | 467 | 144.6 |
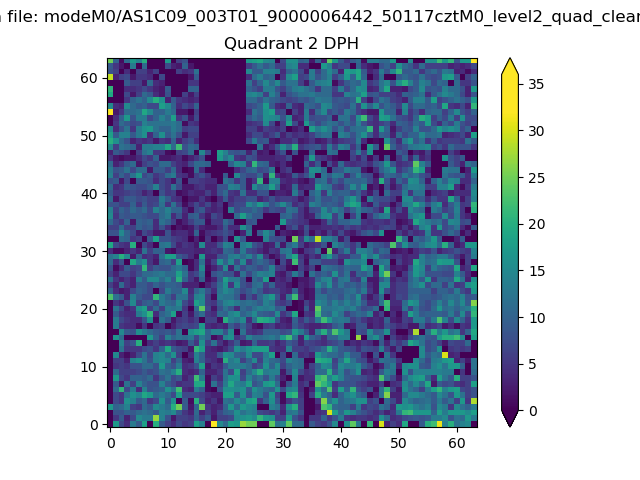
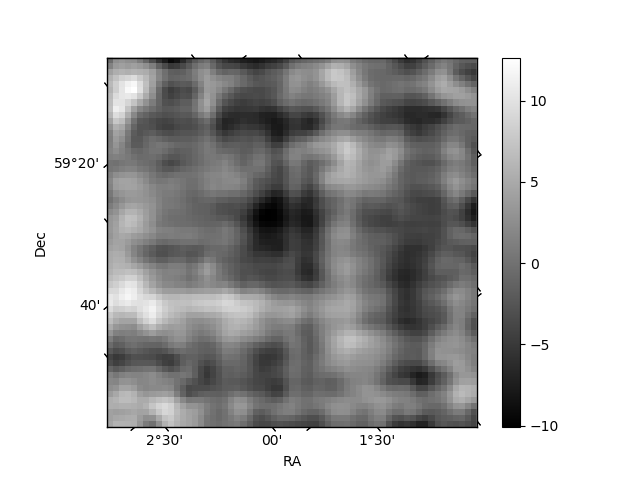
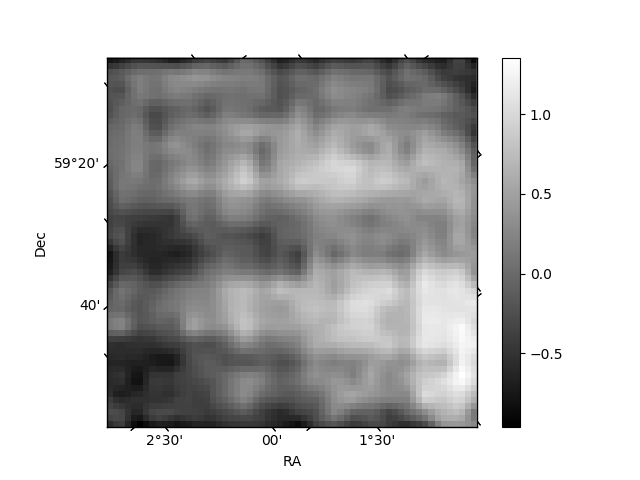
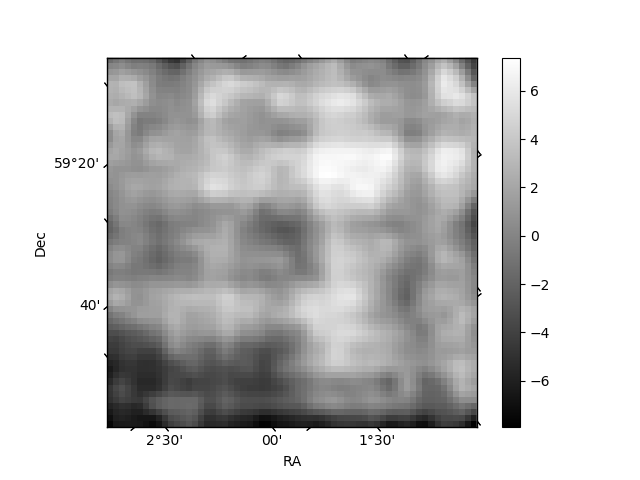
Histogram calculated using DETX and DETY for each event in the final _common_clean file
| Quadrant A | 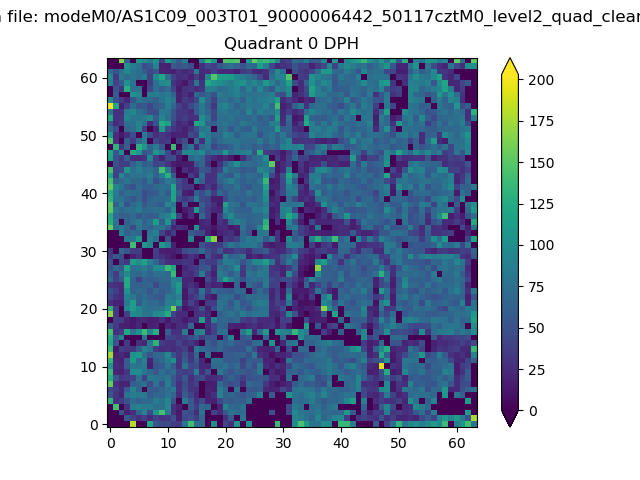 |
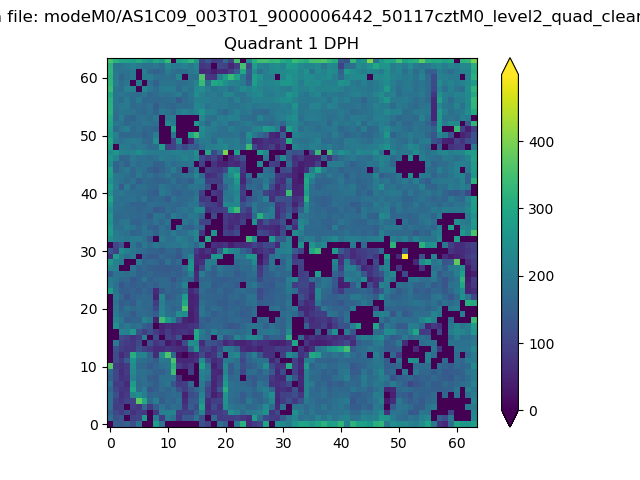 |
Quadrant B |
|---|---|---|---|
| Quadrant D | 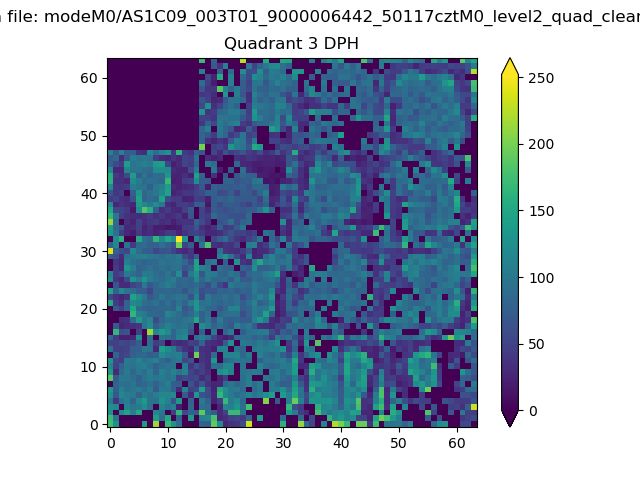 |
 |
Quadrant C |
| Plot type | Count rate plots | Images |
|---|---|---|
| Comparison with Poisson distribution Blue bars denote a histogram of data divided into 1 sec bins. Red curve is a Poisson curve with rate = median count rate of data. |
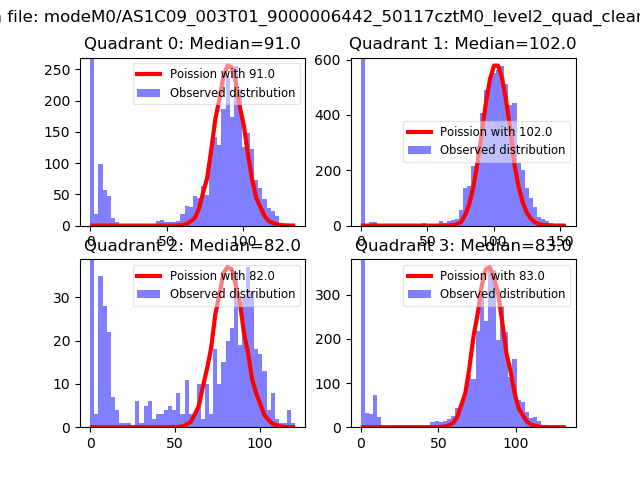 |
 |
| Quadrant-wise count rates Data is divided into 100 sec bins |
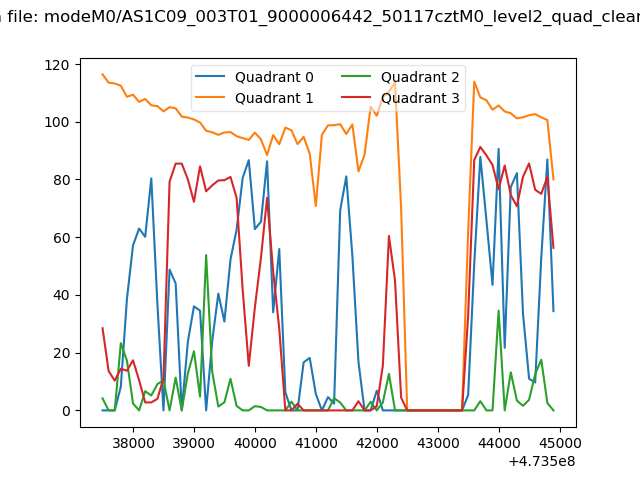 |
|
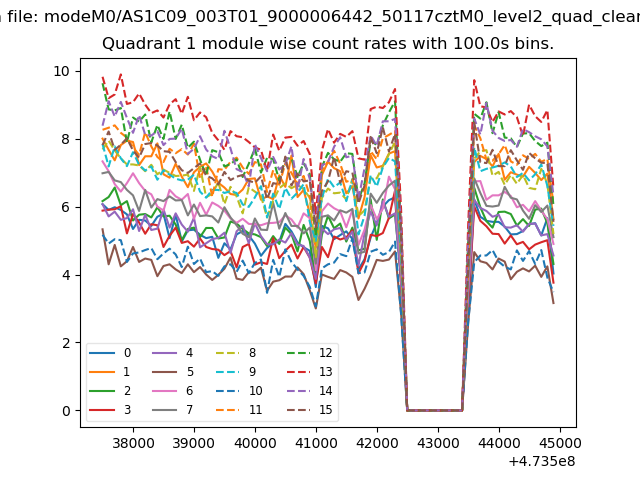
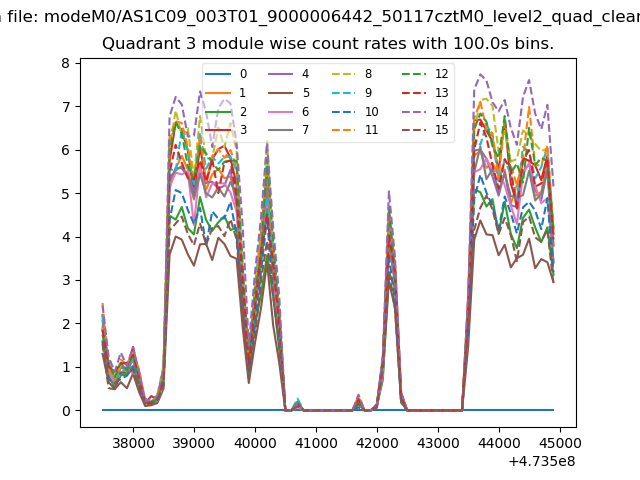
| Module-wise count rates for Quadrant A Data is divided into 100 sec bins |
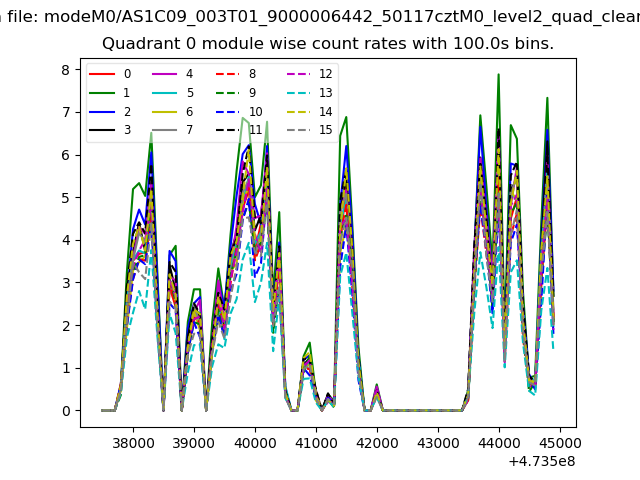 |
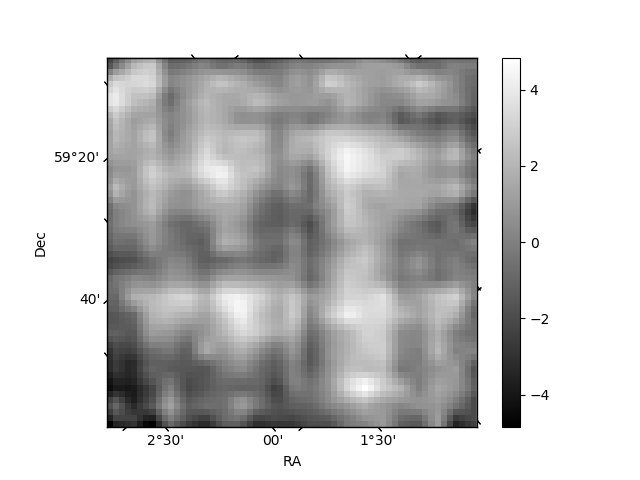 |
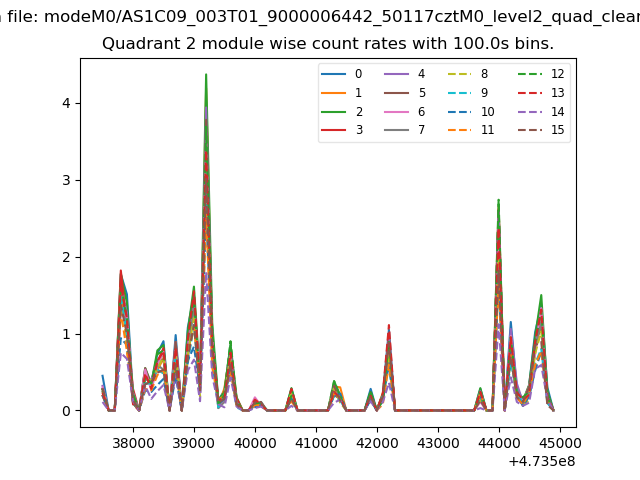
| Module-wise count rates for Quadrant B Data is divided into 100 sec bins |
 |
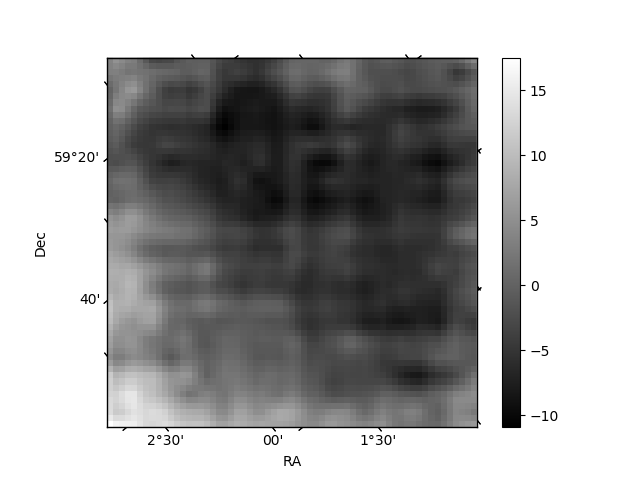 |
| Module-wise count rates for Quadrant C Data is divided into 100 sec bins |
 |
 |
| Module-wise count rates for Quadrant D Data is divided into 100 sec bins |
 |
 |
| Parameter | Plot |
|---|---|
| CZT HV Monitor | 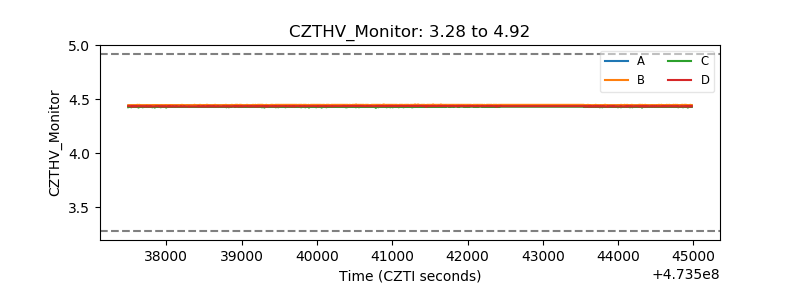 |
| D_VDD | 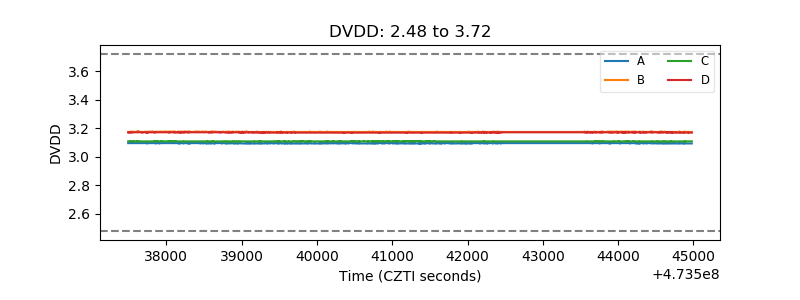 |
| Temperature 1 | 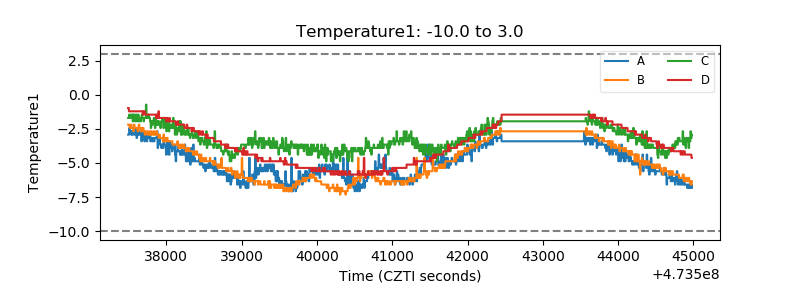 |
| Veto HV Monitor | 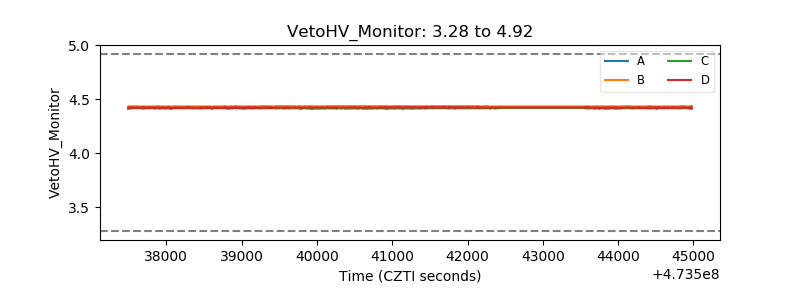 |
| Veto LLD | 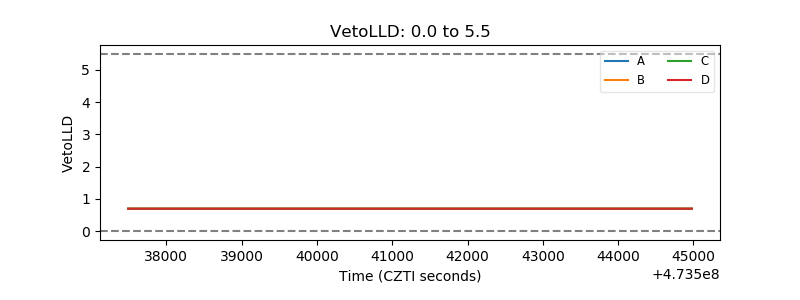 |
| Alpha Counter | 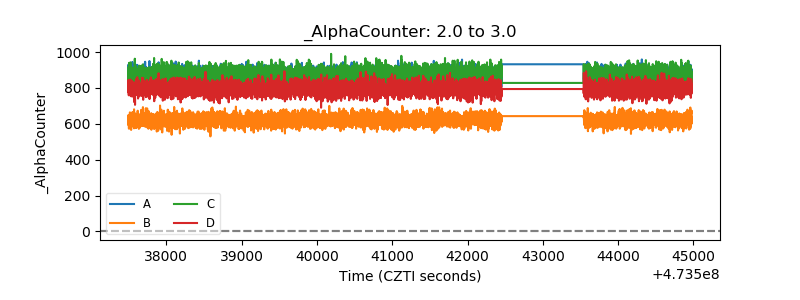 |
| _CPM_Rate | 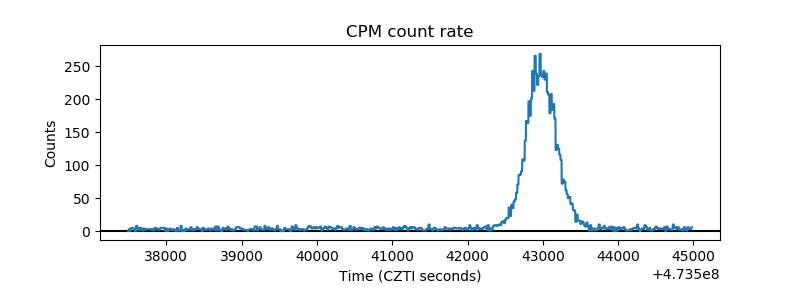 |
| CZT Counter | 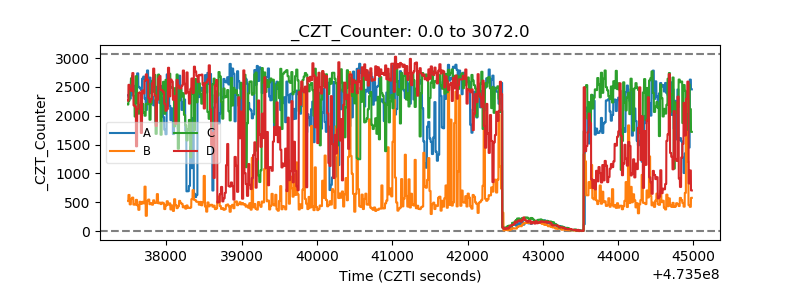 |
| +2.5 Volts monitor | 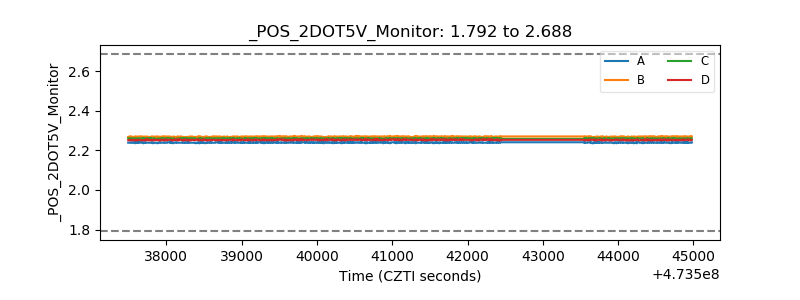 |
| +5 Volts monitor | 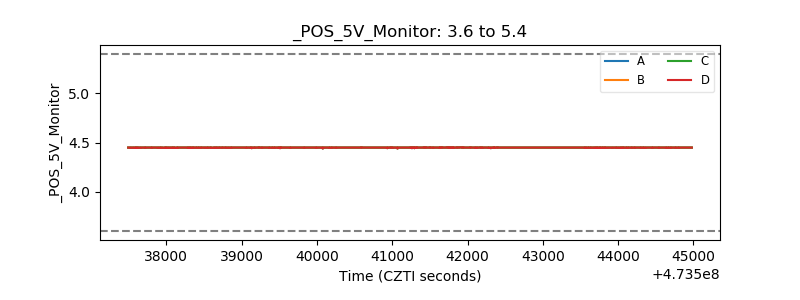 |
| _ROLL_ROT | 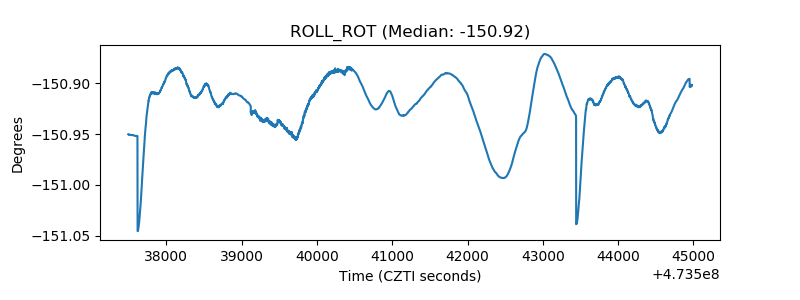 |
| _Roll_DEC | 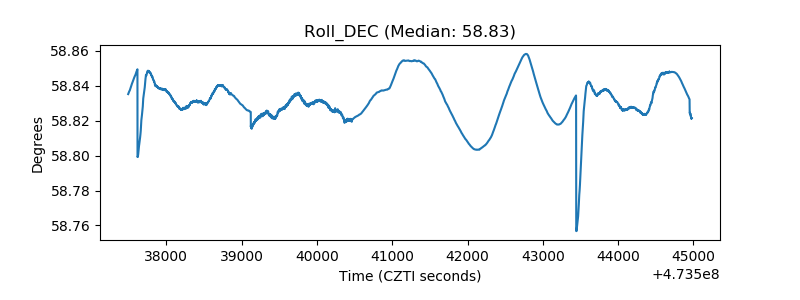 |
| _Roll_RA | 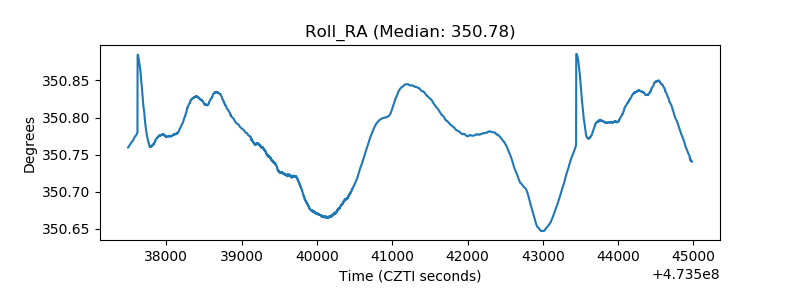 |
| Veto Counter | 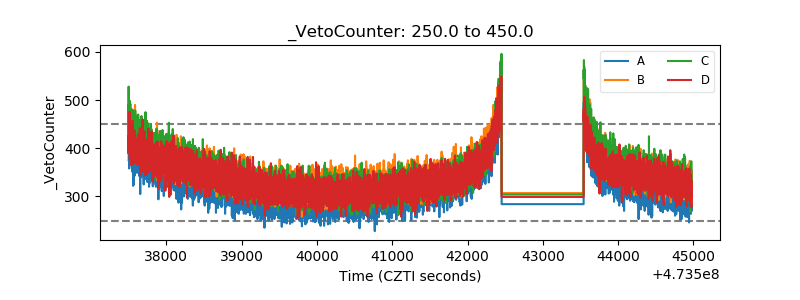 |