| Param | Original file | Final file |
|---|---|---|
| Filename | modeM0/AS1C09_003T01_9000006442_50118cztM0_level2.fits | modeM0/AS1C09_003T01_9000006442_50118cztM0_level2_quad_clean.evt |
| Size (bytes) | 1,271,272,320 | 56,021,760 |
| Size | 1.2 GB | 53.4 MB |
| Events in quadrant A | 14,694,156 | 182,308 |
| Events in quadrant B | 4,999,609 | 635,812 |
| Events in quadrant C | 14,735,617 | 68,233 |
| Events in quadrant D | 12,117,126 | 345,236 |
| Mode M9 | |||
|---|---|---|---|
| Quadrant | BADHDUFLAG | Total packets | Discarded packets |
| A | 0 | 8 | 0 |
| B | 0 | 8 | 0 |
| C | 0 | 8 | 0 |
| D | 0 | 8 | 0 |
| Mode M0 | |||
|---|---|---|---|
| Quadrant | BADHDUFLAG | Total packets | Discarded packets |
| A | 0 | 48167 | 1 |
| B | 0 | 19434 | 1 |
| C | 0 | 48273 | 1 |
| D | 0 | 40591 | 3 |
| Mode SS | |||
|---|---|---|---|
| Quadrant | BADHDUFLAG | Total packets | Discarded packets |
| A | 0 | 136 | 0 |
| B | 0 | 136 | 0 |
| C | 0 | 136 | 0 |
| D | 0 | 136 | 0 |
| Quadrant | Total seconds | Saturated seconds | Saturation percentage |
|---|---|---|---|
| A | 6654 | 4961 | 74.556658% |
| B | 6654 | 474 | 7.123535% |
| C | 6655 | 5999 | 90.142750% |
| D | 6654 | 2824 | 42.440637% |
Noise dominated data is calculated using 1-second bins in cleaned event files. If a bin has >2000 counts, and if more than 50% of those come from <1% of pixels, then it is considered to be noise-dominated and hence unusable.
| Quadrant | # 1 sec bins | Bins with >0 counts | Bins with >2000 counts | High rate bins dominated by noise | Noise dominated (total time) | Noise dominated (detector-on time) | Marked lightcurve |
|---|---|---|---|---|---|---|---|
| A | 7444 | 6655 | 4794 | 4794 | 64.40% | 72.04% | 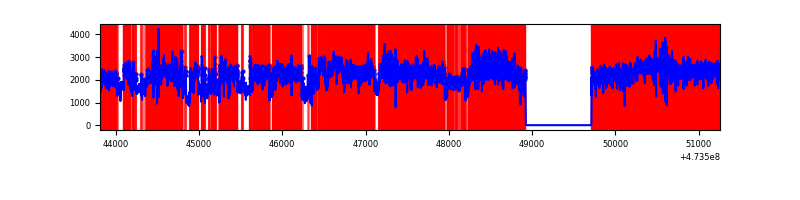 |
| B | 7444 | 6655 | 364 | 364 | 4.89% | 5.47% | 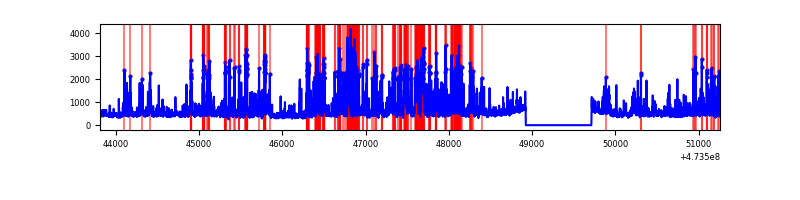 |
| C | 7445 | 6656 | 4470 | 4470 | 60.04% | 67.16% | 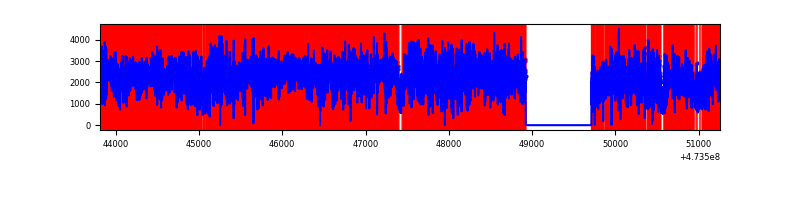 |
| D | 7444 | 6655 | 2999 | 2999 | 40.29% | 45.06% | 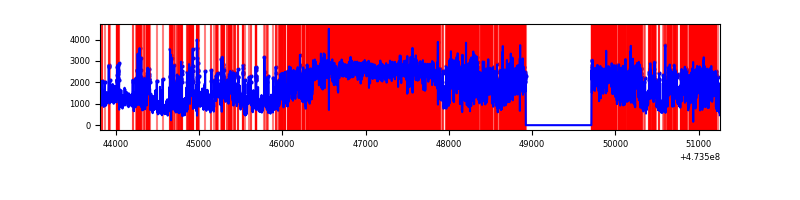 |
Top three noisy pixels from each quadrant. If the there are fewer than three noisy pixels in the level2.evt file, extra rows are filled as -1
| Pixel properties | Quadrant properties | ||||||
|---|---|---|---|---|---|---|---|
| Quadrant | DetID | PixID | Counts | Sigma | Mean | Median | Sigma |
| A | 6 | 250 | 5456790 | 44794.21 | 478 | 466 | 121.8 |
| A | 8 | 8 | 5130715 | 42117.27 | 478 | 466 | 121.8 |
| A | 0 | 98 | 1002507 | 8226.35 | 478 | 466 | 121.8 |
| B | 2 | 176 | 1249938 | 9020.89 | 659 | 638 | 138.5 |
| B | 4 | 206 | 215273 | 1549.83 | 659 | 638 | 138.5 |
| B | 5 | 185 | 208342 | 1499.78 | 659 | 638 | 138.5 |
| C | 4 | 111 | 6604666 | 96399.07 | 241 | 240 | 68.5 |
| C | 15 | 230 | 2322627 | 33897.86 | 241 | 240 | 68.5 |
| C | 1 | 60 | 1962009 | 28634.24 | 241 | 240 | 68.5 |
| D | 12 | 191 | 3654302 | 23182.66 | 557 | 539 | 157.6 |
| D | 15 | 106 | 1907749 | 12101.0 | 557 | 539 | 157.6 |
| D | 15 | 168 | 781249 | 4953.5 | 557 | 539 | 157.6 |
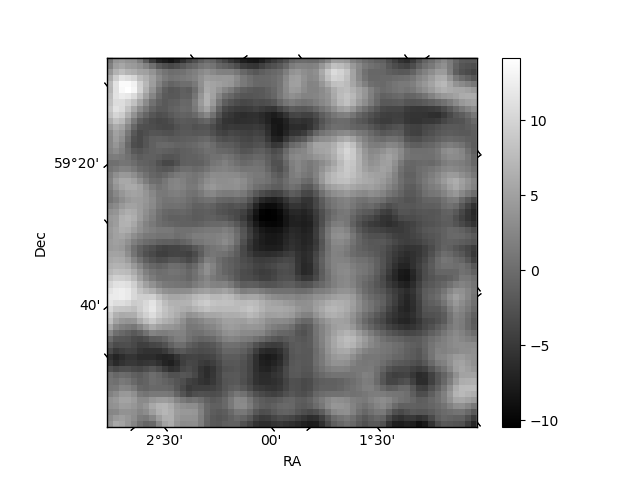
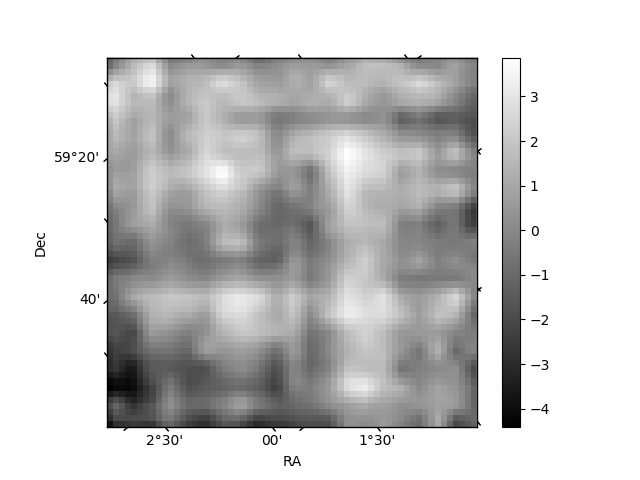
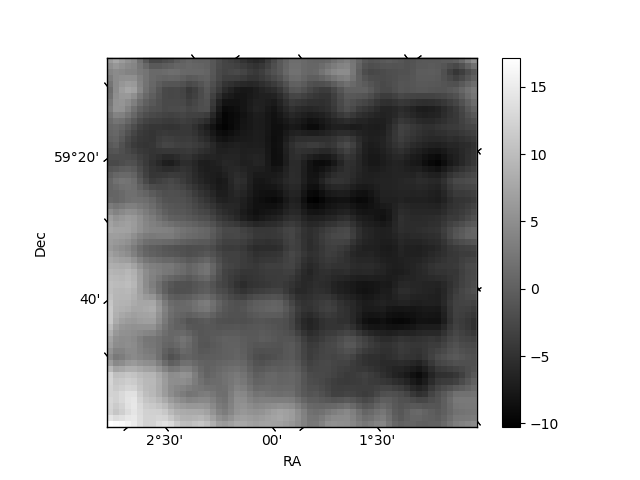
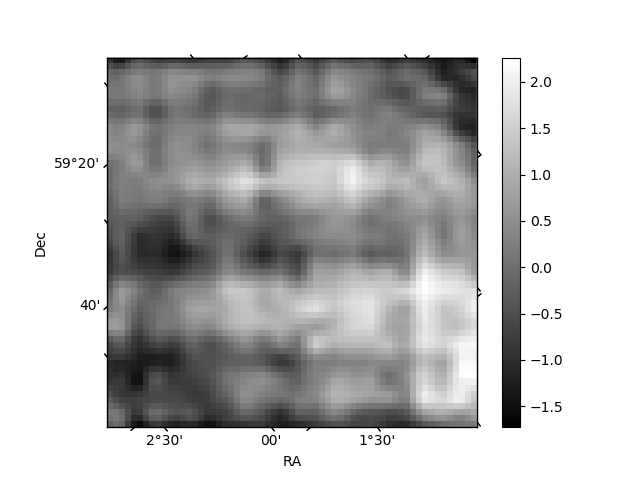
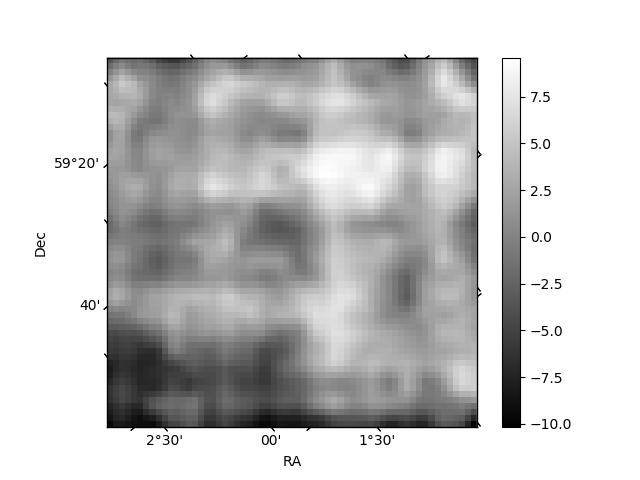
Histogram calculated using DETX and DETY for each event in the final _common_clean file
| Quadrant A | 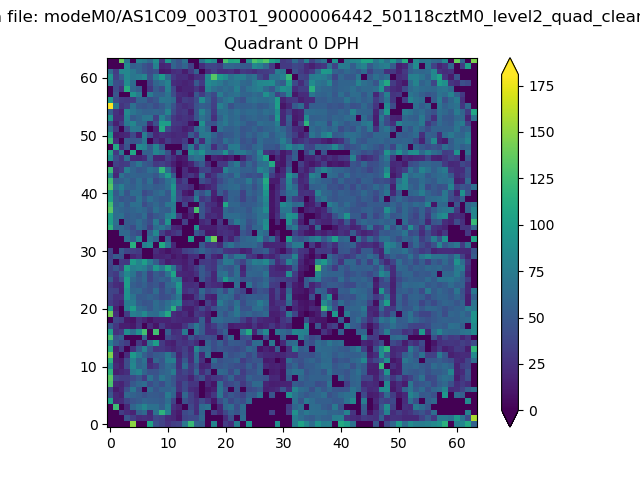 |
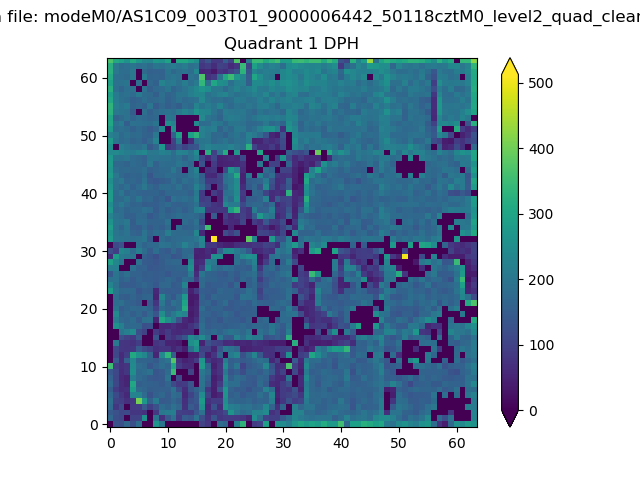 |
Quadrant B |
|---|---|---|---|
| Quadrant D | 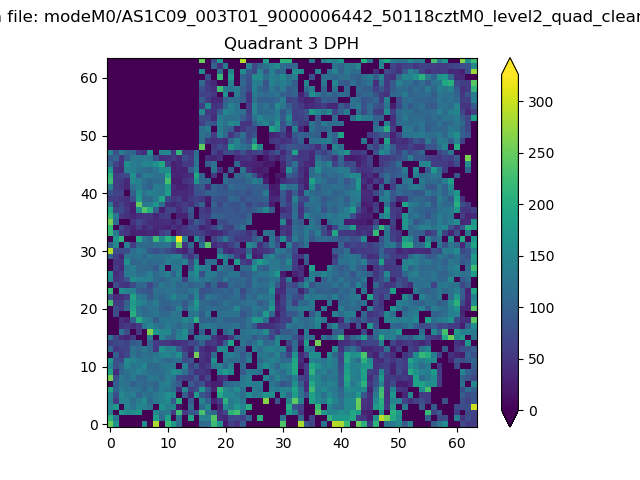 |
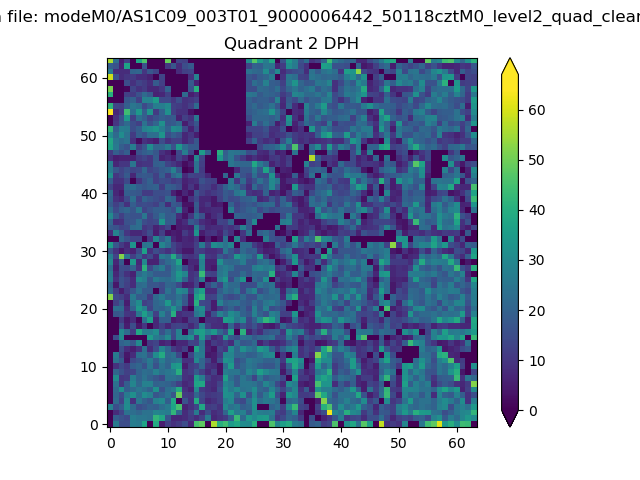 |
Quadrant C |
| Plot type | Count rate plots | Images |
|---|---|---|
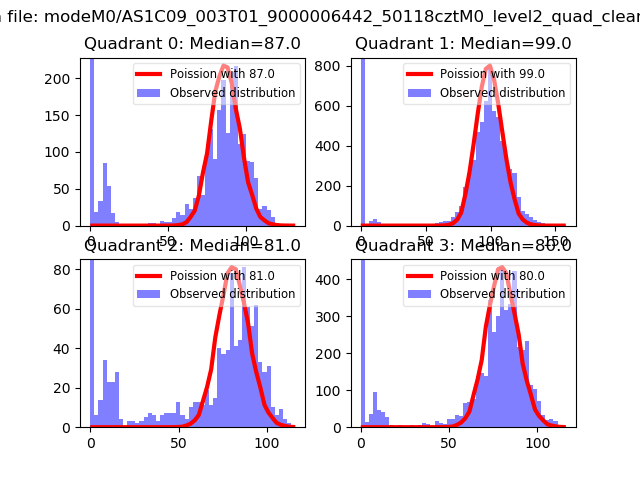
| Comparison with Poisson distribution Blue bars denote a histogram of data divided into 1 sec bins. Red curve is a Poisson curve with rate = median count rate of data. |
 |
 |
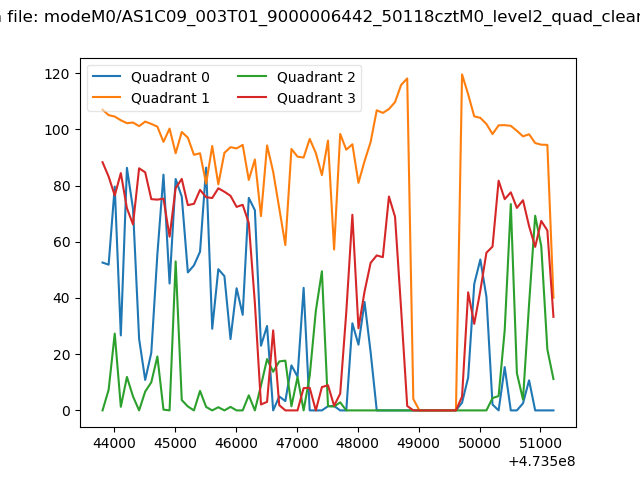
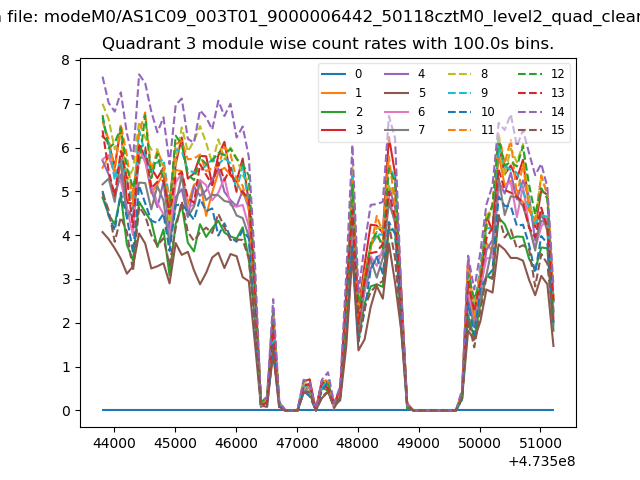
| Quadrant-wise count rates Data is divided into 100 sec bins |
 |
|
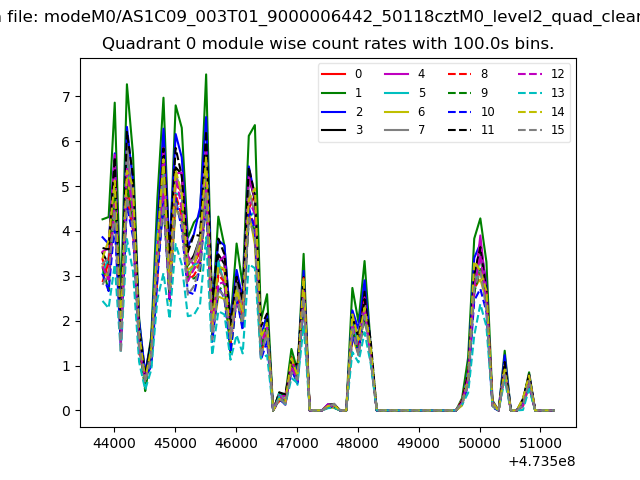
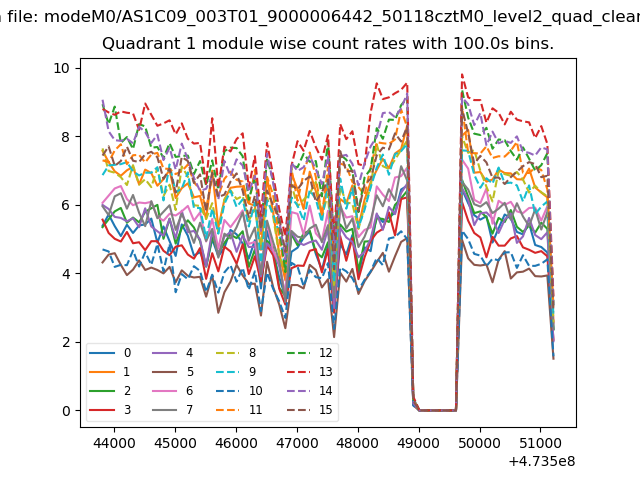
| Module-wise count rates for Quadrant A Data is divided into 100 sec bins |
 |
 |
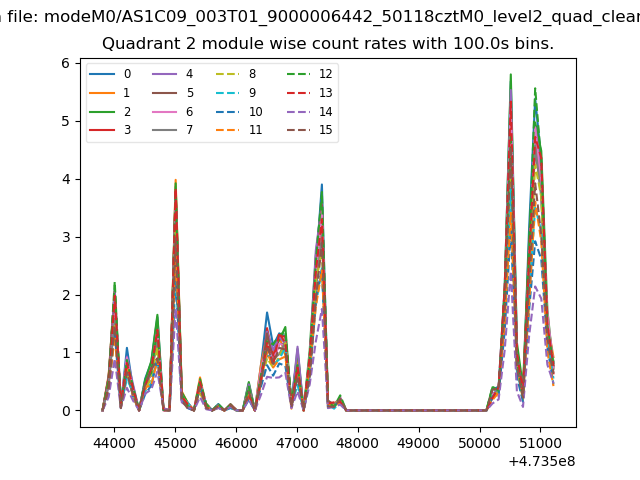
| Module-wise count rates for Quadrant B Data is divided into 100 sec bins |
 |
 |
| Module-wise count rates for Quadrant C Data is divided into 100 sec bins |
 |
 |
| Module-wise count rates for Quadrant D Data is divided into 100 sec bins |
 |
 |
| Parameter | Plot |
|---|---|
| CZT HV Monitor | 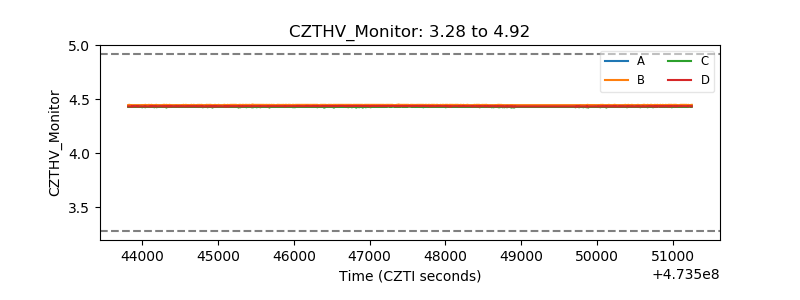 |
| D_VDD | 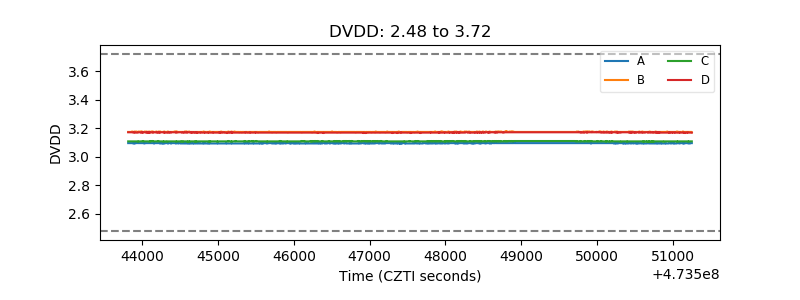 |
| Temperature 1 | 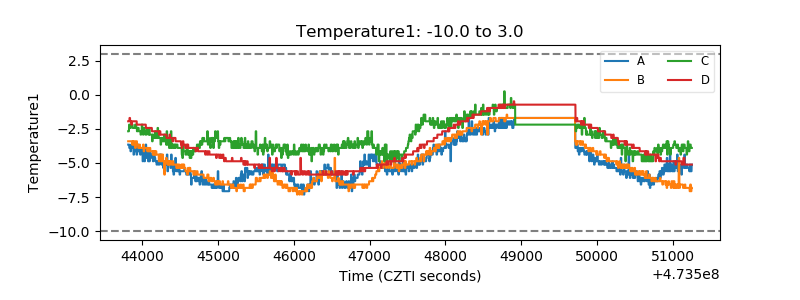 |
| Veto HV Monitor | 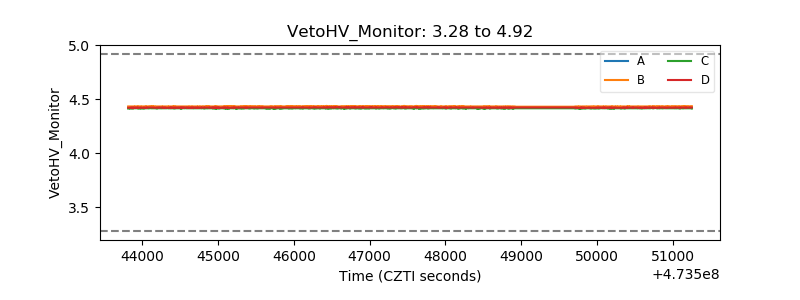 |
| Veto LLD | 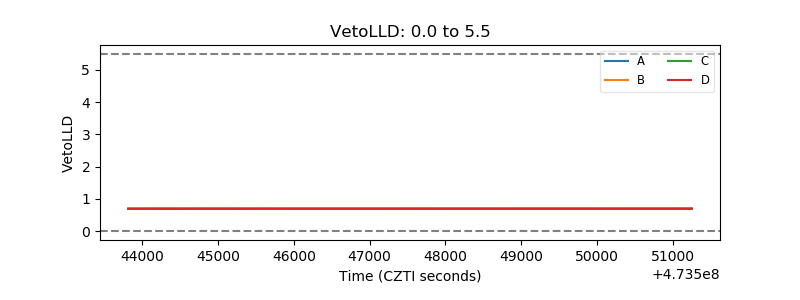 |
| Alpha Counter | 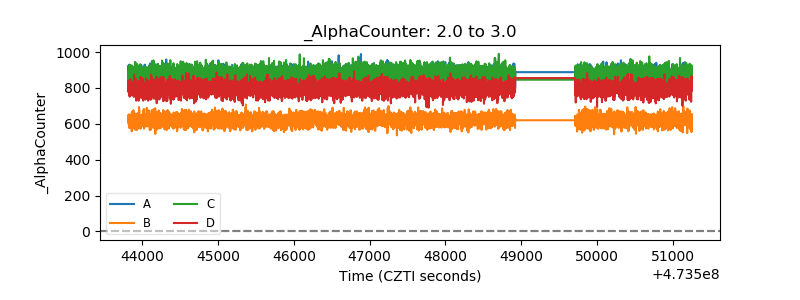 |
| _CPM_Rate | 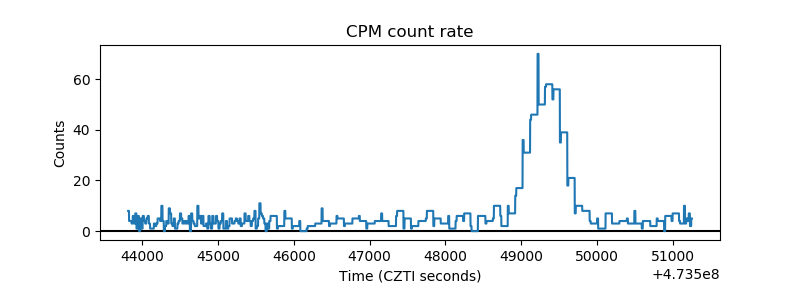 |
| CZT Counter | 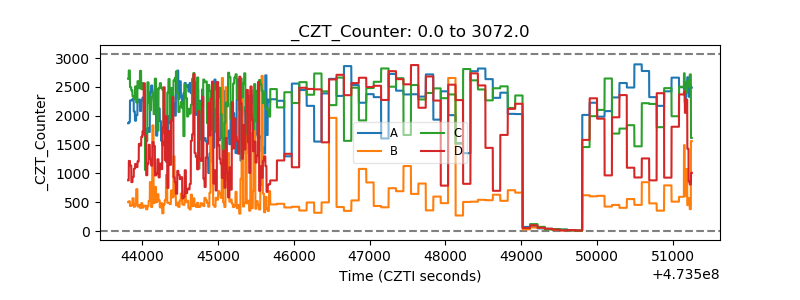 |
| +2.5 Volts monitor | 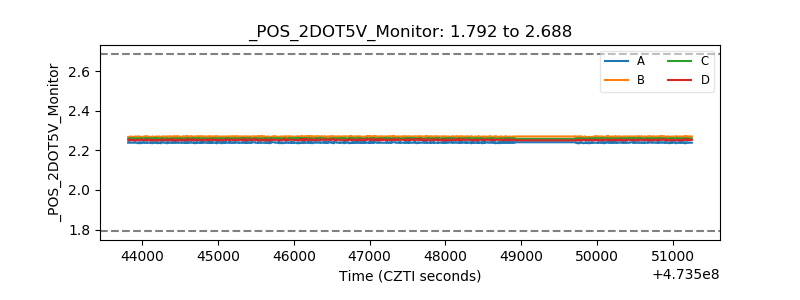 |
| +5 Volts monitor | 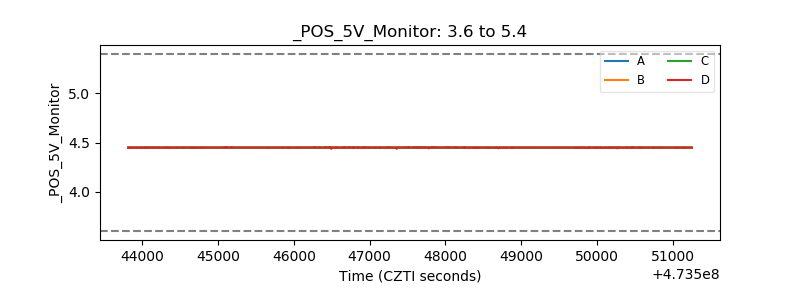 |
| _ROLL_ROT | 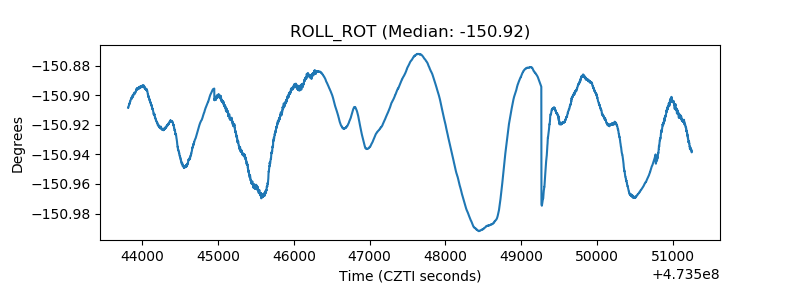 |
| _Roll_DEC | 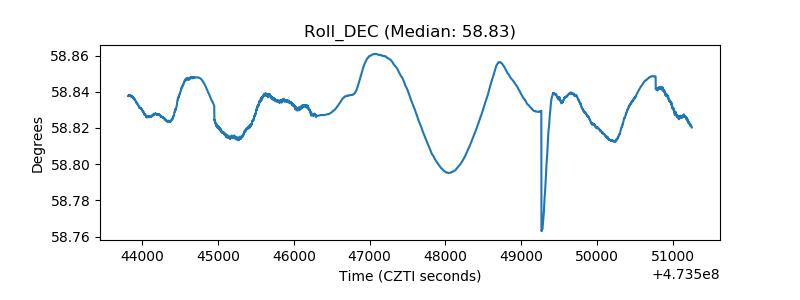 |
| _Roll_RA | 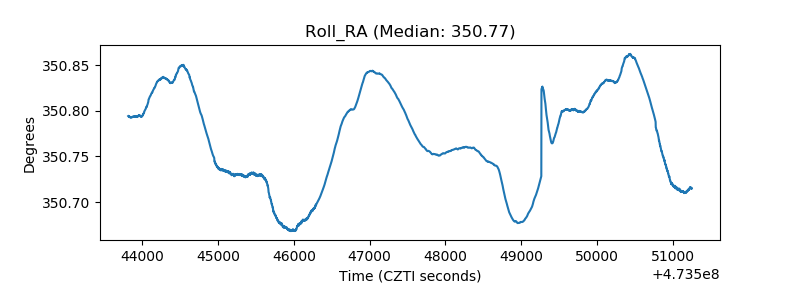 |
| Veto Counter | 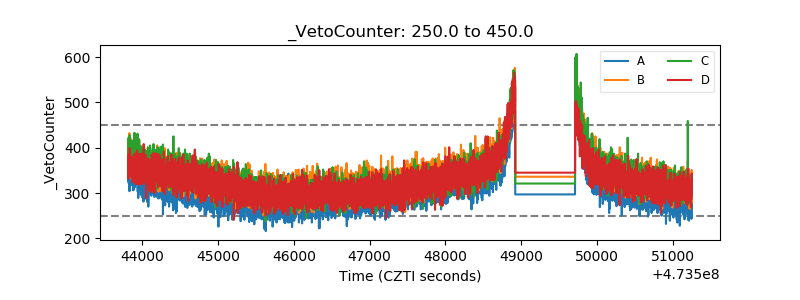 |