| Param | Original file | Final file |
|---|---|---|
| Filename | modeM0/AS1C09_003T01_9000006442_50119cztM0_level2.fits | modeM0/AS1C09_003T01_9000006442_50119cztM0_level2_quad_clean.evt |
| Size (bytes) | 1,308,061,440 | 58,322,880 |
| Size | 1.2 GB | 55.6 MB |
| Events in quadrant A | 15,333,781 | 123,506 |
| Events in quadrant B | 5,165,330 | 665,529 |
| Events in quadrant C | 13,056,048 | 217,871 |
| Events in quadrant D | 14,327,786 | 272,513 |
| Mode M9 | |||
|---|---|---|---|
| Quadrant | BADHDUFLAG | Total packets | Discarded packets |
| A | 0 | 3 | 0 |
| B | 0 | 3 | 0 |
| C | 0 | 3 | 0 |
| D | 0 | 3 | 0 |
| Mode M0 | |||
|---|---|---|---|
| Quadrant | BADHDUFLAG | Total packets | Discarded packets |
| A | 0 | 50315 | 1 |
| B | 0 | 20178 | 1 |
| C | 0 | 43593 | 2 |
| D | 0 | 47386 | 1 |
| Mode SS | |||
|---|---|---|---|
| Quadrant | BADHDUFLAG | Total packets | Discarded packets |
| A | 0 | 142 | 0 |
| B | 0 | 142 | 0 |
| C | 0 | 142 | 0 |
| D | 0 | 142 | 0 |
| Quadrant | Total seconds | Saturated seconds | Saturation percentage |
|---|---|---|---|
| A | 6979 | 5821 | 83.407365% |
| B | 6979 | 503 | 7.207336% |
| C | 6978 | 4704 | 67.411866% |
| D | 6978 | 4087 | 58.569791% |
Noise dominated data is calculated using 1-second bins in cleaned event files. If a bin has >2000 counts, and if more than 50% of those come from <1% of pixels, then it is considered to be noise-dominated and hence unusable.
| Quadrant | # 1 sec bins | Bins with >0 counts | Bins with >2000 counts | High rate bins dominated by noise | Noise dominated (total time) | Noise dominated (detector-on time) | Marked lightcurve |
|---|---|---|---|---|---|---|---|
| A | 7209 | 6981 | 5045 | 5045 | 69.98% | 72.27% | 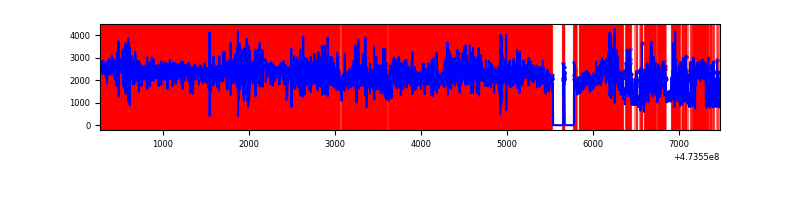 |
| B | 7209 | 6981 | 366 | 366 | 5.08% | 5.24% | 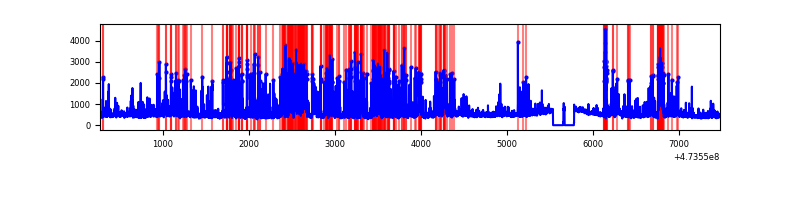 |
| C | 7207 | 6978 | 3243 | 3243 | 45.00% | 46.47% | 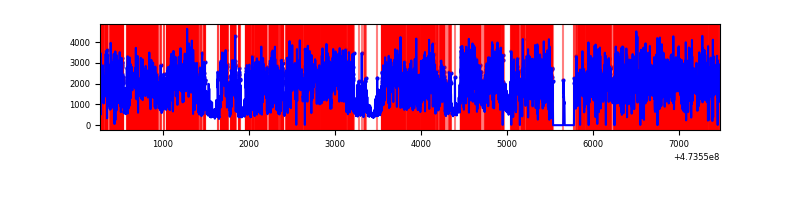 |
| D | 7208 | 6980 | 4140 | 4140 | 57.44% | 59.31% | 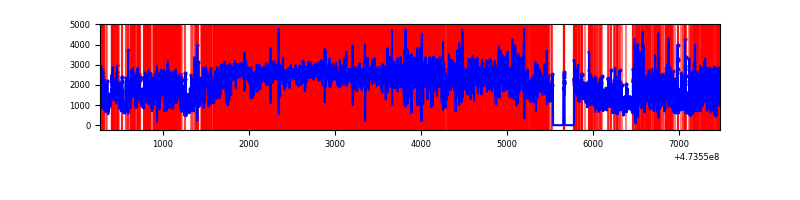 |
Top three noisy pixels from each quadrant. If the there are fewer than three noisy pixels in the level2.evt file, extra rows are filled as -1
| Pixel properties | Quadrant properties | ||||||
|---|---|---|---|---|---|---|---|
| Quadrant | DetID | PixID | Counts | Sigma | Mean | Median | Sigma |
| A | 6 | 250 | 5896940 | 49335.52 | 459 | 447 | 119.5 |
| A | 8 | 8 | 3776769 | 31596.2 | 459 | 447 | 119.5 |
| A | 4 | 13 | 1667327 | 13946.66 | 459 | 447 | 119.5 |
| B | 2 | 176 | 1322676 | 8979.05 | 701 | 677 | 147.2 |
| B | 5 | 185 | 214256 | 1450.63 | 701 | 677 | 147.2 |
| B | 4 | 216 | 203226 | 1375.72 | 701 | 677 | 147.2 |
| C | 4 | 111 | 7816633 | 70826.41 | 374 | 371 | 110.4 |
| C | 15 | 230 | 1398643 | 12670.33 | 374 | 371 | 110.4 |
| C | 15 | 147 | 410931 | 3720.26 | 374 | 371 | 110.4 |
| D | 12 | 191 | 3632095 | 22779.38 | 546 | 527 | 159.4 |
| D | 15 | 168 | 2318089 | 14537.14 | 546 | 527 | 159.4 |
| D | 15 | 106 | 2022275 | 12681.62 | 546 | 527 | 159.4 |
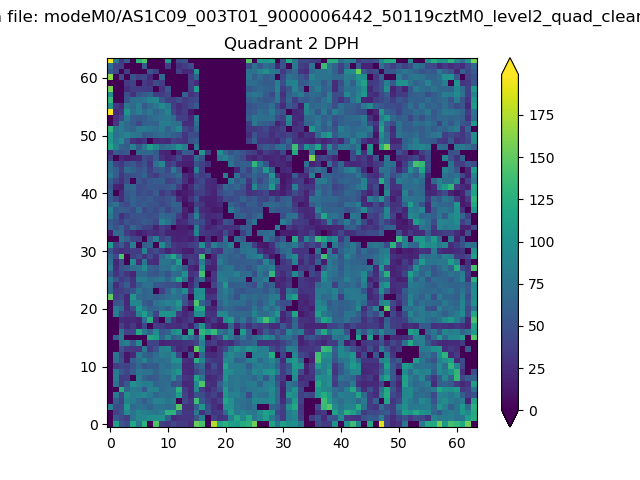
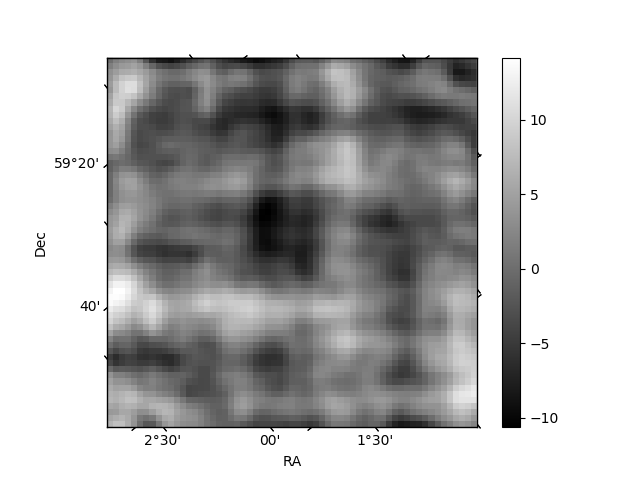
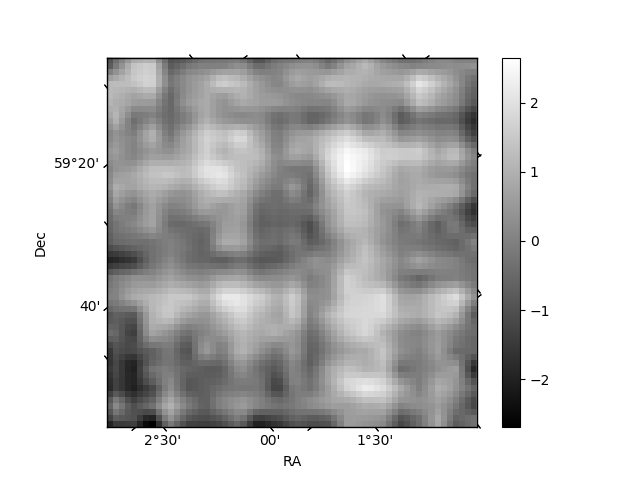
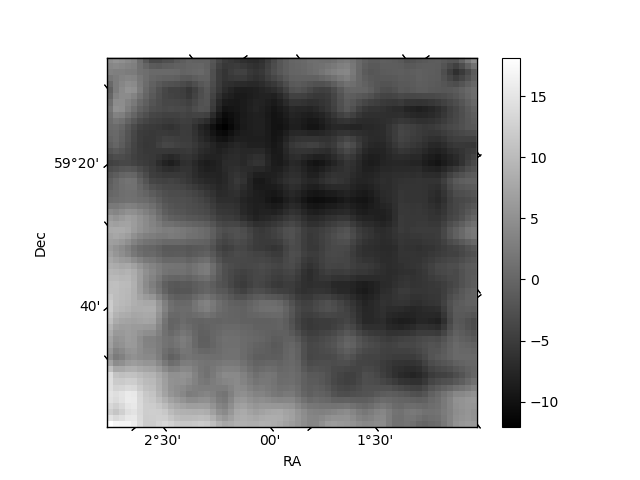
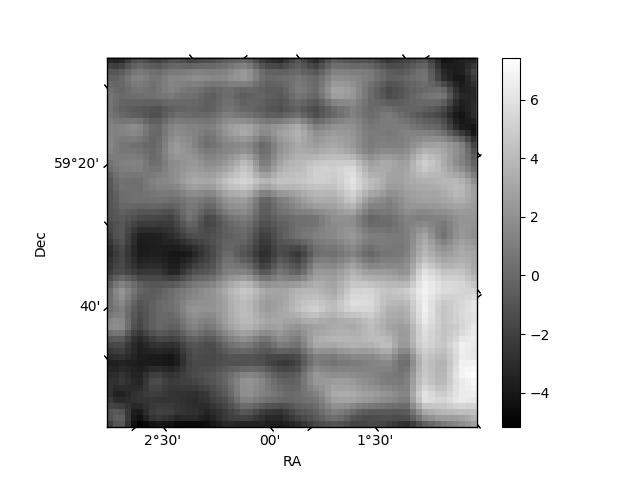
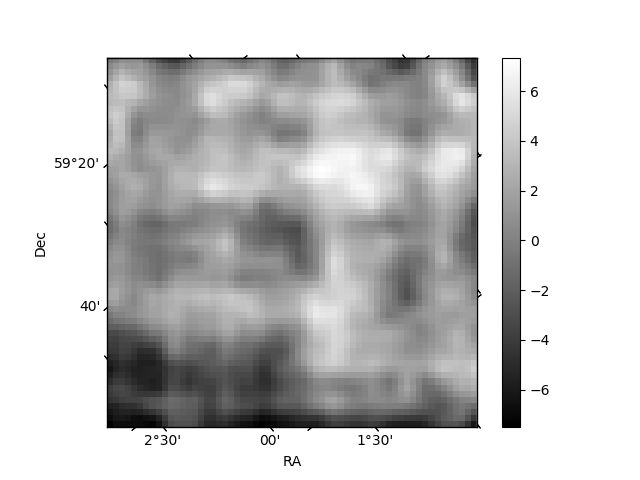
Histogram calculated using DETX and DETY for each event in the final _common_clean file
| Quadrant A | 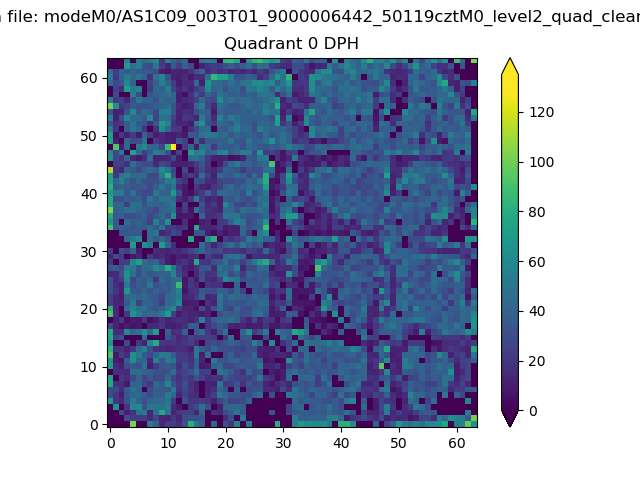 |
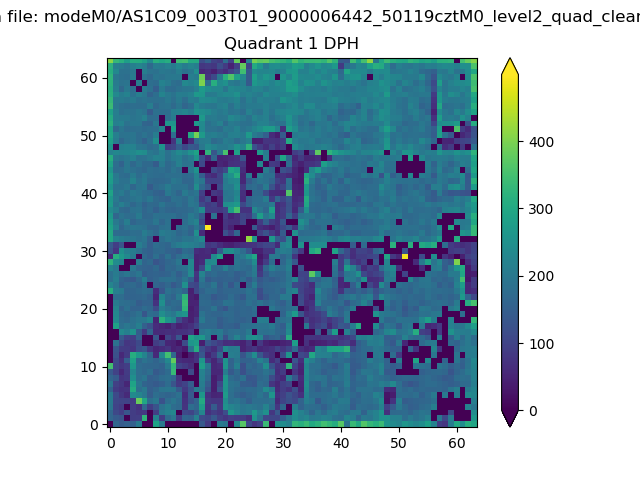 |
Quadrant B |
|---|---|---|---|
| Quadrant D | 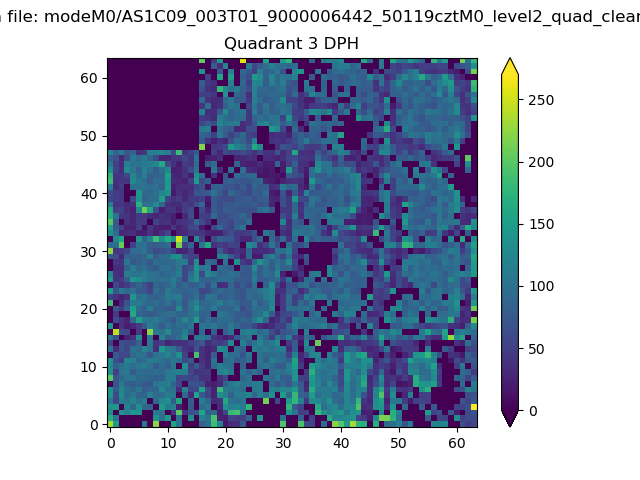 |
 |
Quadrant C |
| Plot type | Count rate plots | Images |
|---|---|---|
| Comparison with Poisson distribution Blue bars denote a histogram of data divided into 1 sec bins. Red curve is a Poisson curve with rate = median count rate of data. |
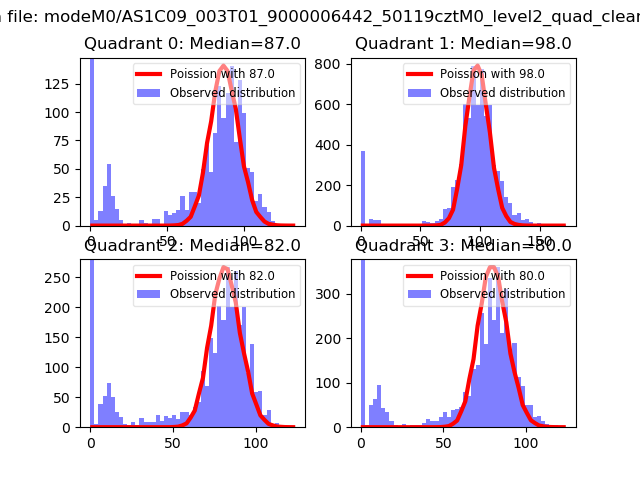 |
 |
| Quadrant-wise count rates Data is divided into 100 sec bins |
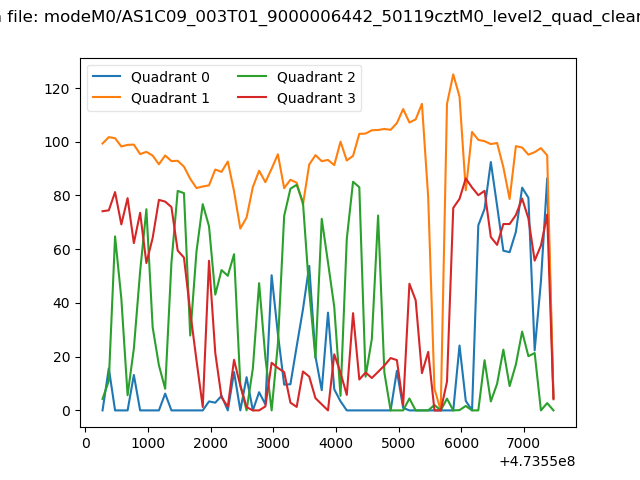 |
|
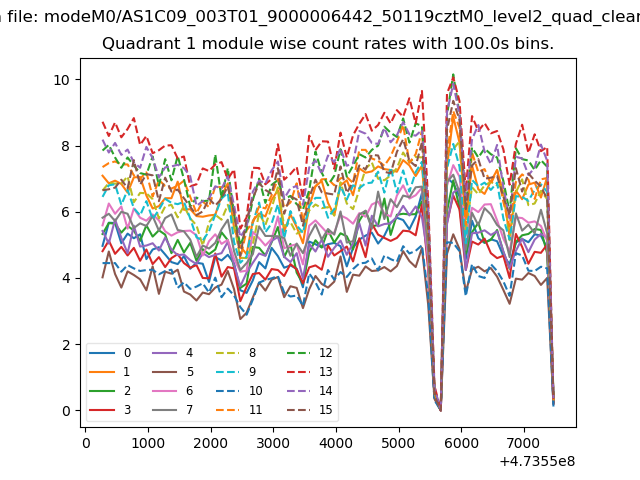
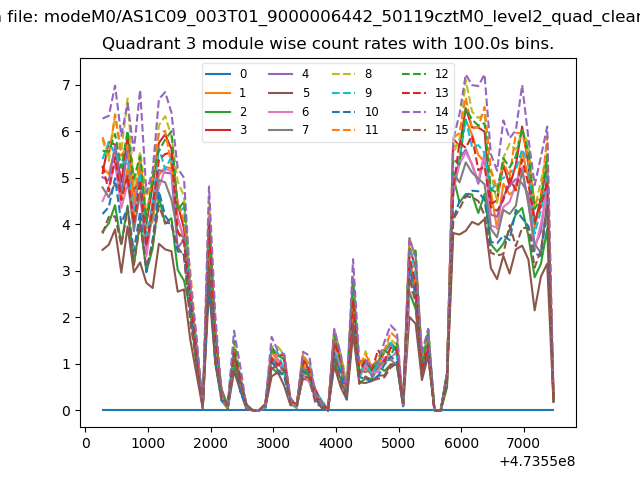
| Module-wise count rates for Quadrant A Data is divided into 100 sec bins |
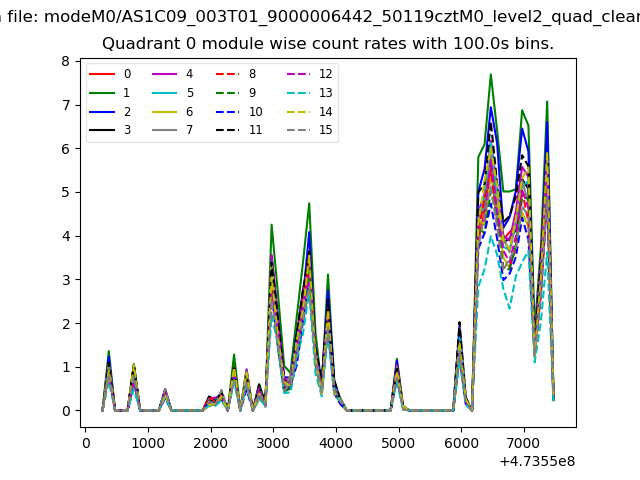 |
 |
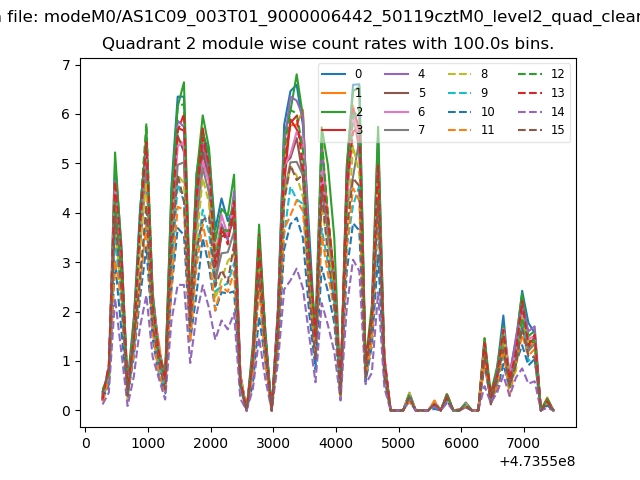
| Module-wise count rates for Quadrant B Data is divided into 100 sec bins |
 |
 |
| Module-wise count rates for Quadrant C Data is divided into 100 sec bins |
 |
 |
| Module-wise count rates for Quadrant D Data is divided into 100 sec bins |
 |
 |
| Parameter | Plot |
|---|---|
| CZT HV Monitor | 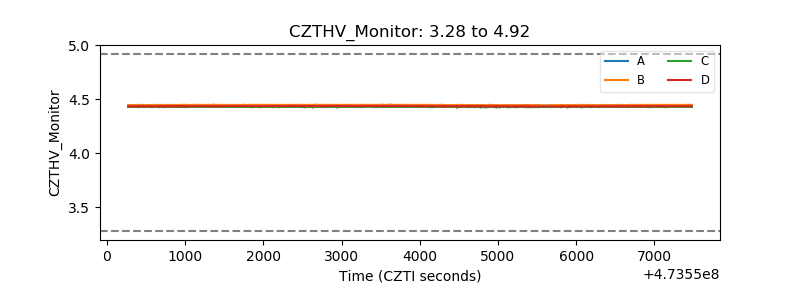 |
| D_VDD |  |
| Temperature 1 | 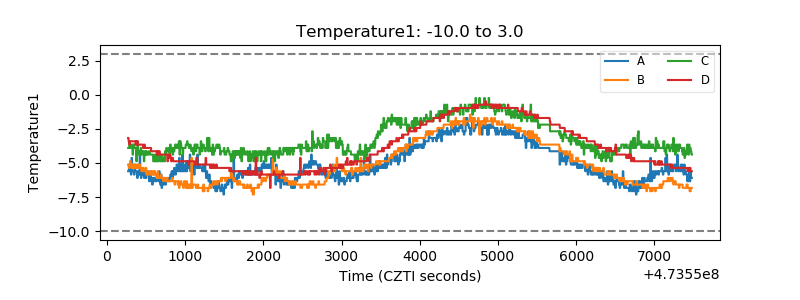 |
| Veto HV Monitor | 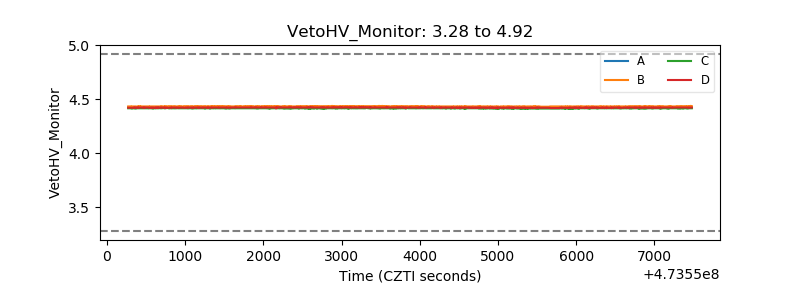 |
| Veto LLD | 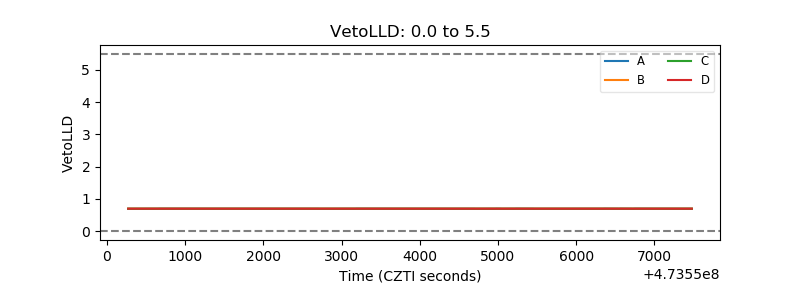 |
| Alpha Counter | 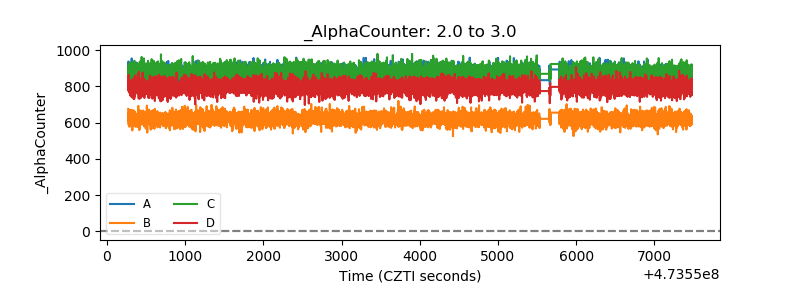 |
| _CPM_Rate | 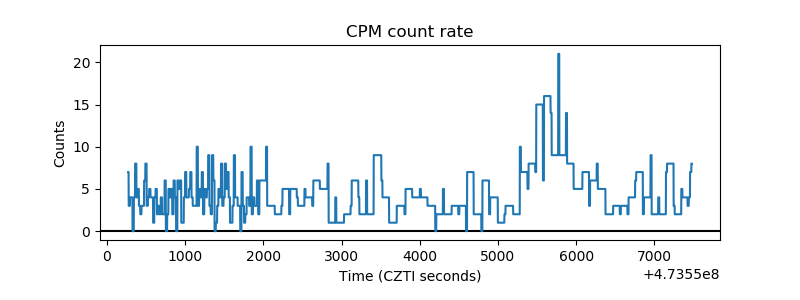 |
| CZT Counter | 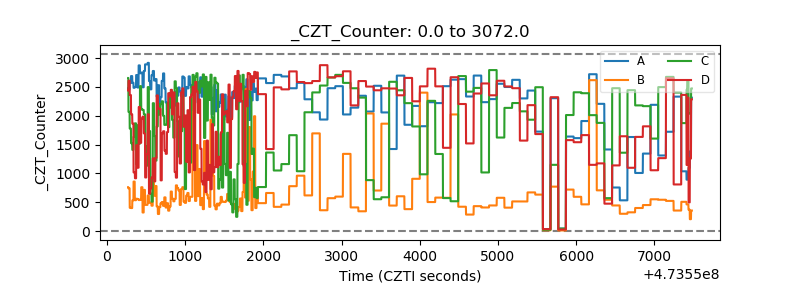 |
| +2.5 Volts monitor | 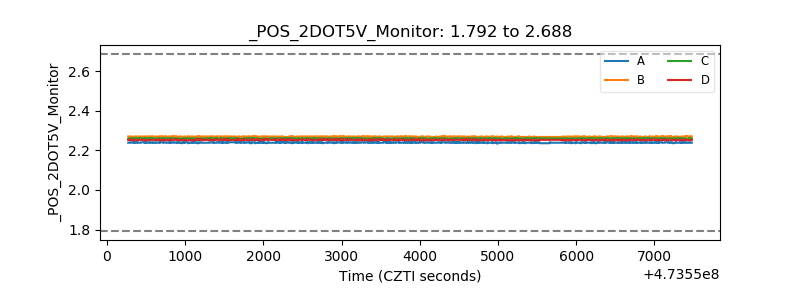 |
| +5 Volts monitor |  |
| _ROLL_ROT | 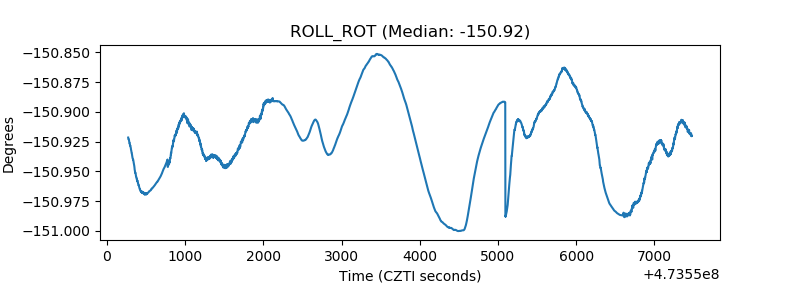 |
| _Roll_DEC | 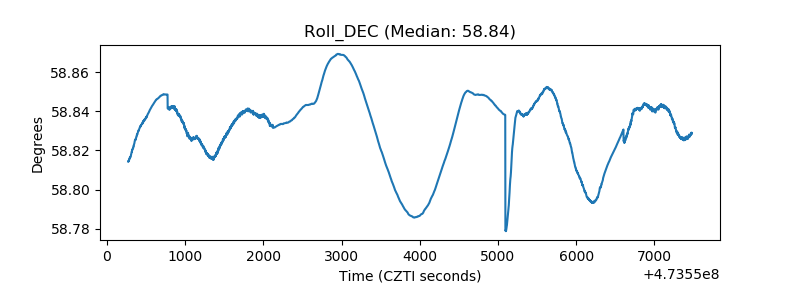 |
| _Roll_RA | 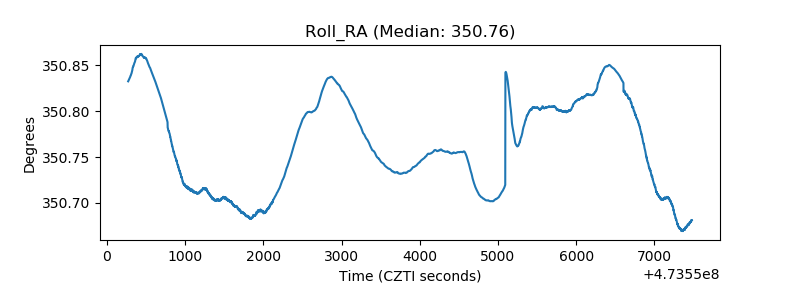 |
| Veto Counter | 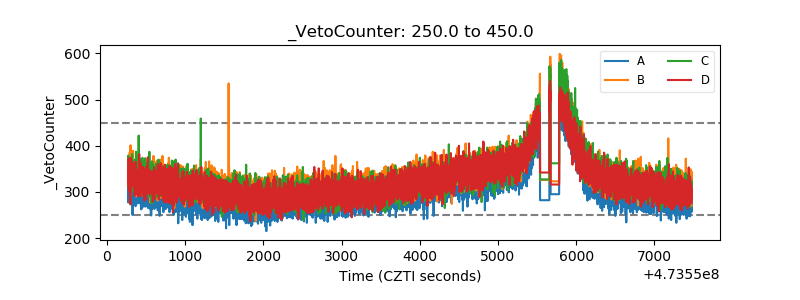 |