| Param | Original file | Final file |
|---|---|---|
| Filename | modeM0/AS1C09_003T01_9000006442_50124cztM0_level2.fits | modeM0/AS1C09_003T01_9000006442_50124cztM0_level2_quad_clean.evt |
| Size (bytes) | 3,974,892,480 | 122,670,720 |
| Size | 3.7 GB | 117.0 MB |
| Events in quadrant A | 47,934,249 | 109,133 |
| Events in quadrant B | 11,261,842 | 1,803,962 |
| Events in quadrant C | 43,547,913 | 143,910 |
| Events in quadrant D | 42,921,623 | 331,418 |
| Mode M9 | |||
|---|---|---|---|
| Quadrant | BADHDUFLAG | Total packets | Discarded packets |
| A | 0 | 10 | 0 |
| B | 0 | 10 | 0 |
| C | 0 | 10 | 0 |
| D | 0 | 10 | 0 |
| Mode M0 | |||
|---|---|---|---|
| Quadrant | BADHDUFLAG | Total packets | Discarded packets |
| A | 0 | 155552 | 7 |
| B | 0 | 47456 | 2 |
| C | 0 | 142436 | 2 |
| D | 0 | 140605 | 2 |
| Mode SS | |||
|---|---|---|---|
| Quadrant | BADHDUFLAG | Total packets | Discarded packets |
| A | 0 | 390 | 0 |
| B | 0 | 390 | 0 |
| C | 0 | 390 | 0 |
| D | 0 | 390 | 0 |
| Quadrant | Total seconds | Saturated seconds | Saturation percentage |
|---|---|---|---|
| A | 19222 | 18167 | 94.511497% |
| B | 19222 | 889 | 4.624909% |
| C | 19222 | 17836 | 92.789512% |
| D | 19222 | 15668 | 81.510769% |
Noise dominated data is calculated using 1-second bins in cleaned event files. If a bin has >2000 counts, and if more than 50% of those come from <1% of pixels, then it is considered to be noise-dominated and hence unusable.
| Quadrant | # 1 sec bins | Bins with >0 counts | Bins with >2000 counts | High rate bins dominated by noise | Noise dominated (total time) | Noise dominated (detector-on time) | Marked lightcurve |
|---|---|---|---|---|---|---|---|
| A | 20187 | 19225 | 16891 | 16891 | 83.67% | 87.86% | 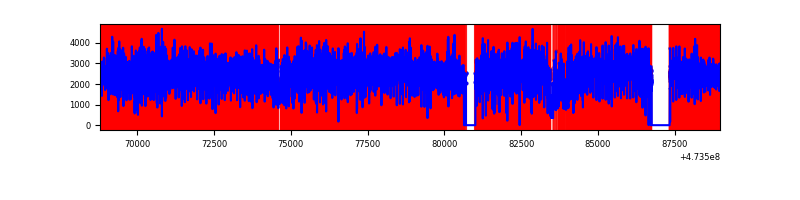 |
| B | 20187 | 19226 | 452 | 452 | 2.24% | 2.35% |  |
| C | 20187 | 19224 | 14181 | 14181 | 70.25% | 73.77% | 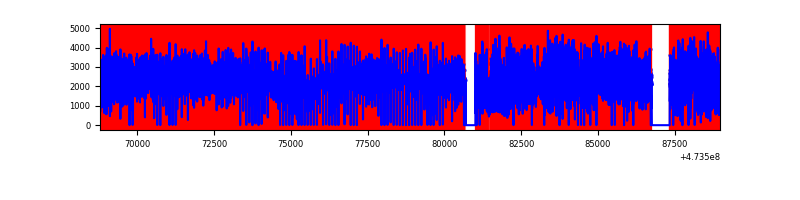 |
| D | 20187 | 19225 | 13812 | 13812 | 68.42% | 71.84% | 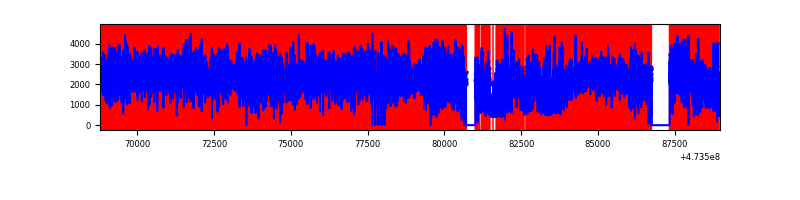 |
Top three noisy pixels from each quadrant. If the there are fewer than three noisy pixels in the level2.evt file, extra rows are filled as -1
| Pixel properties | Quadrant properties | ||||||
|---|---|---|---|---|---|---|---|
| Quadrant | DetID | PixID | Counts | Sigma | Mean | Median | Sigma |
| A | 6 | 250 | 18164445 | 78816.99 | 897 | 876 | 230.5 |
| A | 0 | 98 | 17428499 | 75623.5 | 897 | 876 | 230.5 |
| A | 8 | 8 | 2994972 | 12992.25 | 897 | 876 | 230.5 |
| B | 2 | 176 | 1456829 | 3524.11 | 1944 | 1876 | 412.9 |
| B | 5 | 185 | 794547 | 1919.97 | 1944 | 1876 | 412.9 |
| B | 0 | 213 | 194808 | 467.31 | 1944 | 1876 | 412.9 |
| C | 15 | 197 | 8408894 | 41805.23 | 638 | 630 | 201.1 |
| C | 4 | 111 | 6941903 | 34511.46 | 638 | 630 | 201.1 |
| C | 15 | 214 | 6009646 | 29876.36 | 638 | 630 | 201.1 |
| D | 7 | 61 | 12353978 | 34135.73 | 1102 | 1056 | 361.9 |
| D | 15 | 106 | 4972999 | 13739.33 | 1102 | 1056 | 361.9 |
| D | 15 | 168 | 4202529 | 11610.24 | 1102 | 1056 | 361.9 |
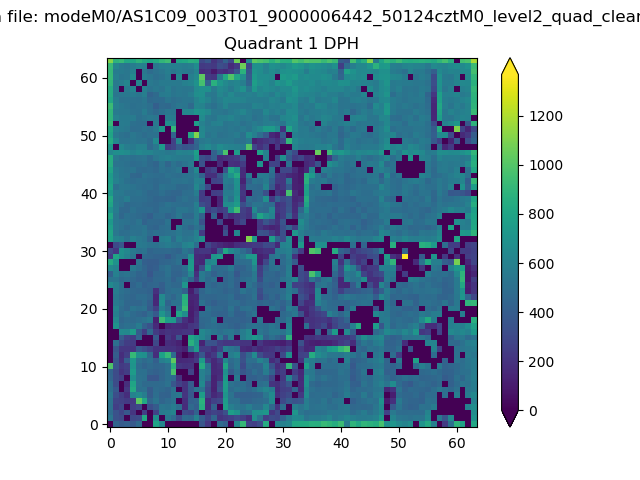
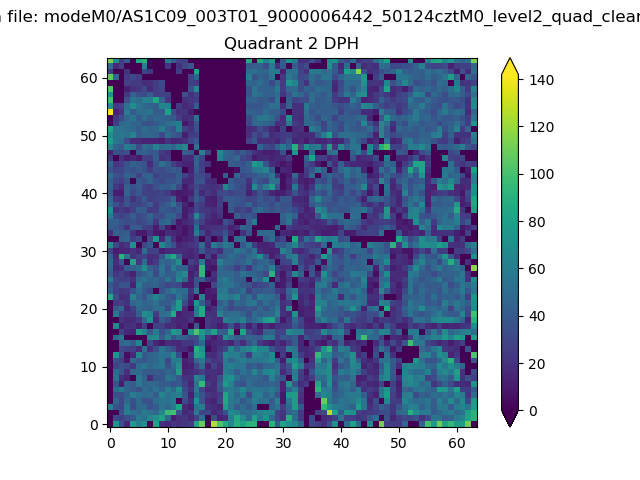
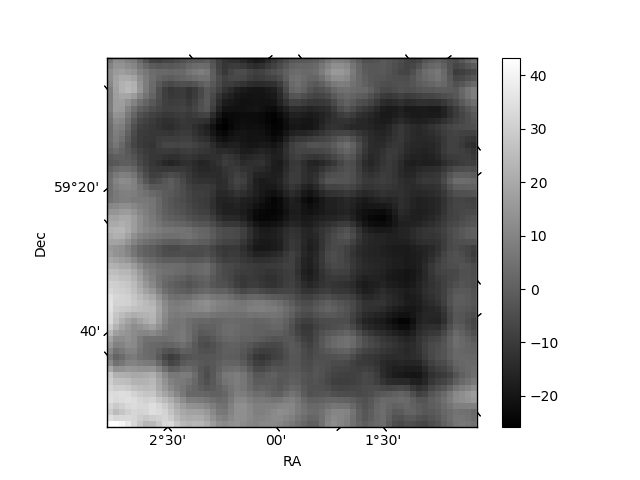
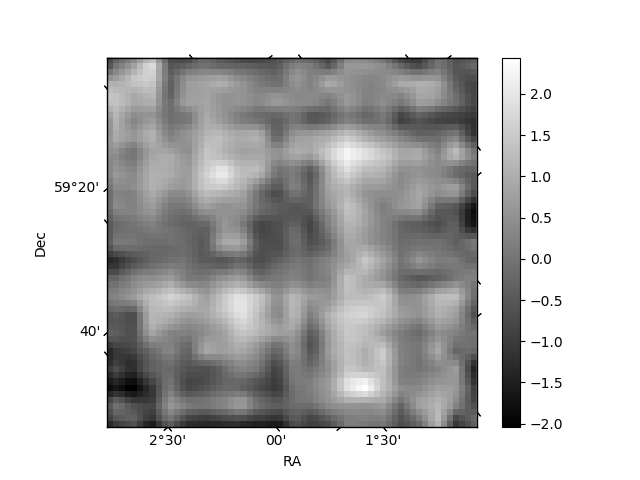
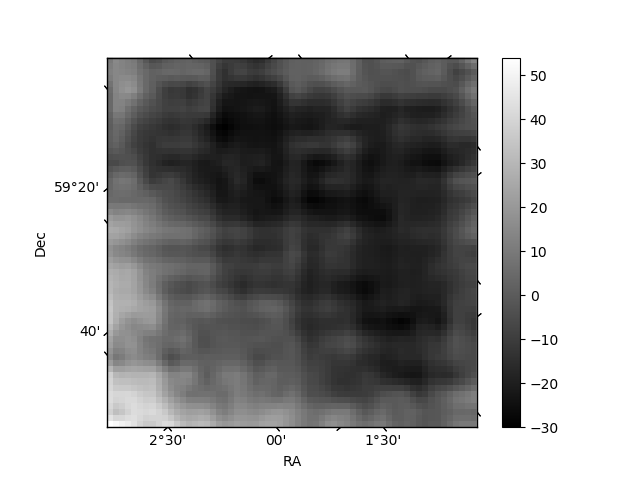
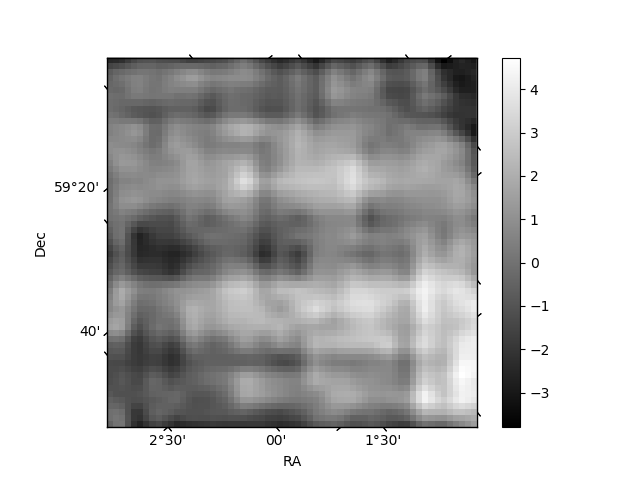
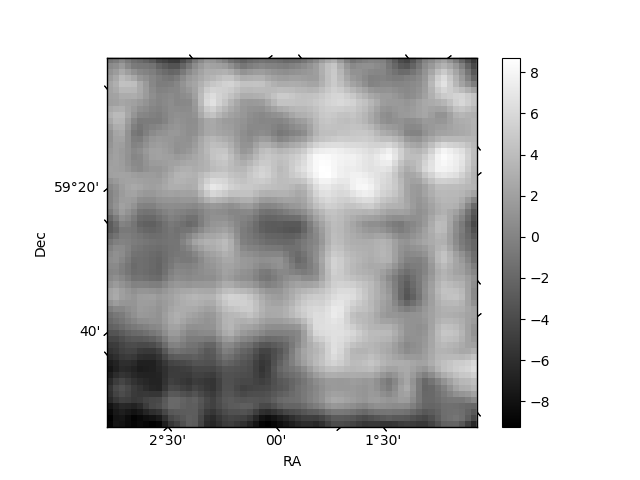
Histogram calculated using DETX and DETY for each event in the final _common_clean file
| Quadrant A | 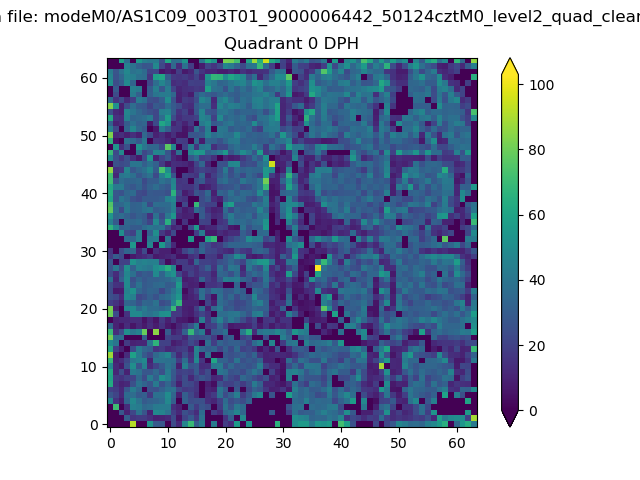 |
 |
Quadrant B |
|---|---|---|---|
| Quadrant D | 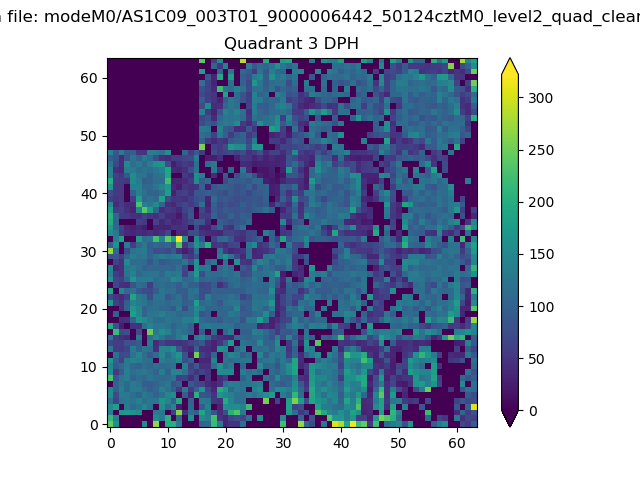 |
 |
Quadrant C |
| Plot type | Count rate plots | Images |
|---|---|---|
| Comparison with Poisson distribution Blue bars denote a histogram of data divided into 1 sec bins. Red curve is a Poisson curve with rate = median count rate of data. |
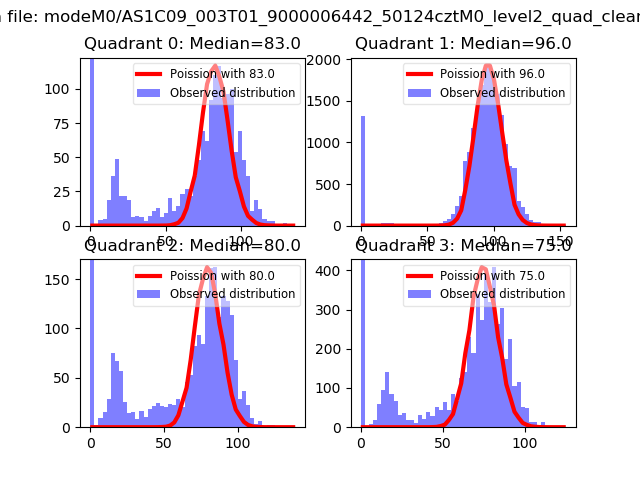 |
 |
| Quadrant-wise count rates Data is divided into 100 sec bins |
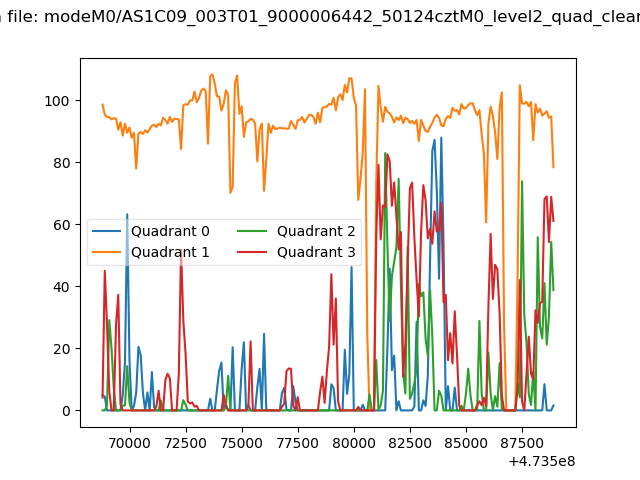 |
|
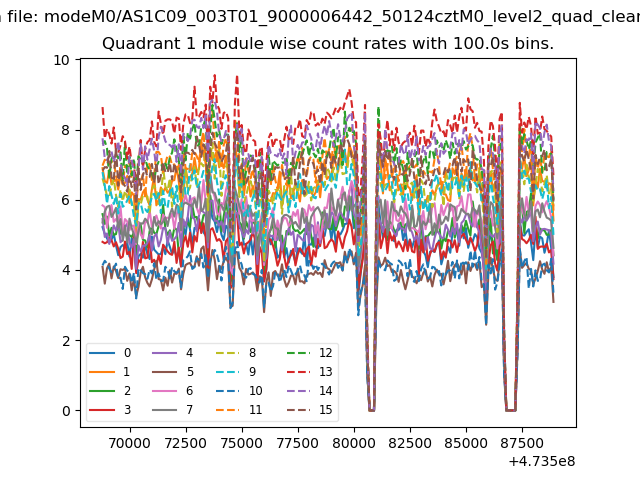
| Module-wise count rates for Quadrant A Data is divided into 100 sec bins |
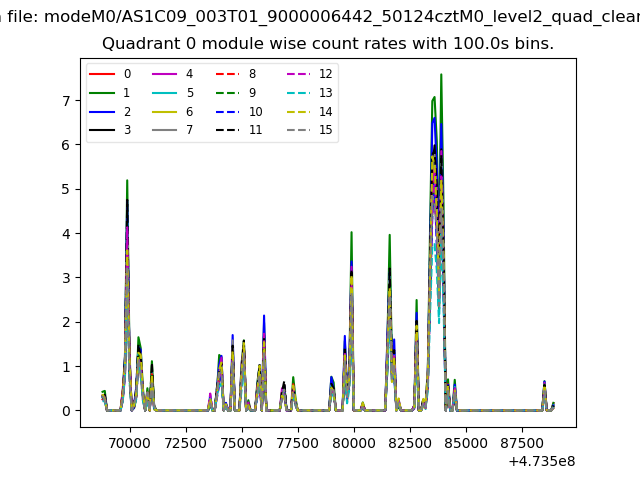 |
 |
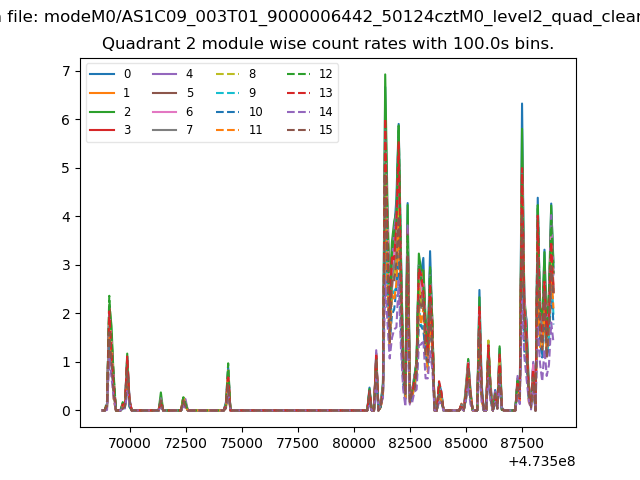
| Module-wise count rates for Quadrant B Data is divided into 100 sec bins |
 |
 |
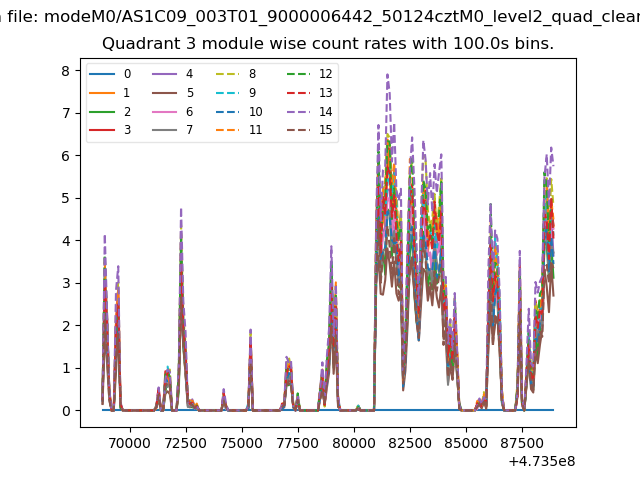
| Module-wise count rates for Quadrant C Data is divided into 100 sec bins |
 |
 |
| Module-wise count rates for Quadrant D Data is divided into 100 sec bins |
 |
 |
| Parameter | Plot |
|---|---|
| CZT HV Monitor | 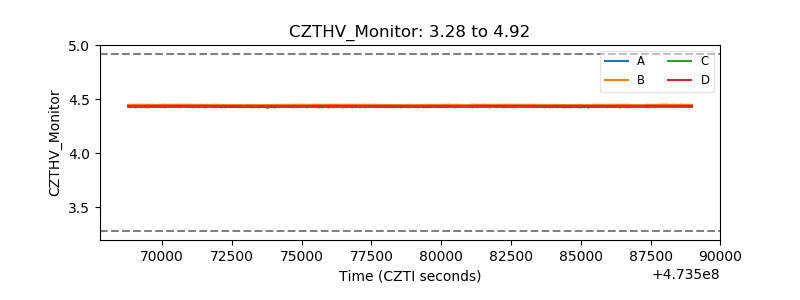 |
| D_VDD | 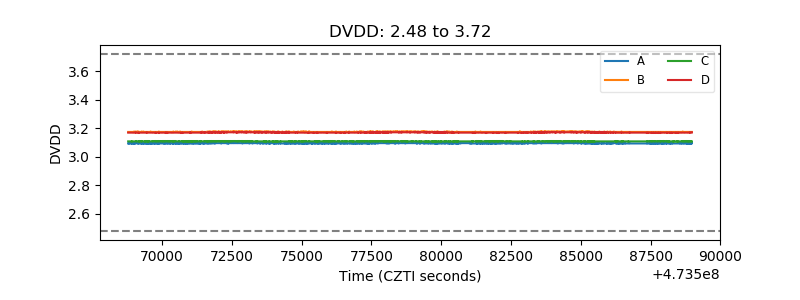 |
| Temperature 1 | 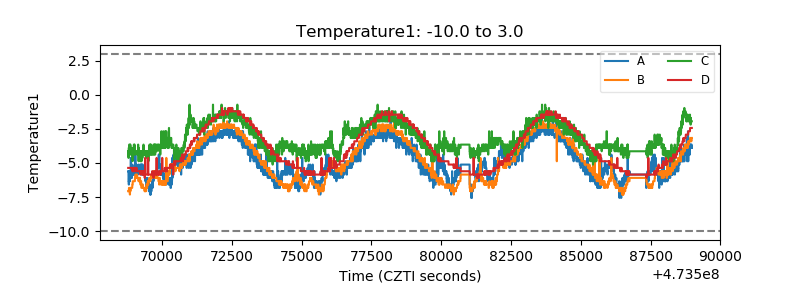 |
| Veto HV Monitor | 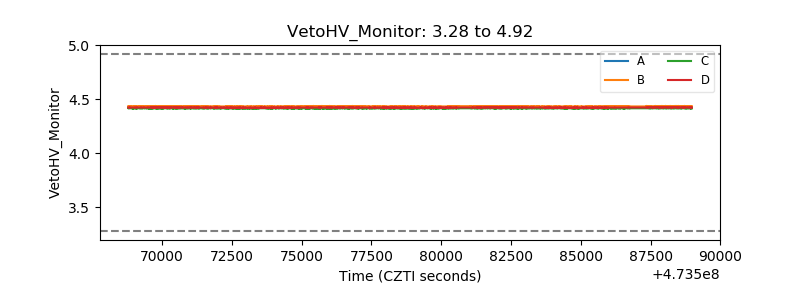 |
| Veto LLD | 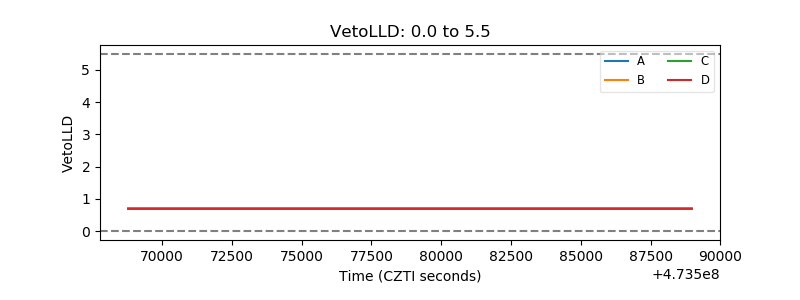 |
| Alpha Counter | 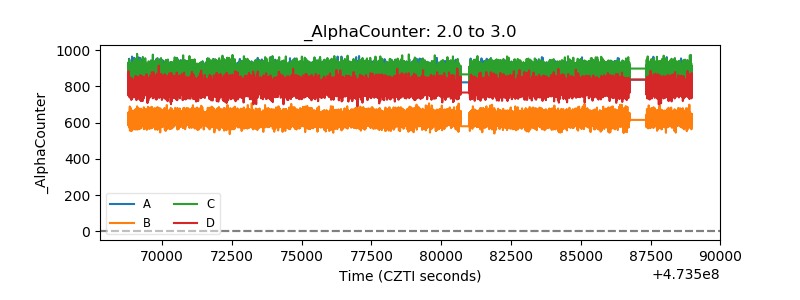 |
| _CPM_Rate | 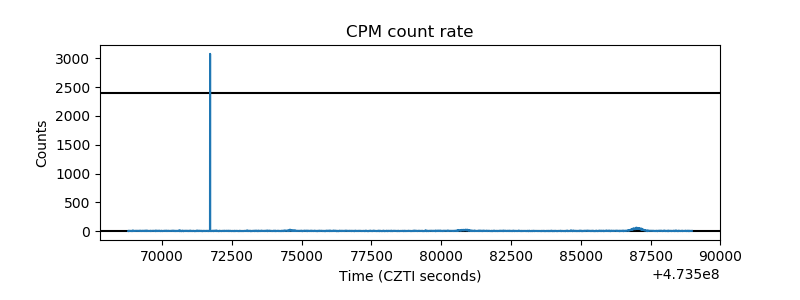 |
| CZT Counter | 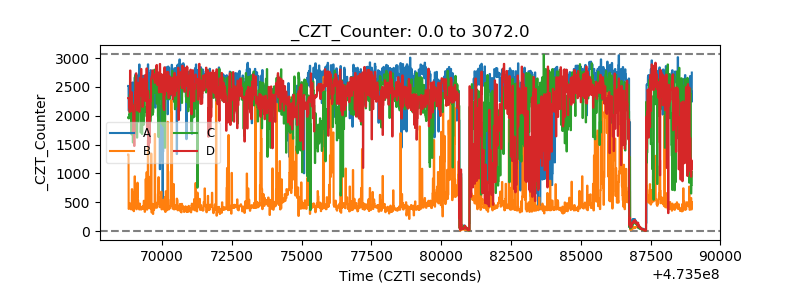 |
| +2.5 Volts monitor | 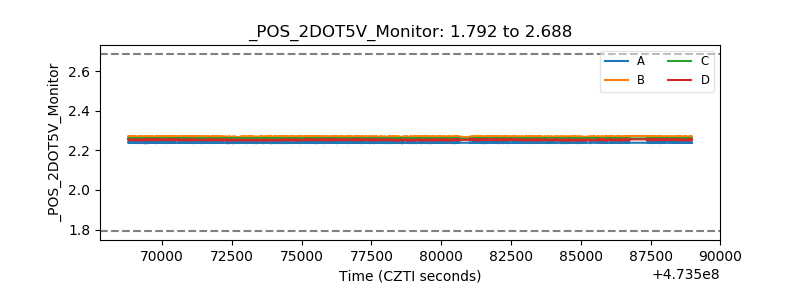 |
| +5 Volts monitor |  |
| _ROLL_ROT | 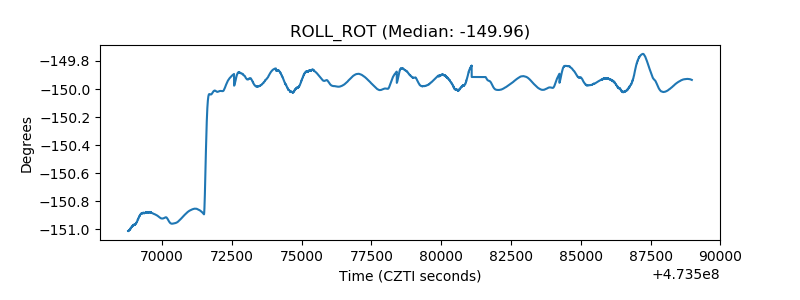 |
| _Roll_DEC | 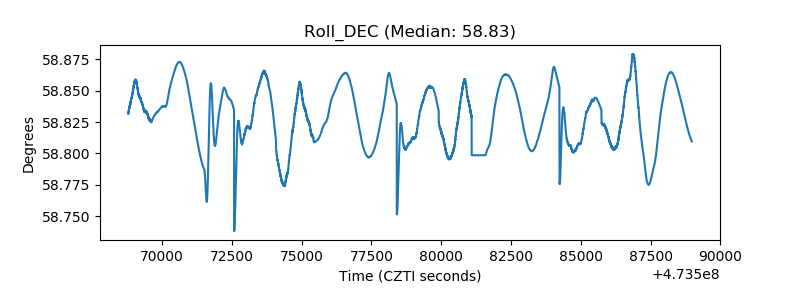 |
| _Roll_RA | 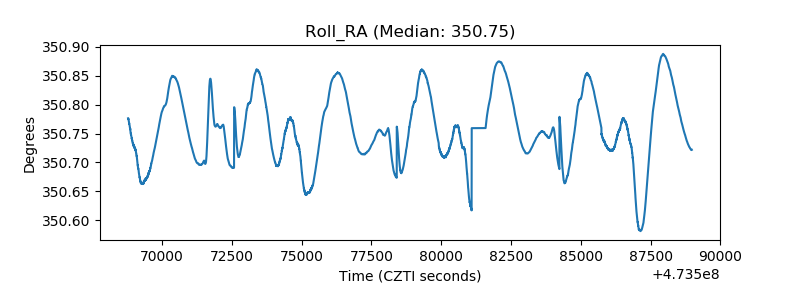 |
| Veto Counter | 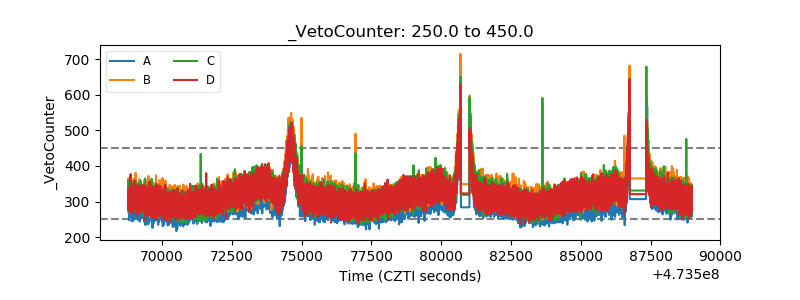 |