| Param | Original file | Final file |
|---|---|---|
| Filename | modeM0/AS1C09_003T01_9000006442_50125cztM0_level2.fits | modeM0/AS1C09_003T01_9000006442_50125cztM0_level2_quad_clean.evt |
| Size (bytes) | 1,171,215,360 | 47,255,040 |
| Size | 1.1 GB | 45.1 MB |
| Events in quadrant A | 15,561,821 | 6,664 |
| Events in quadrant B | 3,261,284 | 587,390 |
| Events in quadrant C | 12,065,292 | 158,357 |
| Events in quadrant D | 12,002,181 | 257,193 |
| Mode M9 | |||
|---|---|---|---|
| Quadrant | BADHDUFLAG | Total packets | Discarded packets |
| A | 0 | 8 | 0 |
| B | 0 | 8 | 0 |
| C | 0 | 8 | 0 |
| D | 0 | 8 | 0 |
| Mode M0 | |||
|---|---|---|---|
| Quadrant | BADHDUFLAG | Total packets | Discarded packets |
| A | 0 | 50294 | 1 |
| B | 0 | 14006 | 1 |
| C | 0 | 39987 | 1 |
| D | 0 | 39788 | 1 |
| Mode SS | |||
|---|---|---|---|
| Quadrant | BADHDUFLAG | Total packets | Discarded packets |
| A | 0 | 122 | 0 |
| B | 0 | 122 | 0 |
| C | 0 | 122 | 0 |
| D | 0 | 122 | 0 |
| Quadrant | Total seconds | Saturated seconds | Saturation percentage |
|---|---|---|---|
| A | 6024 | 5976 | 99.203187% |
| B | 6024 | 135 | 2.241036% |
| C | 6024 | 4397 | 72.991368% |
| D | 6023 | 3243 | 53.843600% |
Noise dominated data is calculated using 1-second bins in cleaned event files. If a bin has >2000 counts, and if more than 50% of those come from <1% of pixels, then it is considered to be noise-dominated and hence unusable.
| Quadrant | # 1 sec bins | Bins with >0 counts | Bins with >2000 counts | High rate bins dominated by noise | Noise dominated (total time) | Noise dominated (detector-on time) | Marked lightcurve |
|---|---|---|---|---|---|---|---|
| A | 6834 | 6025 | 5720 | 5720 | 83.70% | 94.94% | 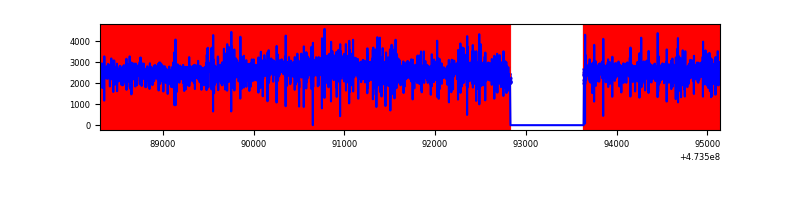 |
| B | 6834 | 6025 | 62 | 62 | 0.91% | 1.03% | 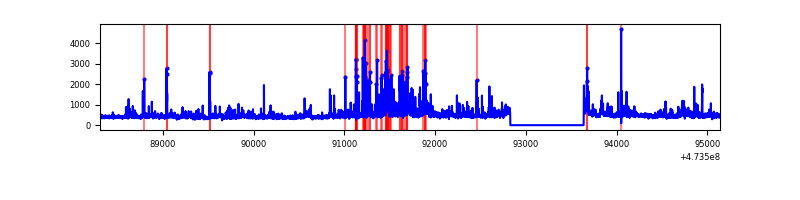 |
| C | 6833 | 6023 | 3208 | 3208 | 46.95% | 53.26% | 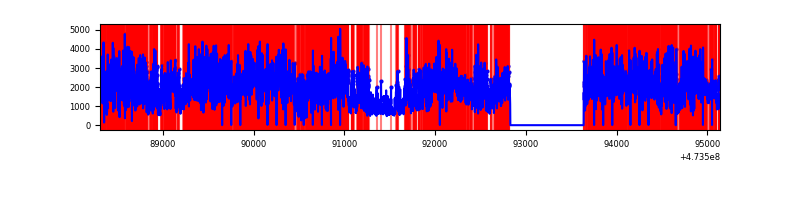 |
| D | 6833 | 6023 | 3153 | 3153 | 46.14% | 52.35% | 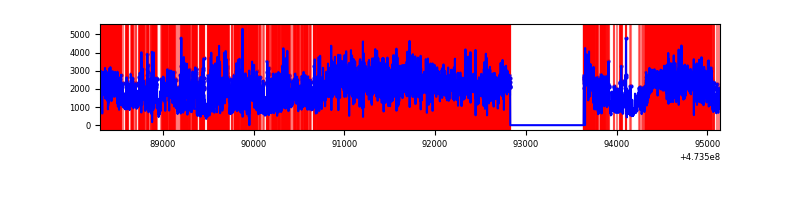 |
Top three noisy pixels from each quadrant. If the there are fewer than three noisy pixels in the level2.evt file, extra rows are filled as -1
| Pixel properties | Quadrant properties | ||||||
|---|---|---|---|---|---|---|---|
| Quadrant | DetID | PixID | Counts | Sigma | Mean | Median | Sigma |
| A | 6 | 250 | 12652021 | 163488.02 | 293 | 284 | 77.4 |
| A | 4 | 13 | 634431 | 8194.56 | 293 | 284 | 77.4 |
| A | 4 | 207 | 351178 | 4534.32 | 293 | 284 | 77.4 |
| B | 2 | 176 | 341856 | 2620.1 | 607 | 588 | 130.2 |
| B | 5 | 185 | 84284 | 642.58 | 607 | 588 | 130.2 |
| B | 0 | 229 | 80633 | 614.55 | 607 | 588 | 130.2 |
| C | 4 | 111 | 4341890 | 48620.39 | 301 | 297 | 89.3 |
| C | 15 | 214 | 2014415 | 22555.59 | 301 | 297 | 89.3 |
| C | 15 | 230 | 1245868 | 13948.83 | 301 | 297 | 89.3 |
| D | 15 | 168 | 2260089 | 16034.21 | 468 | 449 | 140.9 |
| D | 15 | 107 | 2131105 | 15118.95 | 468 | 449 | 140.9 |
| D | 7 | 61 | 1048196 | 7434.72 | 468 | 449 | 140.9 |
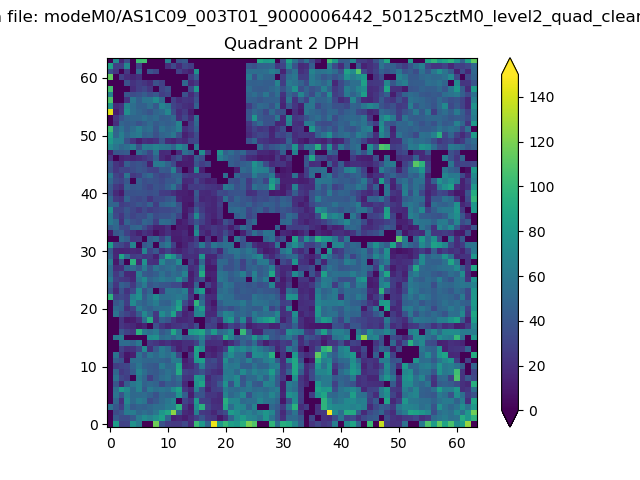
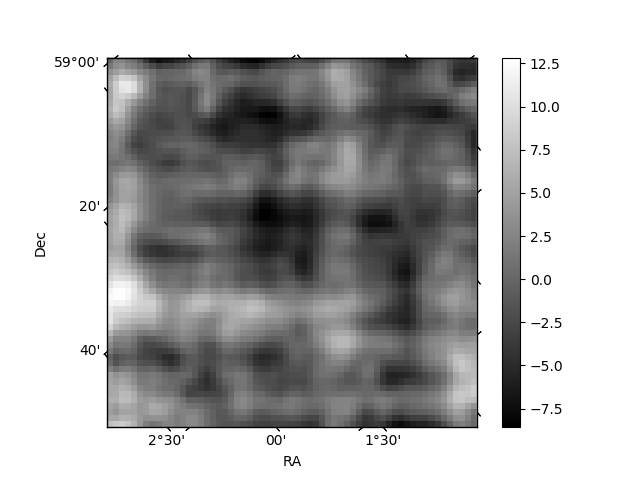
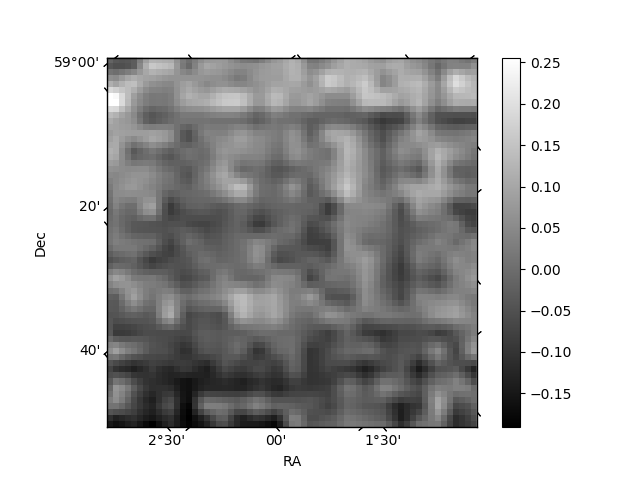
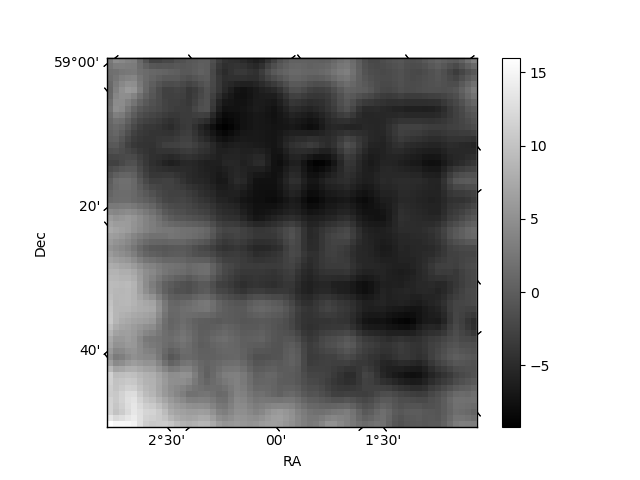
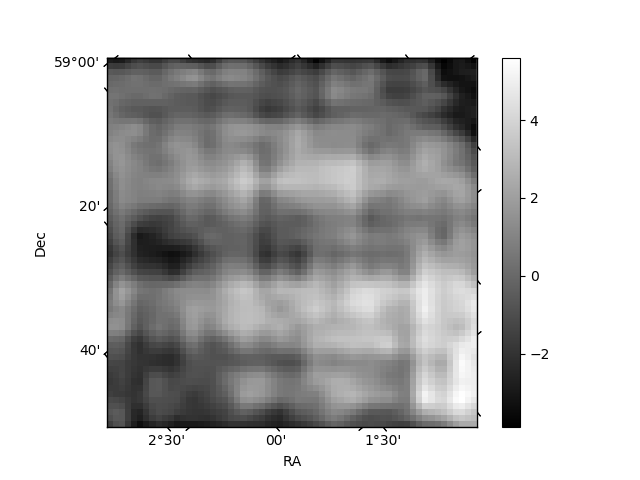
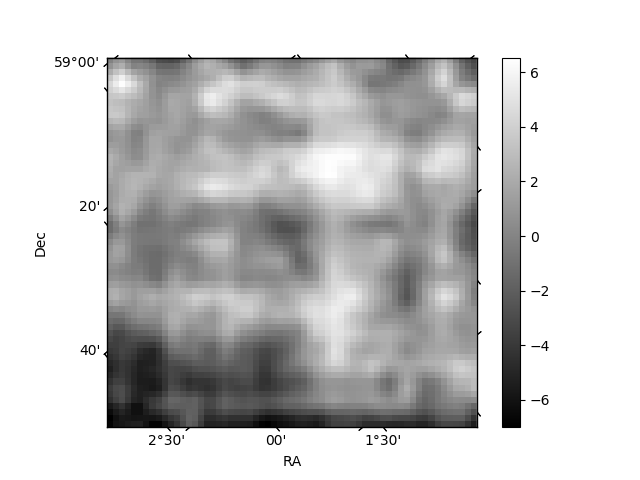
Histogram calculated using DETX and DETY for each event in the final _common_clean file
| Quadrant A | 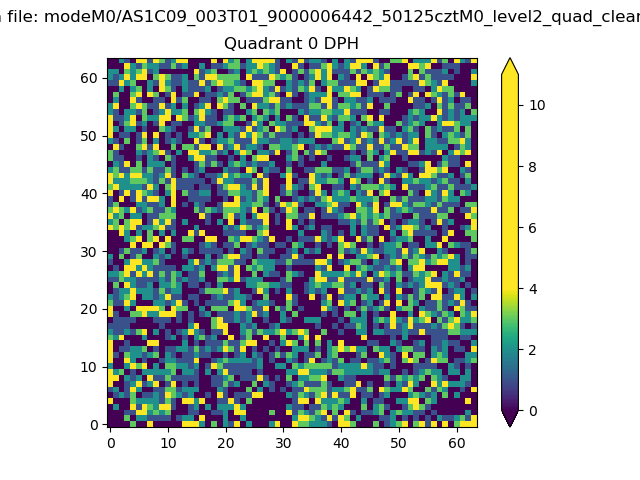 |
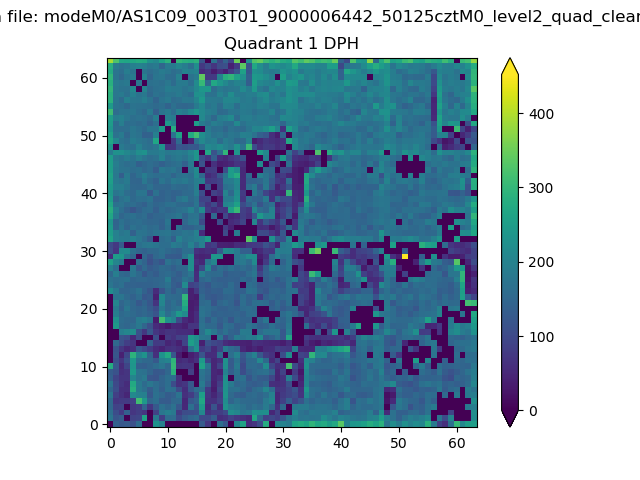 |
Quadrant B |
|---|---|---|---|
| Quadrant D | 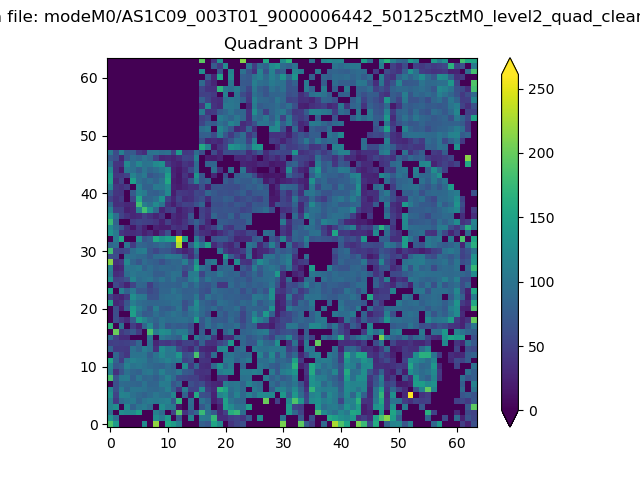 |
 |
Quadrant C |
| Plot type | Count rate plots | Images |
|---|---|---|
| Comparison with Poisson distribution Blue bars denote a histogram of data divided into 1 sec bins. Red curve is a Poisson curve with rate = median count rate of data. |
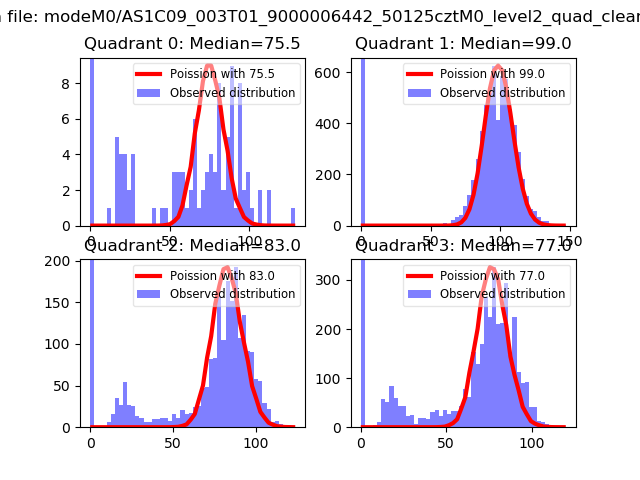 |
 |
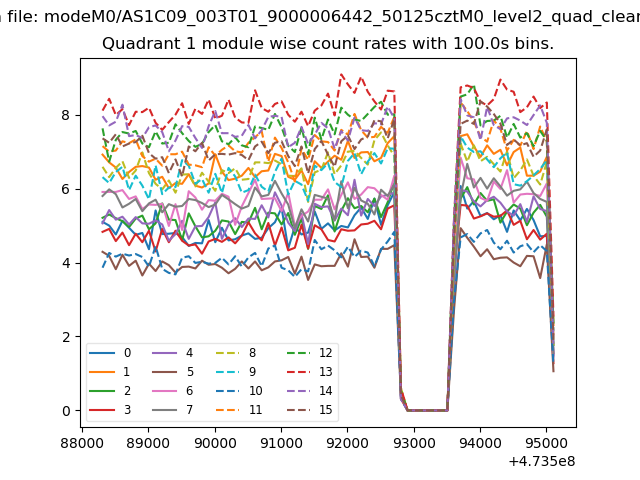
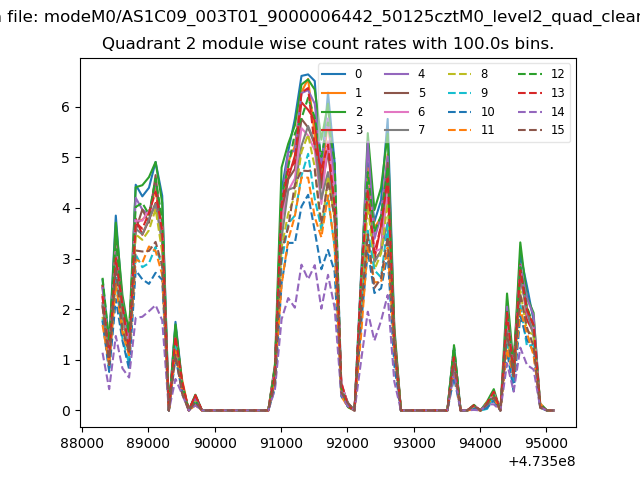
| Quadrant-wise count rates Data is divided into 100 sec bins |
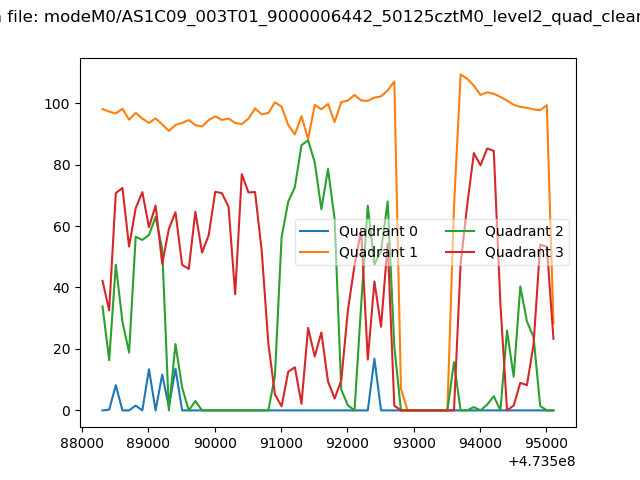 |
|
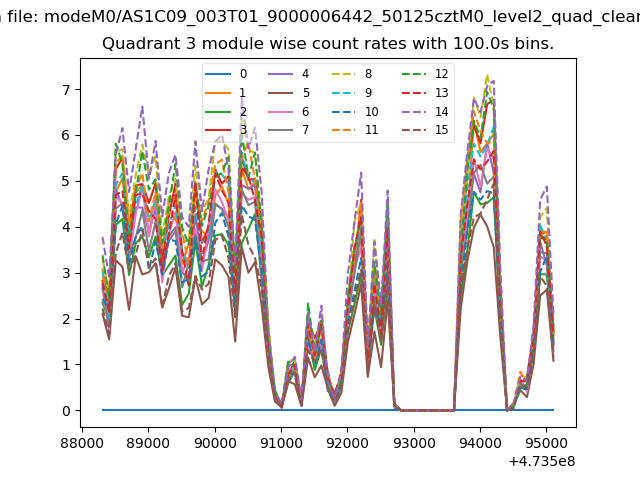
| Module-wise count rates for Quadrant A Data is divided into 100 sec bins |
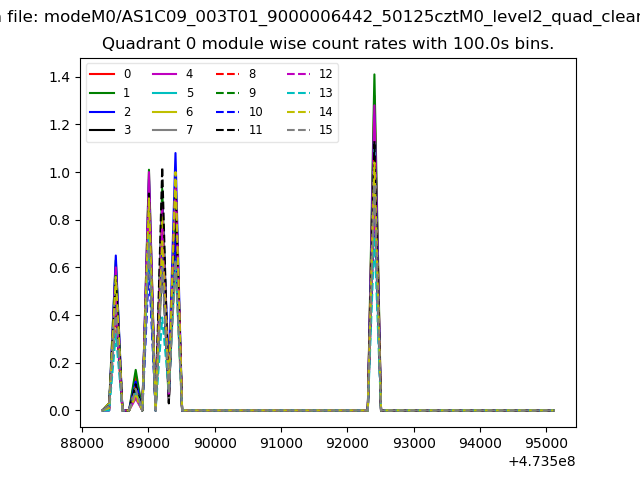 |
 |
| Module-wise count rates for Quadrant B Data is divided into 100 sec bins |
 |
 |
| Module-wise count rates for Quadrant C Data is divided into 100 sec bins |
 |
 |
| Module-wise count rates for Quadrant D Data is divided into 100 sec bins |
 |
 |
| Parameter | Plot |
|---|---|
| CZT HV Monitor | 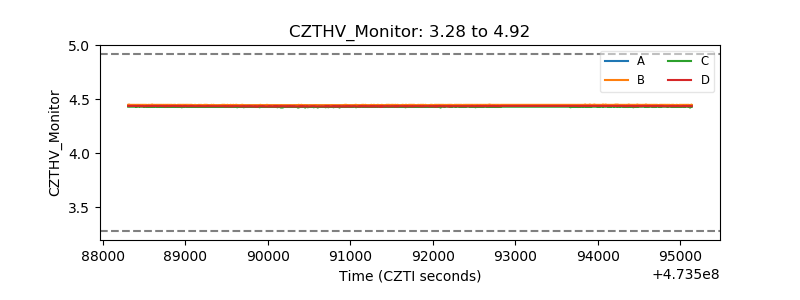 |
| D_VDD |  |
| Temperature 1 | 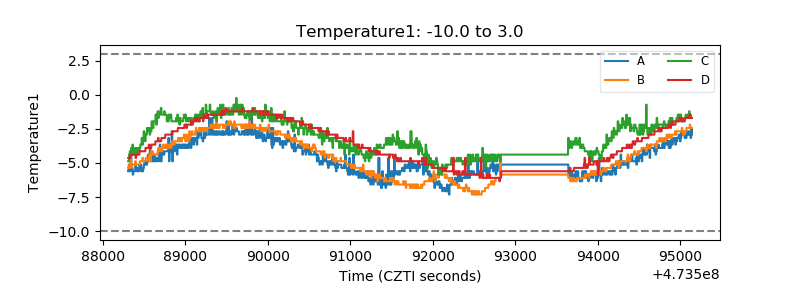 |
| Veto HV Monitor | 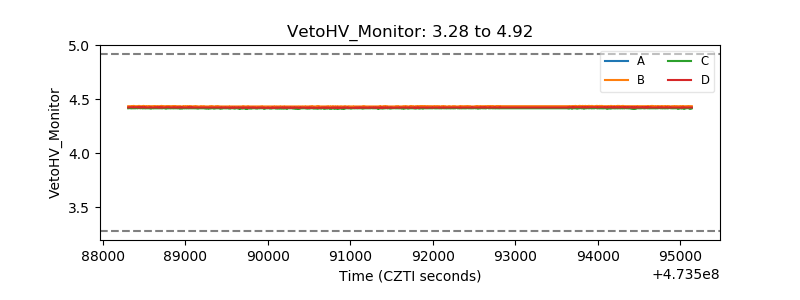 |
| Veto LLD | 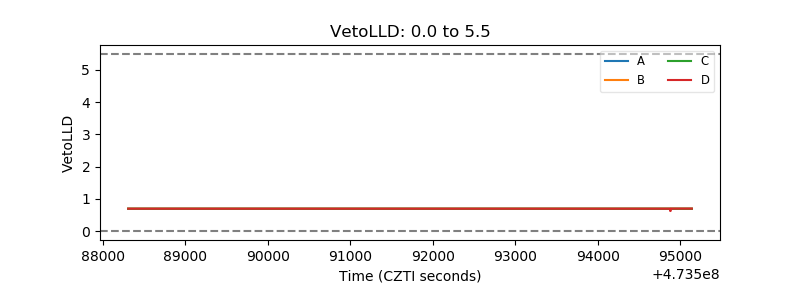 |
| Alpha Counter | 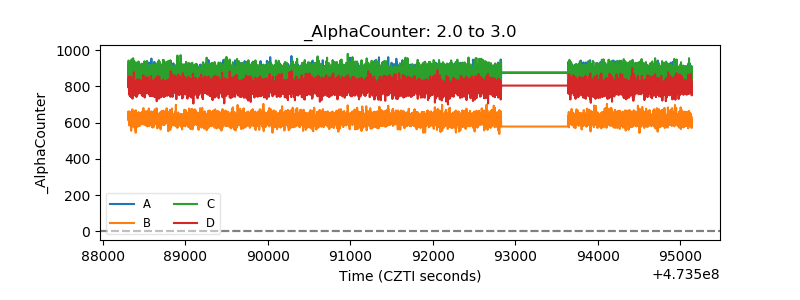 |
| _CPM_Rate | 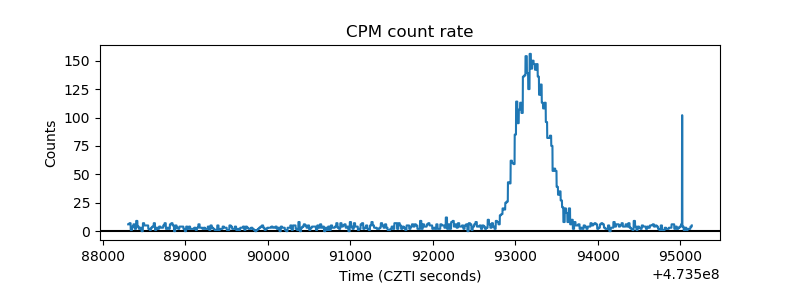 |
| CZT Counter | 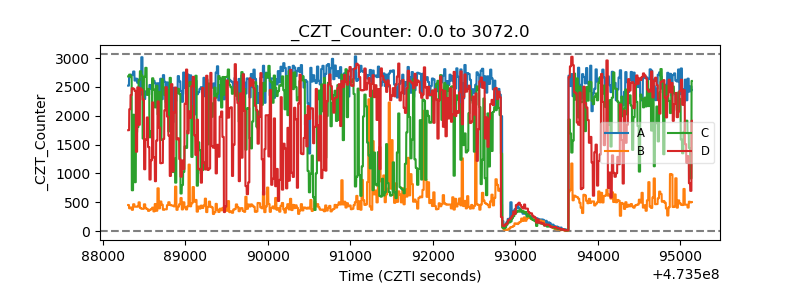 |
| +2.5 Volts monitor | 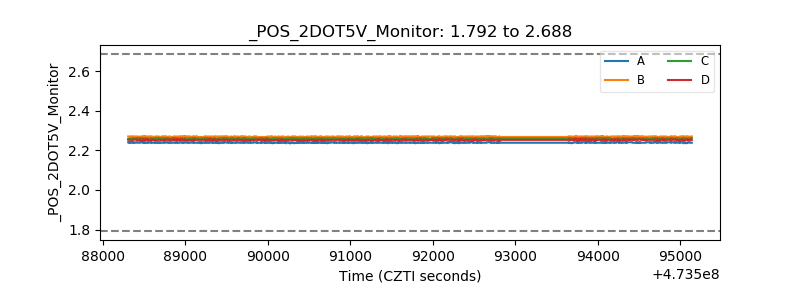 |
| +5 Volts monitor |  |
| _ROLL_ROT | 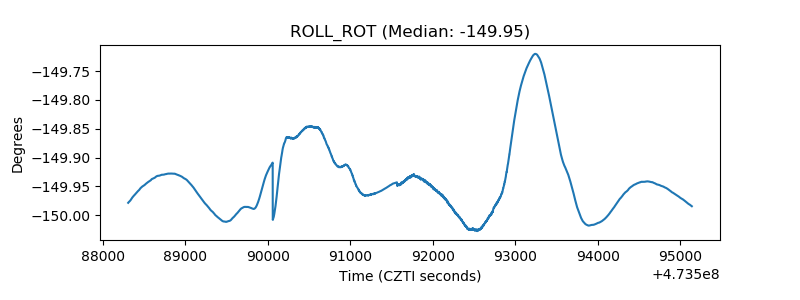 |
| _Roll_DEC | 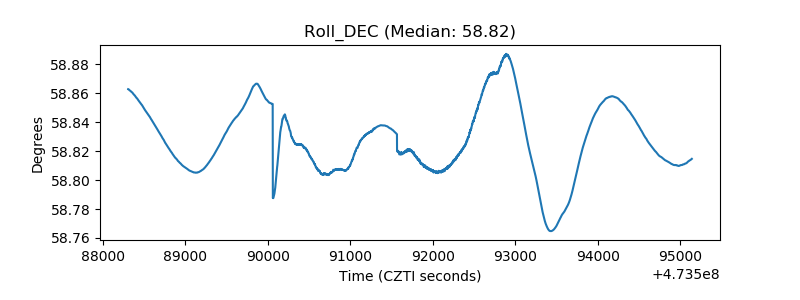 |
| _Roll_RA | 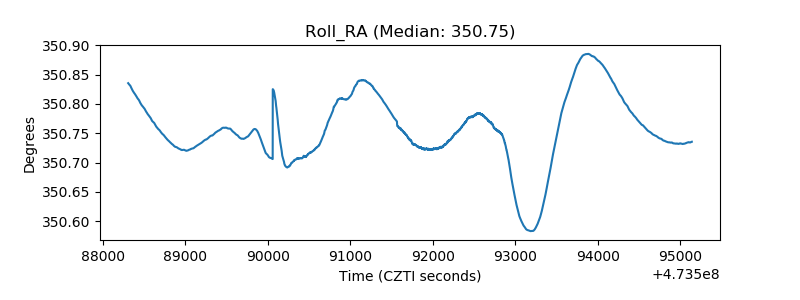 |
| Veto Counter | 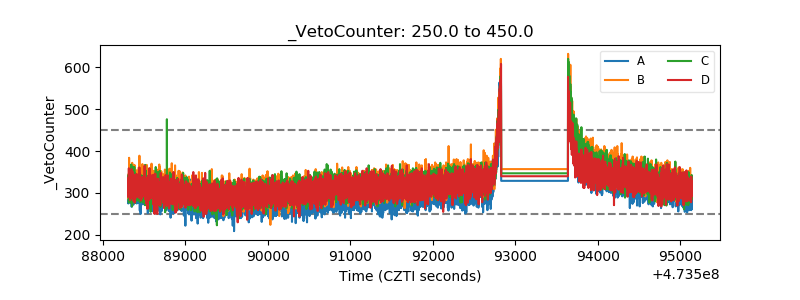 |