| Param | Original file | Final file |
|---|---|---|
| Filename | modeM0/AS1C09_003T01_9000006442_50126cztM0_level2.fits | modeM0/AS1C09_003T01_9000006442_50126cztM0_level2_quad_clean.evt |
| Size (bytes) | 1,192,996,800 | 44,527,680 |
| Size | 1.1 GB | 42.5 MB |
| Events in quadrant A | 15,384,061 | 7,405 |
| Events in quadrant B | 3,471,700 | 588,652 |
| Events in quadrant C | 12,628,095 | 117,507 |
| Events in quadrant D | 12,217,360 | 217,175 |
| Mode M9 | |||
|---|---|---|---|
| Quadrant | BADHDUFLAG | Total packets | Discarded packets |
| A | 0 | 9 | 0 |
| B | 0 | 9 | 0 |
| C | 0 | 9 | 0 |
| D | 0 | 9 | 0 |
| Mode M0 | |||
|---|---|---|---|
| Quadrant | BADHDUFLAG | Total packets | Discarded packets |
| A | 0 | 49816 | 7 |
| B | 0 | 14559 | 1 |
| C | 0 | 41591 | 1 |
| D | 0 | 40347 | 1 |
| Mode SS | |||
|---|---|---|---|
| Quadrant | BADHDUFLAG | Total packets | Discarded packets |
| A | 0 | 122 | 0 |
| B | 0 | 122 | 0 |
| C | 0 | 122 | 0 |
| D | 0 | 122 | 0 |
| Quadrant | Total seconds | Saturated seconds | Saturation percentage |
|---|---|---|---|
| A | 5968 | 5911 | 99.044906% |
| B | 5968 | 189 | 3.166890% |
| C | 5968 | 4854 | 81.333780% |
| D | 5969 | 3675 | 61.568102% |
Noise dominated data is calculated using 1-second bins in cleaned event files. If a bin has >2000 counts, and if more than 50% of those come from <1% of pixels, then it is considered to be noise-dominated and hence unusable.
| Quadrant | # 1 sec bins | Bins with >0 counts | Bins with >2000 counts | High rate bins dominated by noise | Noise dominated (total time) | Noise dominated (detector-on time) | Marked lightcurve |
|---|---|---|---|---|---|---|---|
| A | 6878 | 5968 | 5480 | 5480 | 79.67% | 91.82% | 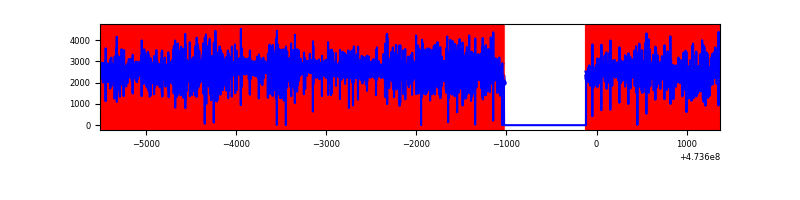 |
| B | 6878 | 5969 | 67 | 67 | 0.97% | 1.12% | 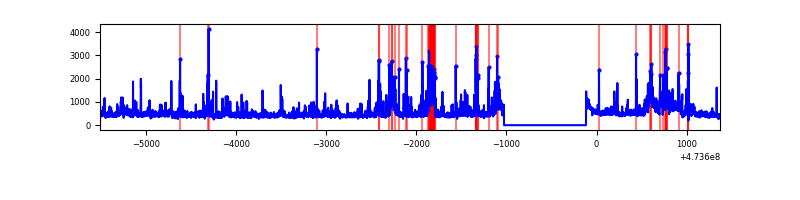 |
| C | 6878 | 5967 | 3564 | 3564 | 51.82% | 59.73% | 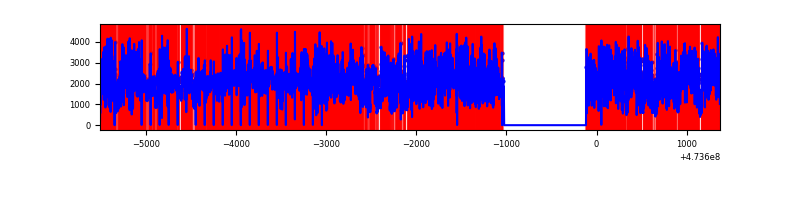 |
| D | 6879 | 5969 | 3404 | 3404 | 49.48% | 57.03% | 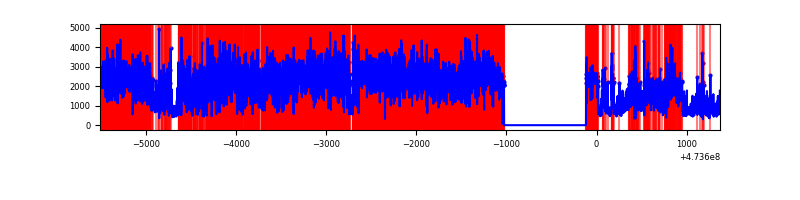 |
Top three noisy pixels from each quadrant. If the there are fewer than three noisy pixels in the level2.evt file, extra rows are filled as -1
| Pixel properties | Quadrant properties | ||||||
|---|---|---|---|---|---|---|---|
| Quadrant | DetID | PixID | Counts | Sigma | Mean | Median | Sigma |
| A | 6 | 250 | 11619025 | 162279.44 | 263 | 255 | 71.6 |
| A | 4 | 13 | 1659924 | 23180.61 | 263 | 255 | 71.6 |
| A | 0 | 98 | 421670 | 5885.91 | 263 | 255 | 71.6 |
| B | 5 | 185 | 330126 | 2542.17 | 607 | 586 | 129.6 |
| B | 4 | 170 | 179111 | 1377.19 | 607 | 586 | 129.6 |
| B | 0 | 229 | 74549 | 570.57 | 607 | 586 | 129.6 |
| C | 4 | 111 | 7039669 | 91289.36 | 275 | 273 | 77.1 |
| C | 15 | 230 | 1202598 | 15592.17 | 275 | 273 | 77.1 |
| C | 15 | 197 | 1159156 | 15028.8 | 275 | 273 | 77.1 |
| D | 15 | 168 | 3163366 | 23425.01 | 439 | 420 | 135.0 |
| D | 15 | 107 | 1039599 | 7696.24 | 439 | 420 | 135.0 |
| D | 15 | 106 | 811237 | 6004.97 | 439 | 420 | 135.0 |
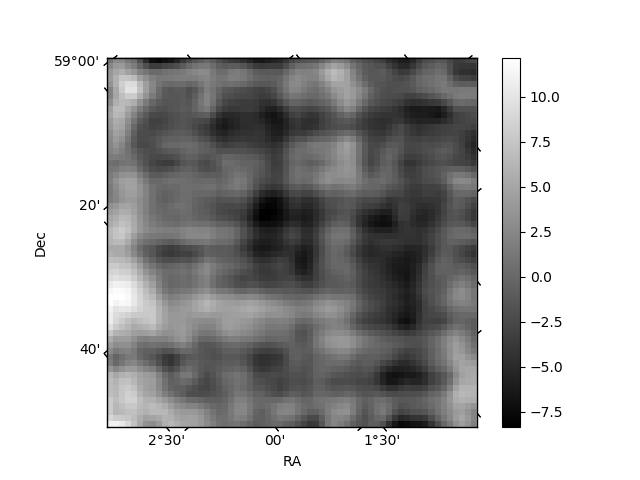
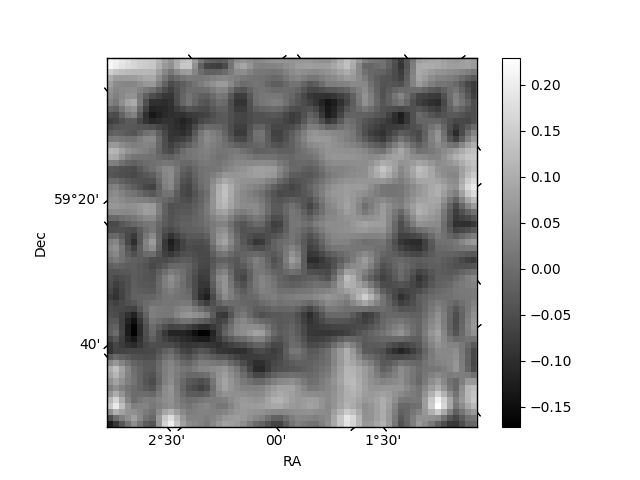
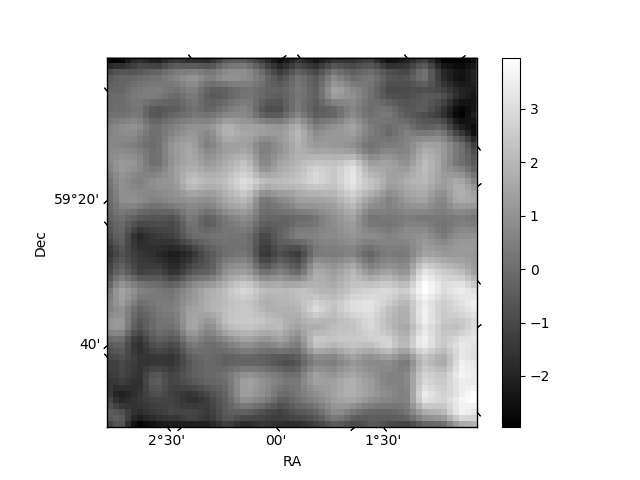
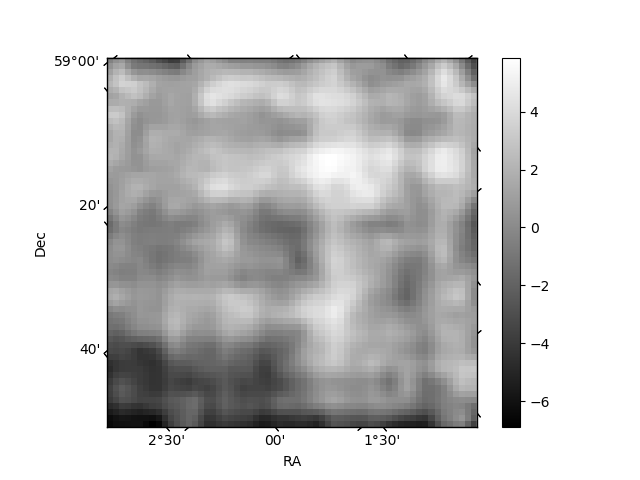
Histogram calculated using DETX and DETY for each event in the final _common_clean file
| Quadrant A | 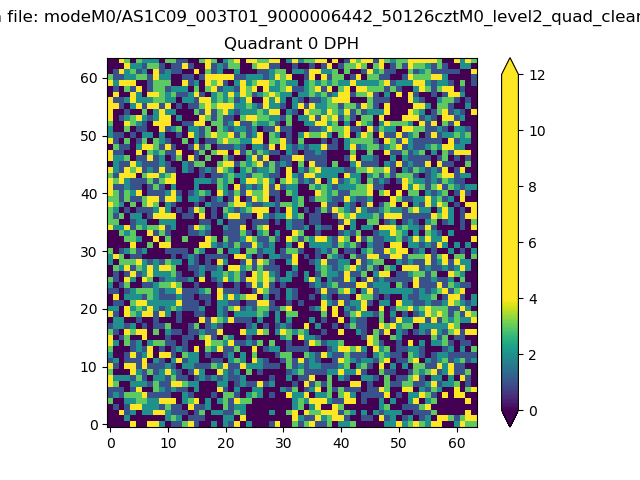 |
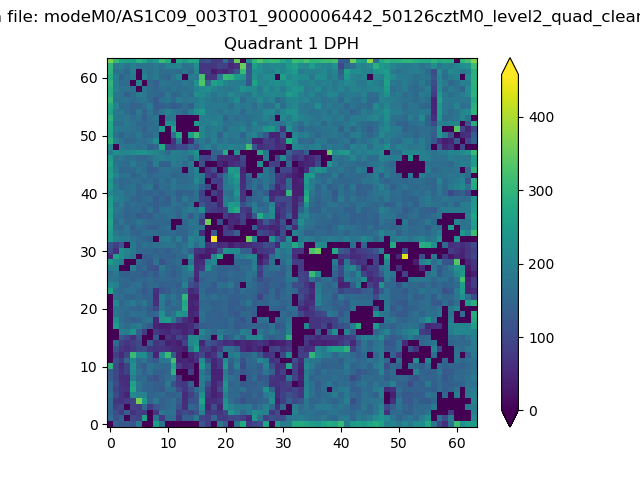 |
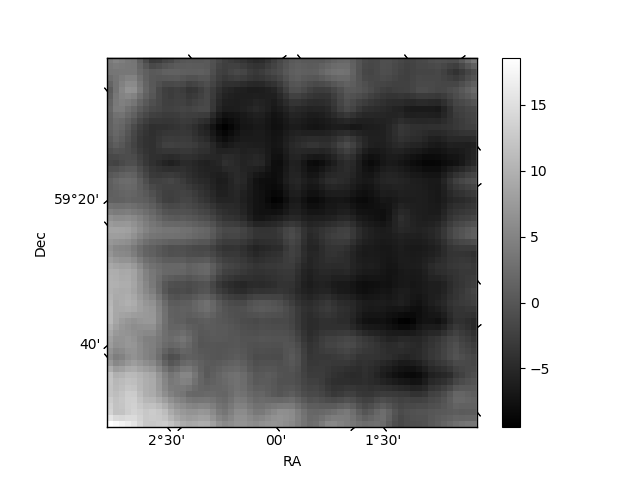
Quadrant B |
|---|---|---|---|
| Quadrant D | 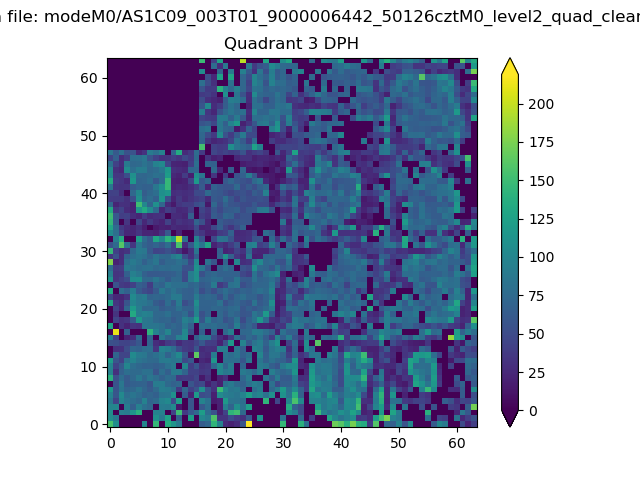 |
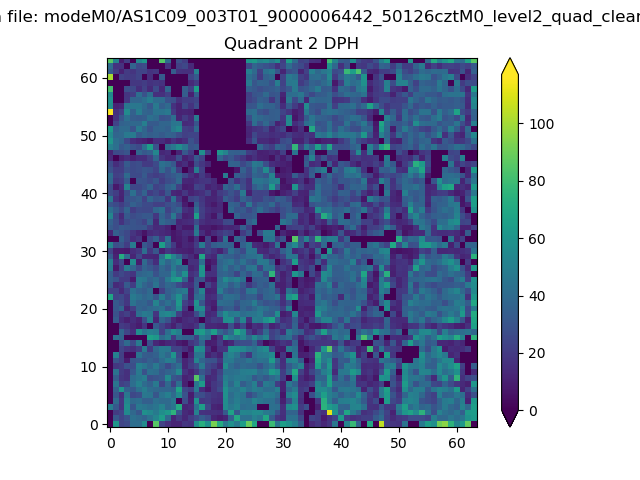 |
Quadrant C |
| Plot type | Count rate plots | Images |
|---|---|---|
| Comparison with Poisson distribution Blue bars denote a histogram of data divided into 1 sec bins. Red curve is a Poisson curve with rate = median count rate of data. |
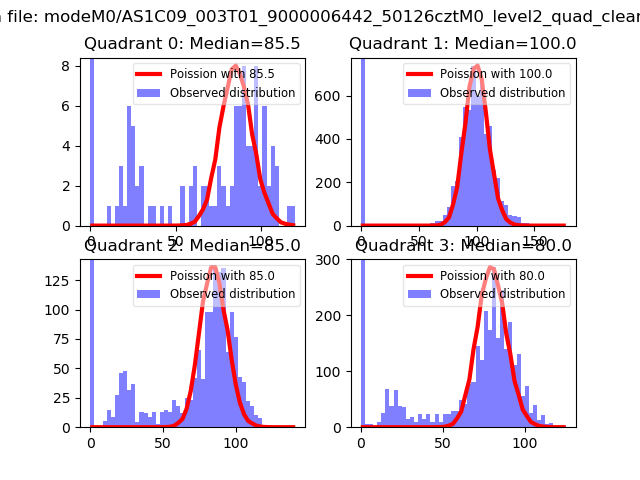 |
 |
| Quadrant-wise count rates Data is divided into 100 sec bins |
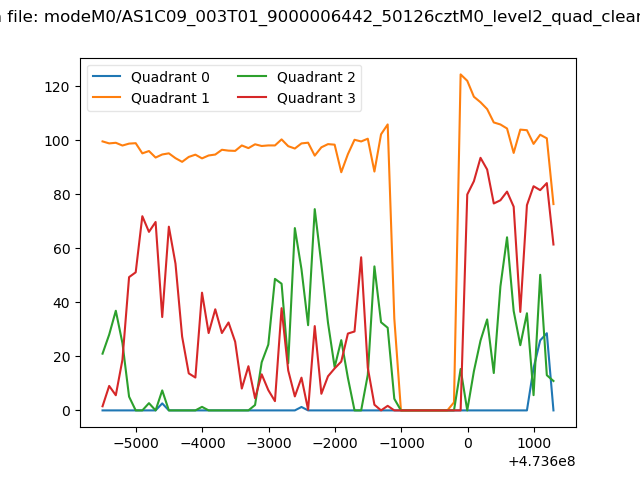 |
|
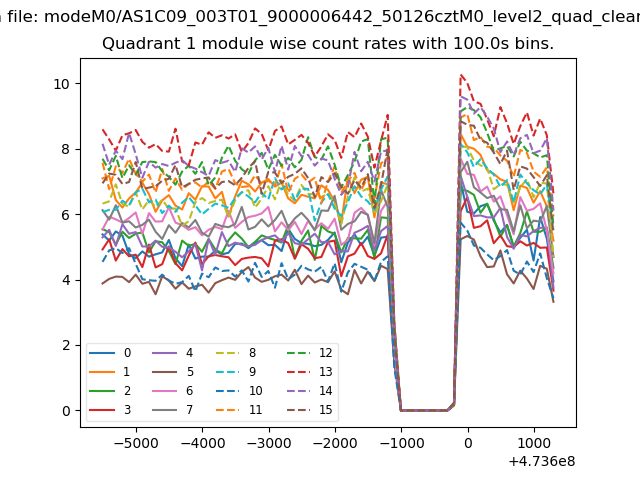
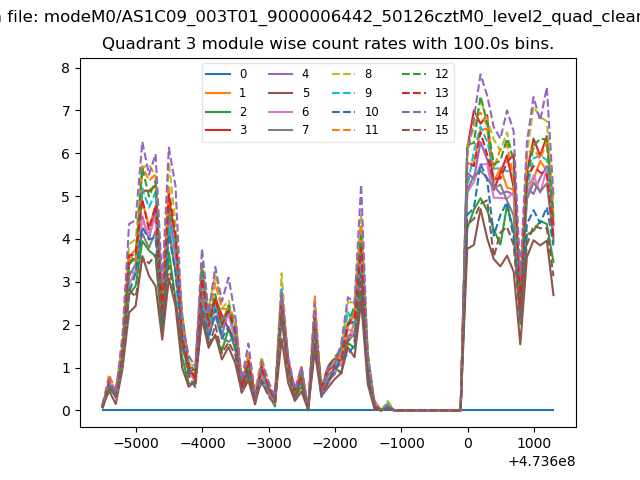
| Module-wise count rates for Quadrant A Data is divided into 100 sec bins |
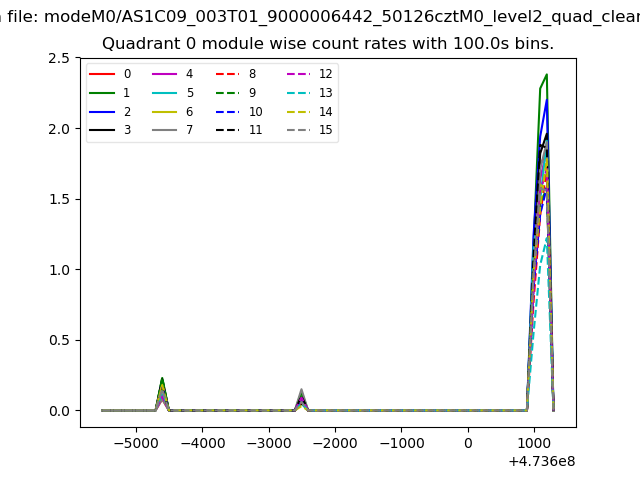 |
 |
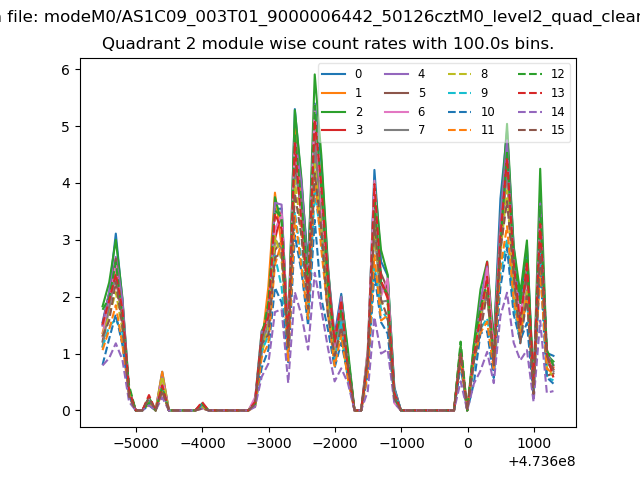
| Module-wise count rates for Quadrant B Data is divided into 100 sec bins |
 |
 |
| Module-wise count rates for Quadrant C Data is divided into 100 sec bins |
 |
 |
| Module-wise count rates for Quadrant D Data is divided into 100 sec bins |
 |
 |
| Parameter | Plot |
|---|---|
| CZT HV Monitor | 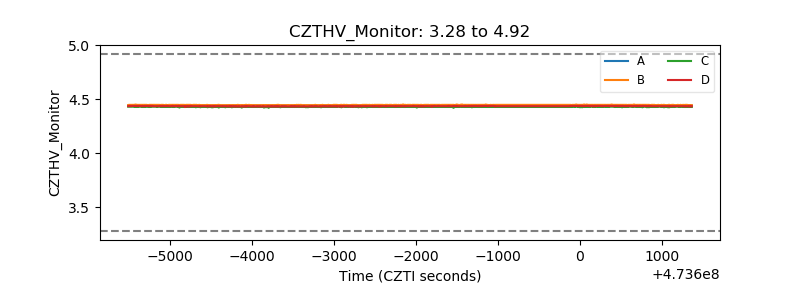 |
| D_VDD |  |
| Temperature 1 | 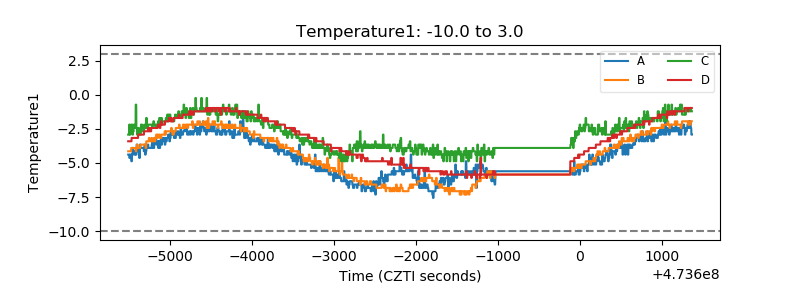 |
| Veto HV Monitor | 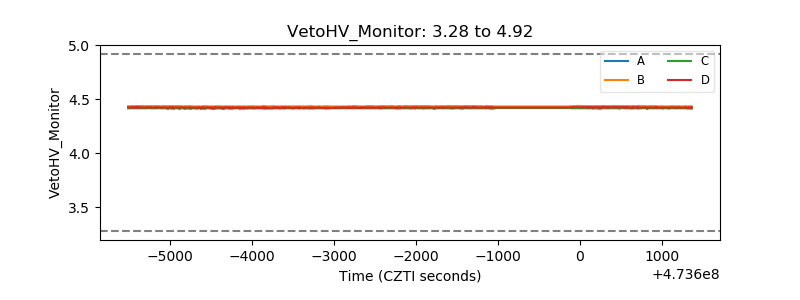 |
| Veto LLD | 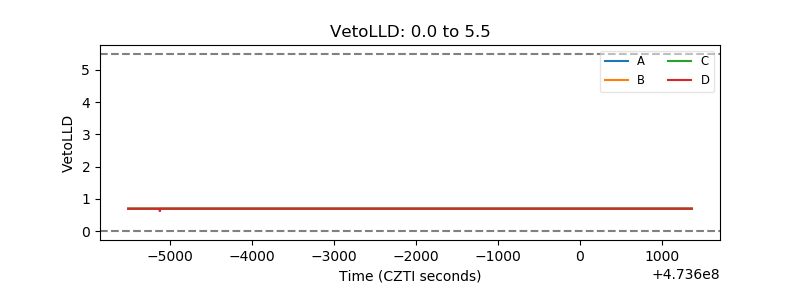 |
| Alpha Counter | 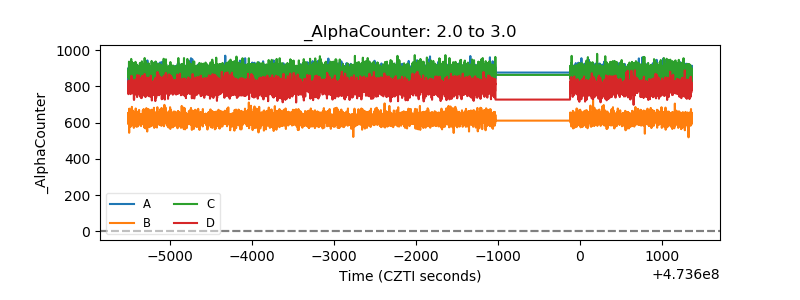 |
| _CPM_Rate | 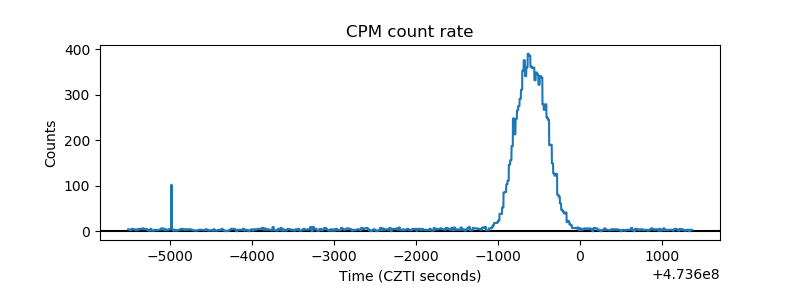 |
| CZT Counter | 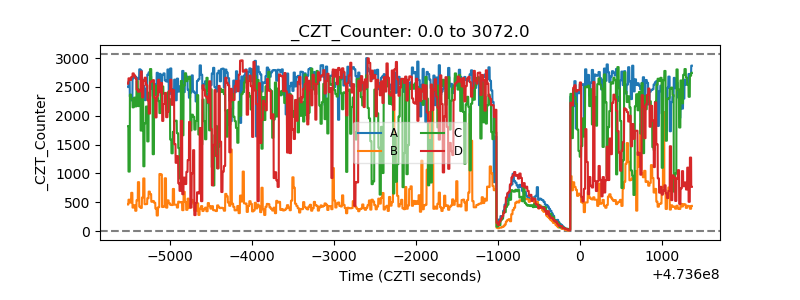 |
| +2.5 Volts monitor | 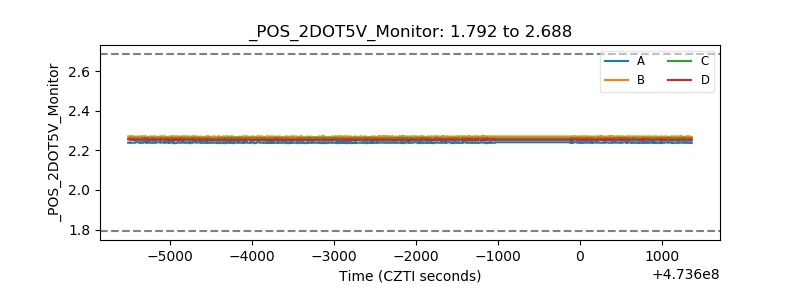 |
| +5 Volts monitor |  |
| _ROLL_ROT | 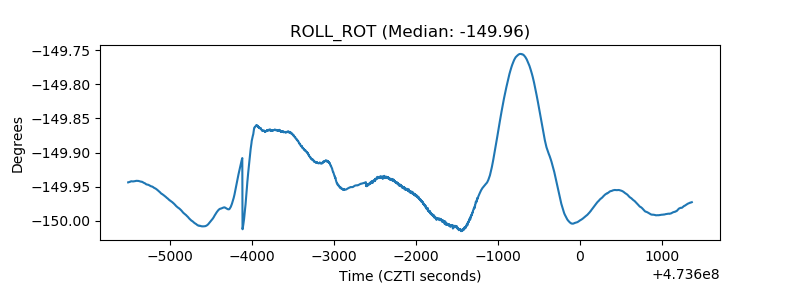 |
| _Roll_DEC | 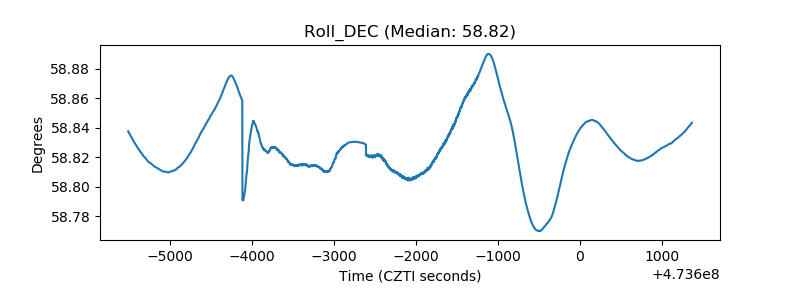 |
| _Roll_RA | 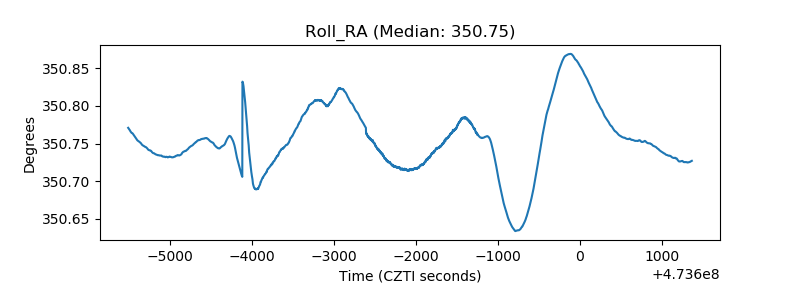 |
| Veto Counter | 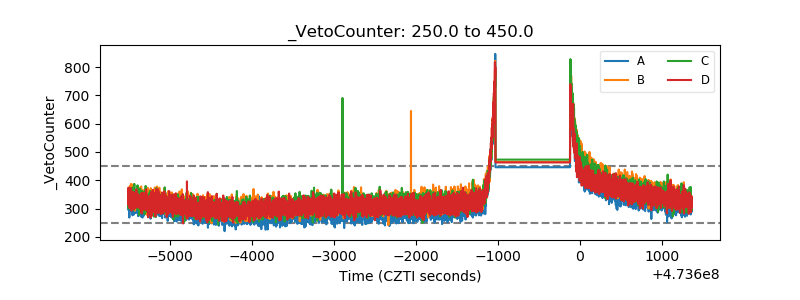 |