| Param | Original file | Final file |
|---|---|---|
| Filename | modeM0/AS1C09_003T01_9000006442_50129cztM0_level2.fits | modeM0/AS1C09_003T01_9000006442_50129cztM0_level2_quad_clean.evt |
| Size (bytes) | 1,222,701,120 | 45,601,920 |
| Size | 1.1 GB | 43.5 MB |
| Events in quadrant A | 15,644,574 | 18,069 |
| Events in quadrant B | 3,966,124 | 632,526 |
| Events in quadrant C | 12,968,052 | 56,494 |
| Events in quadrant D | 12,215,070 | 250,212 |
| Mode M9 | |||
|---|---|---|---|
| Quadrant | BADHDUFLAG | Total packets | Discarded packets |
| A | 0 | 12 | 0 |
| B | 0 | 12 | 0 |
| C | 0 | 12 | 0 |
| D | 0 | 12 | 0 |
| Mode M0 | |||
|---|---|---|---|
| Quadrant | BADHDUFLAG | Total packets | Discarded packets |
| A | 0 | 50569 | 7 |
| B | 0 | 15887 | 1 |
| C | 0 | 42671 | 1 |
| D | 0 | 40477 | 1 |
| Mode SS | |||
|---|---|---|---|
| Quadrant | BADHDUFLAG | Total packets | Discarded packets |
| A | 0 | 122 | 0 |
| B | 0 | 122 | 0 |
| C | 0 | 122 | 0 |
| D | 0 | 122 | 0 |
| Quadrant | Total seconds | Saturated seconds | Saturation percentage |
|---|---|---|---|
| A | 6061 | 5923 | 97.723148% |
| B | 6061 | 204 | 3.365781% |
| C | 6062 | 5548 | 91.520950% |
| D | 6062 | 3578 | 59.023425% |
Noise dominated data is calculated using 1-second bins in cleaned event files. If a bin has >2000 counts, and if more than 50% of those come from <1% of pixels, then it is considered to be noise-dominated and hence unusable.
| Quadrant | # 1 sec bins | Bins with >0 counts | Bins with >2000 counts | High rate bins dominated by noise | Noise dominated (total time) | Noise dominated (detector-on time) | Marked lightcurve |
|---|---|---|---|---|---|---|---|
| A | 7201 | 6061 | 5583 | 5583 | 77.53% | 92.11% | 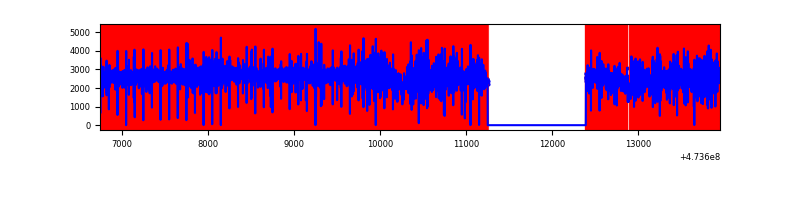 |
| B | 7201 | 6062 | 130 | 130 | 1.81% | 2.14% | 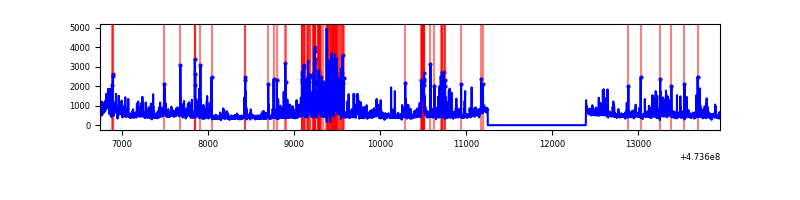 |
| C | 7201 | 6061 | 3862 | 3862 | 53.63% | 63.72% | 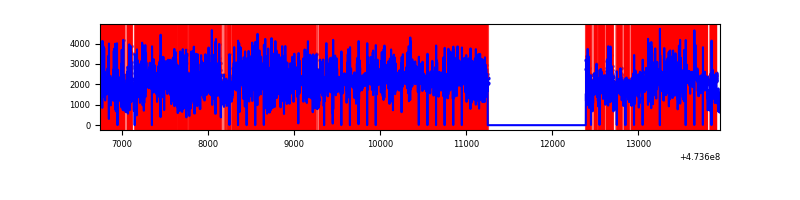 |
| D | 7202 | 6062 | 3162 | 3162 | 43.90% | 52.16% | 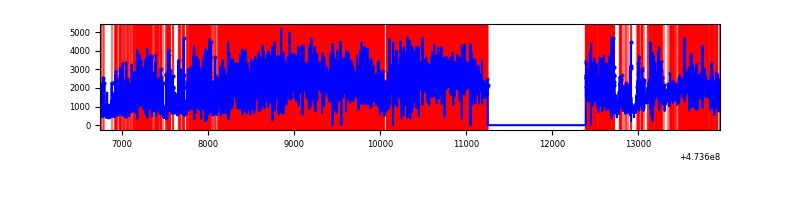 |
Top three noisy pixels from each quadrant. If the there are fewer than three noisy pixels in the level2.evt file, extra rows are filled as -1
| Pixel properties | Quadrant properties | ||||||
|---|---|---|---|---|---|---|---|
| Quadrant | DetID | PixID | Counts | Sigma | Mean | Median | Sigma |
| A | 6 | 250 | 11417534 | 148847.72 | 273 | 265 | 76.7 |
| A | 4 | 13 | 644605 | 8400.3 | 273 | 265 | 76.7 |
| A | 8 | 8 | 593347 | 7732.05 | 273 | 265 | 76.7 |
| B | 2 | 176 | 391875 | 2928.76 | 626 | 607 | 133.6 |
| B | 4 | 170 | 212904 | 1589.11 | 626 | 607 | 133.6 |
| B | 0 | 200 | 135526 | 1009.91 | 626 | 607 | 133.6 |
| C | 4 | 111 | 5030973 | 87672.69 | 196 | 194 | 57.4 |
| C | 15 | 214 | 4532992 | 78994.24 | 196 | 194 | 57.4 |
| C | 15 | 197 | 621787 | 10832.66 | 196 | 194 | 57.4 |
| D | 15 | 168 | 2204877 | 16606.43 | 452 | 435 | 132.7 |
| D | 12 | 6 | 1168781 | 8801.35 | 452 | 435 | 132.7 |
| D | 15 | 106 | 1144096 | 8615.39 | 452 | 435 | 132.7 |
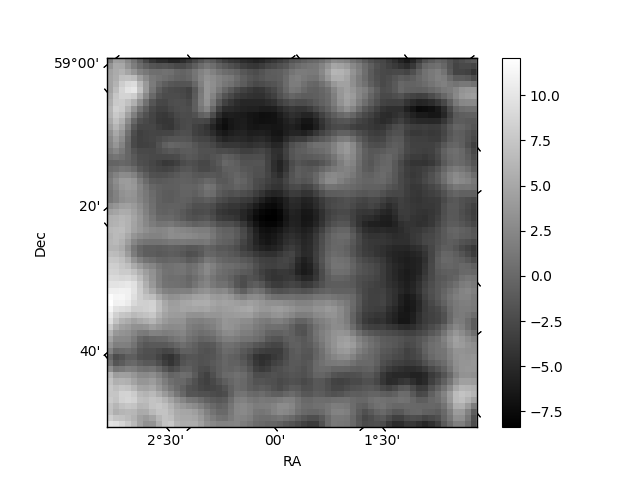
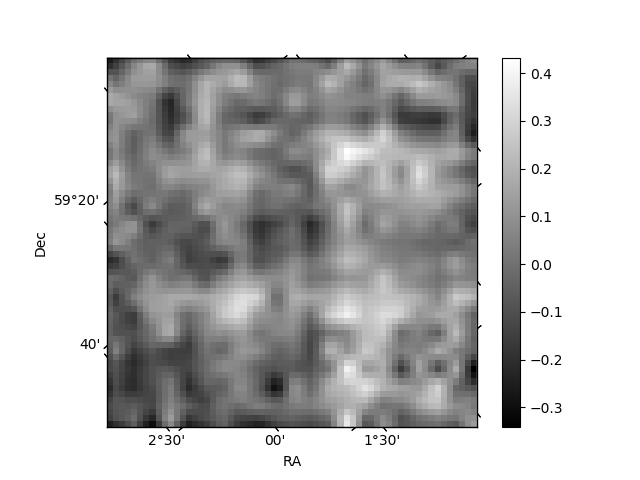
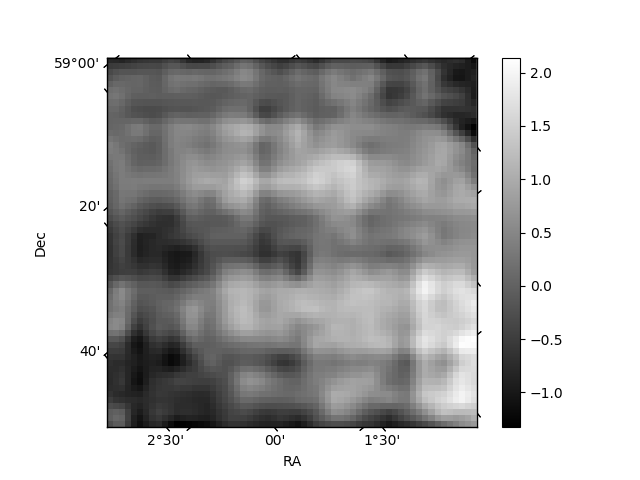
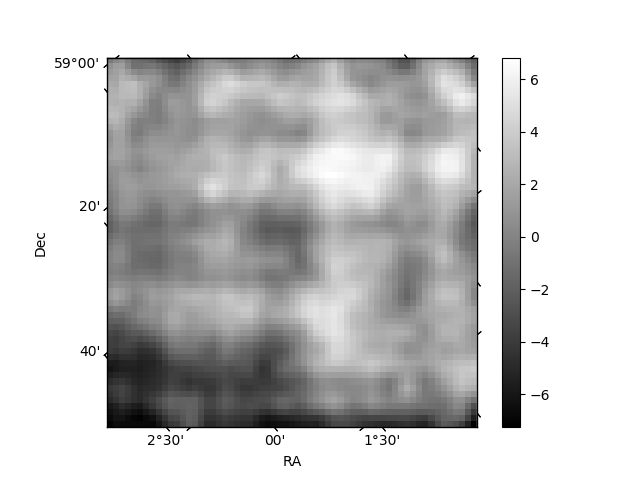
Histogram calculated using DETX and DETY for each event in the final _common_clean file
| Quadrant A | 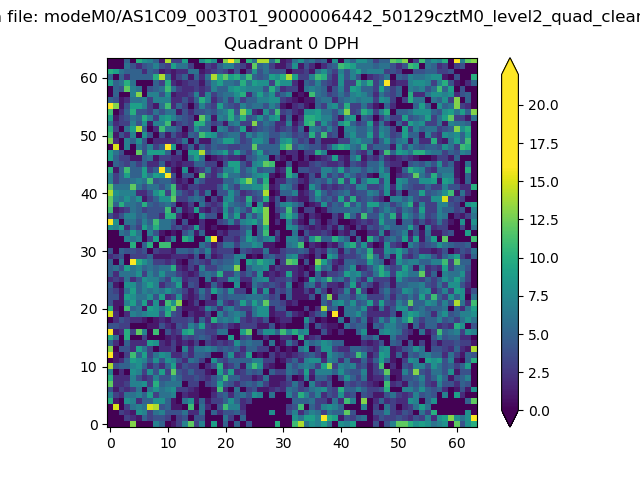 |
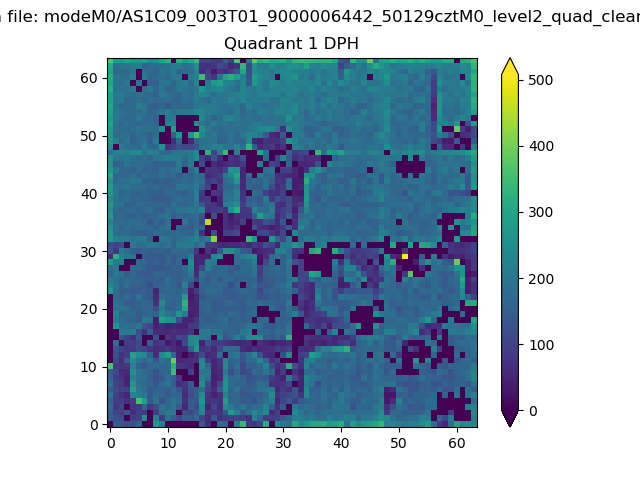 |
Quadrant B |
|---|---|---|---|
| Quadrant D | 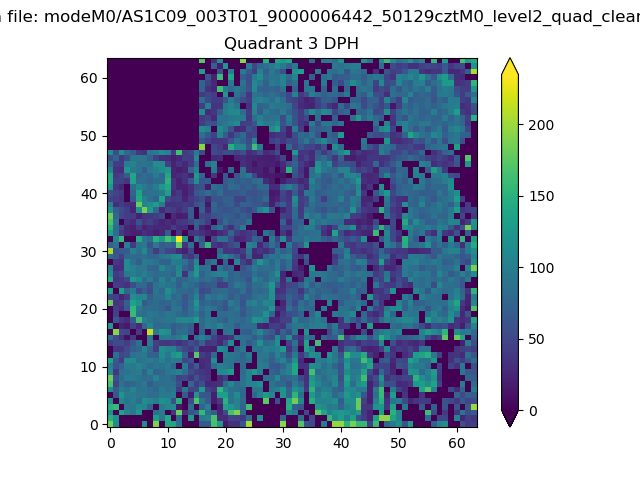 |
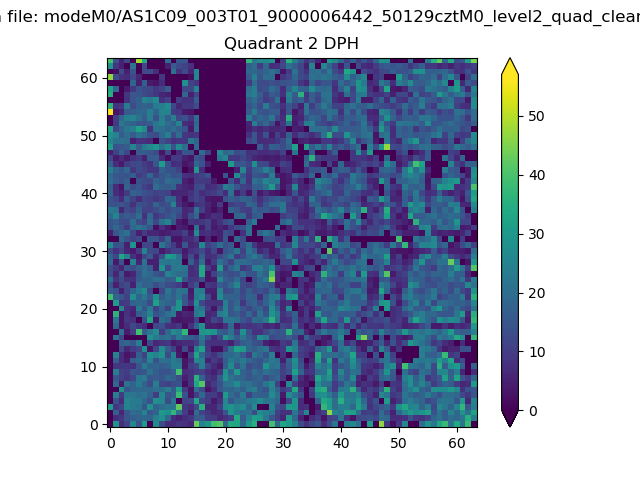 |
Quadrant C |
| Plot type | Count rate plots | Images |
|---|---|---|
| Comparison with Poisson distribution Blue bars denote a histogram of data divided into 1 sec bins. Red curve is a Poisson curve with rate = median count rate of data. |
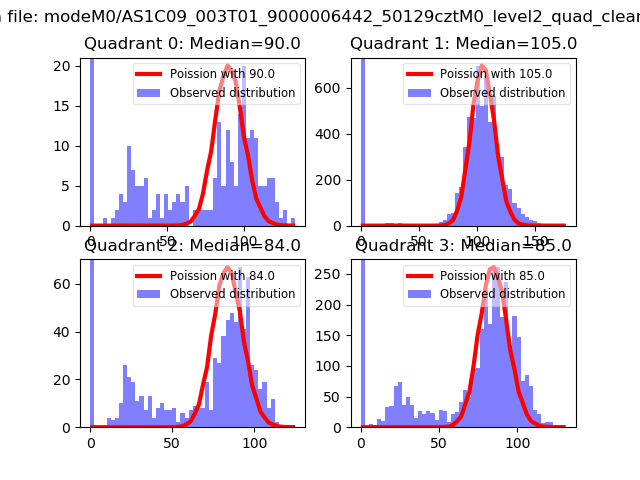 |
 |
| Quadrant-wise count rates Data is divided into 100 sec bins |
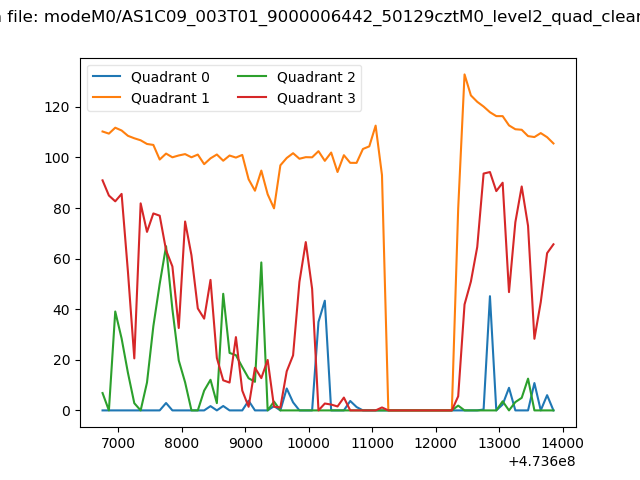 |
|
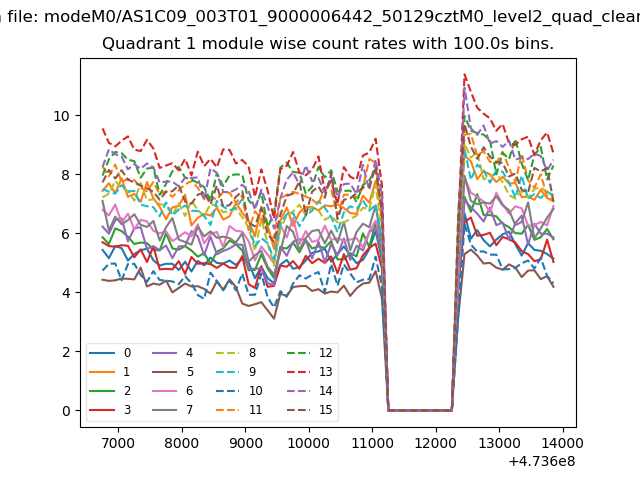
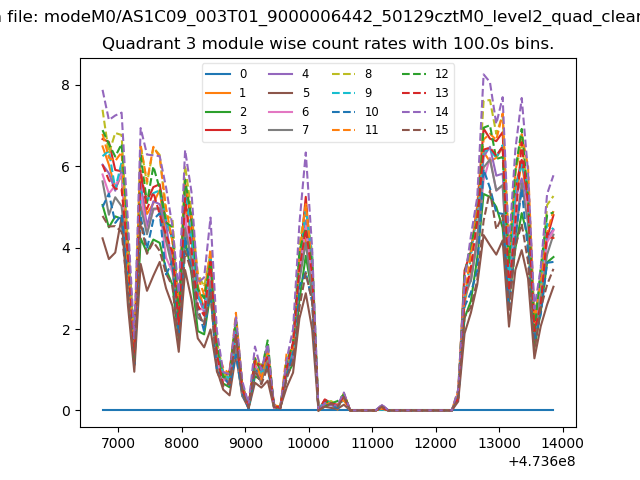
| Module-wise count rates for Quadrant A Data is divided into 100 sec bins |
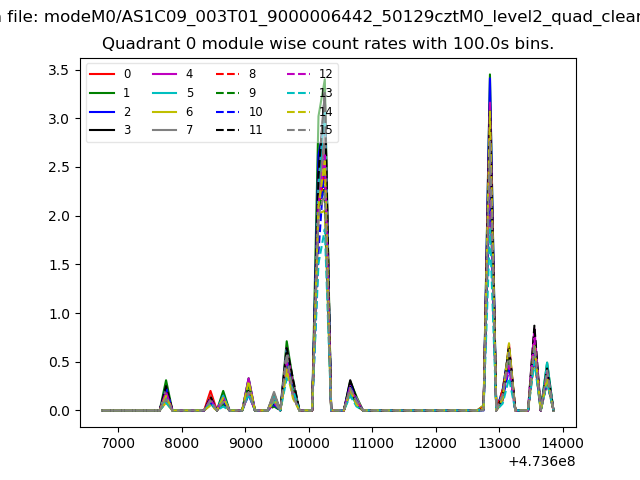 |
 |
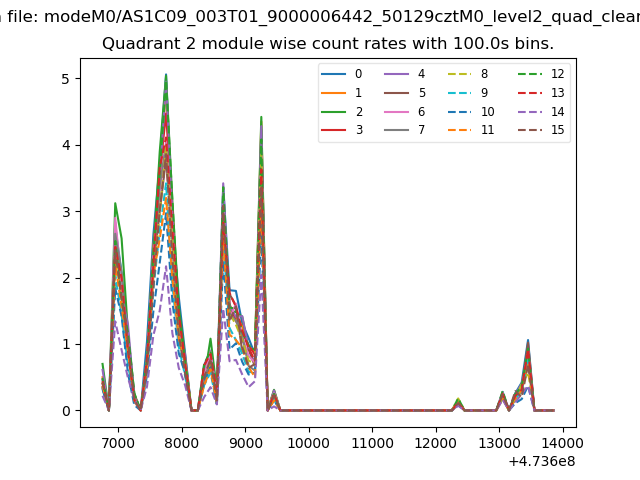
| Module-wise count rates for Quadrant B Data is divided into 100 sec bins |
 |
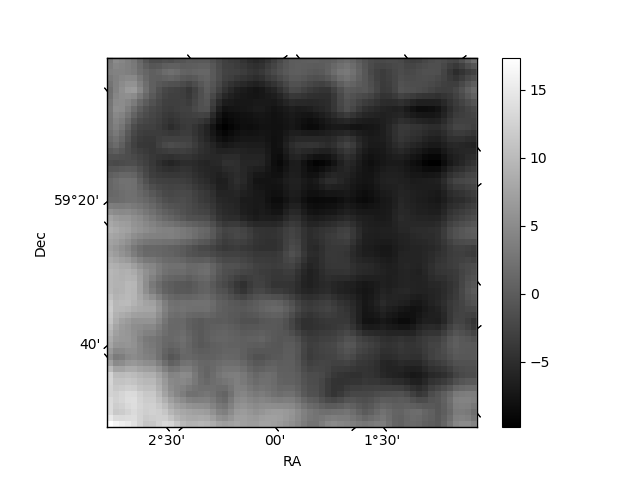 |
| Module-wise count rates for Quadrant C Data is divided into 100 sec bins |
 |
 |
| Module-wise count rates for Quadrant D Data is divided into 100 sec bins |
 |
 |
| Parameter | Plot |
|---|---|
| CZT HV Monitor | 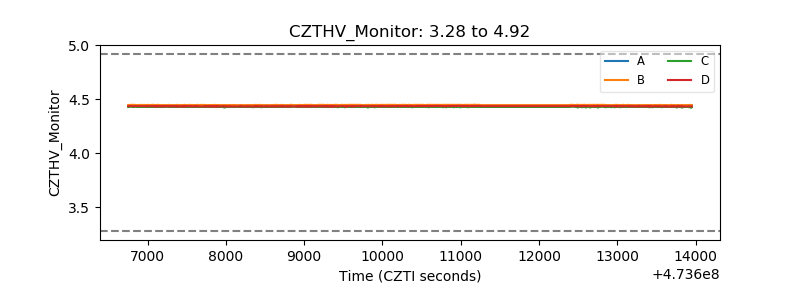 |
| D_VDD | 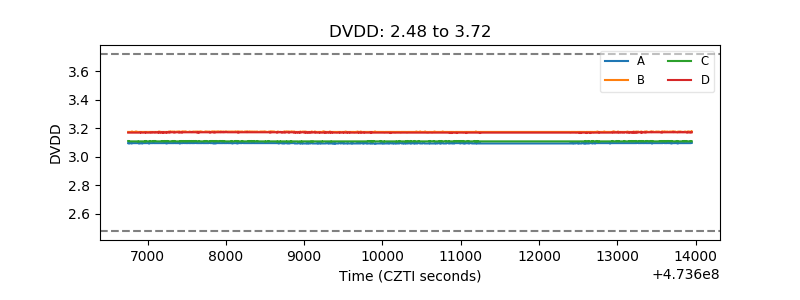 |
| Temperature 1 | 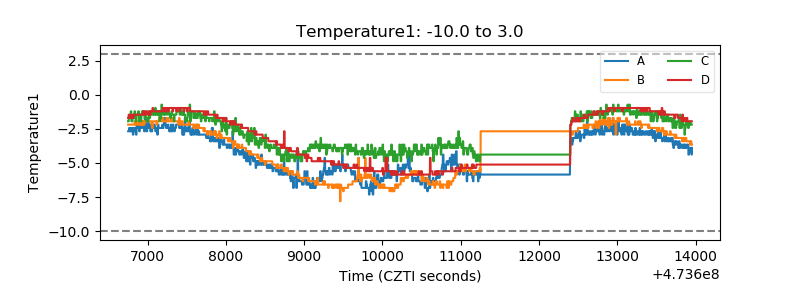 |
| Veto HV Monitor | 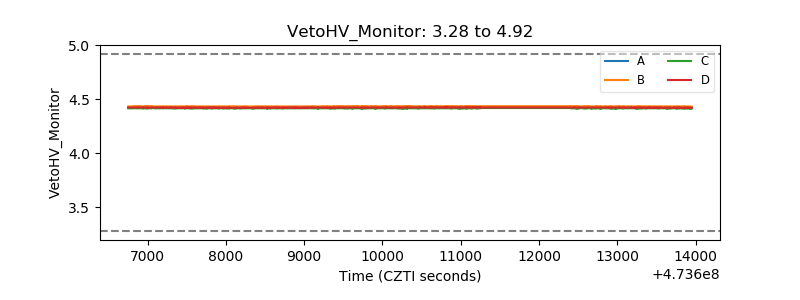 |
| Veto LLD | 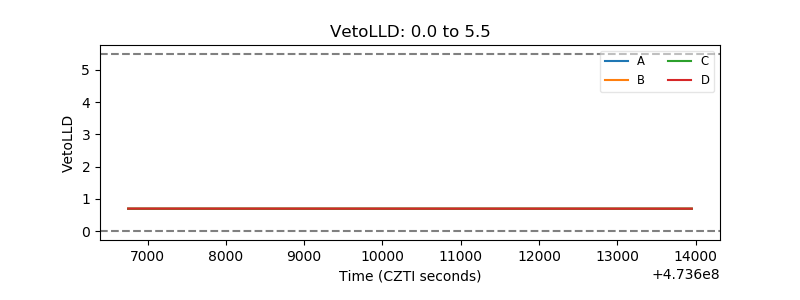 |
| Alpha Counter | 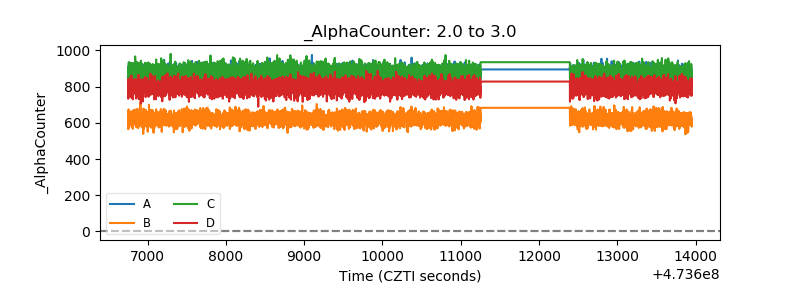 |
| _CPM_Rate | 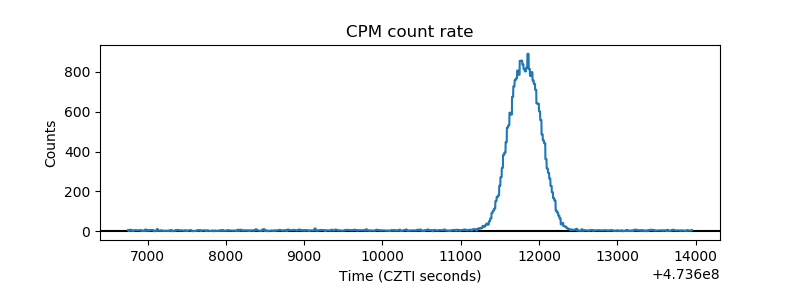 |
| CZT Counter | 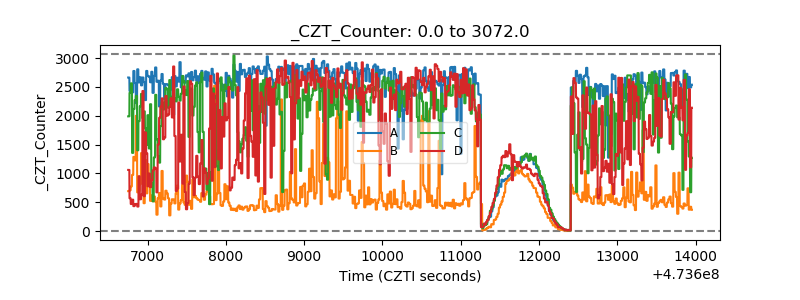 |
| +2.5 Volts monitor | 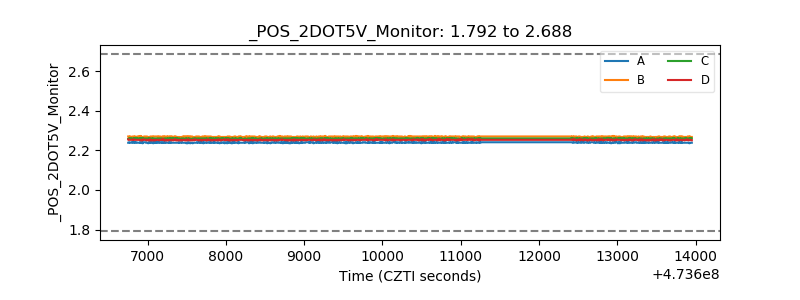 |
| +5 Volts monitor | 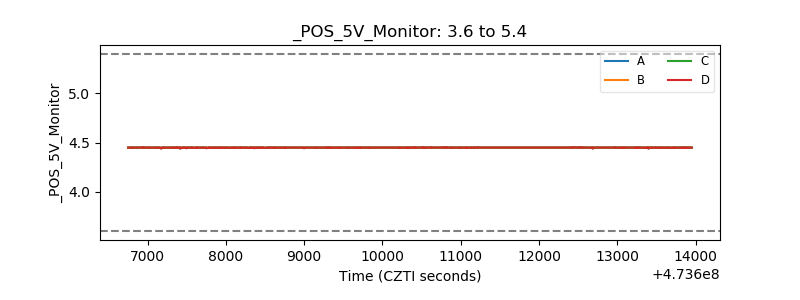 |
| _ROLL_ROT | 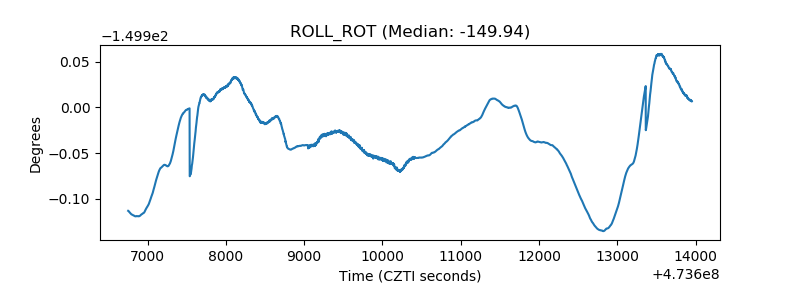 |
| _Roll_DEC | 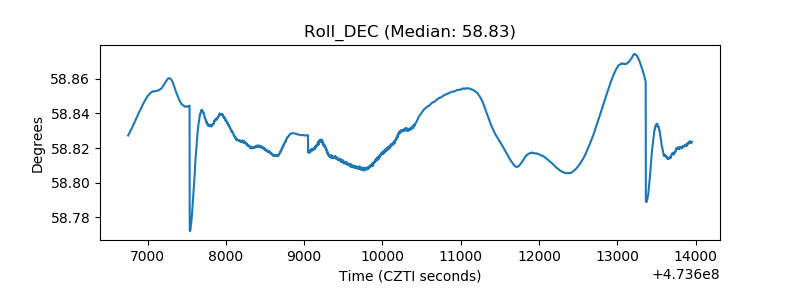 |
| _Roll_RA | 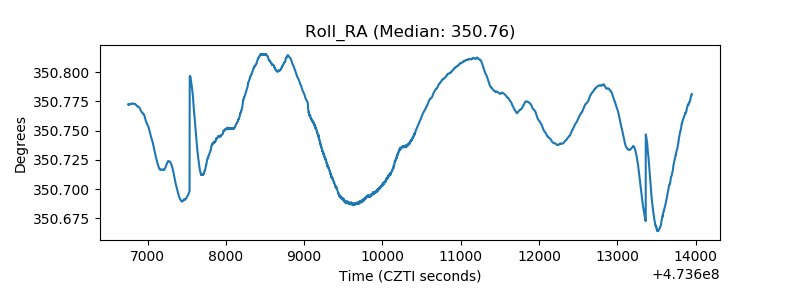 |
| Veto Counter | 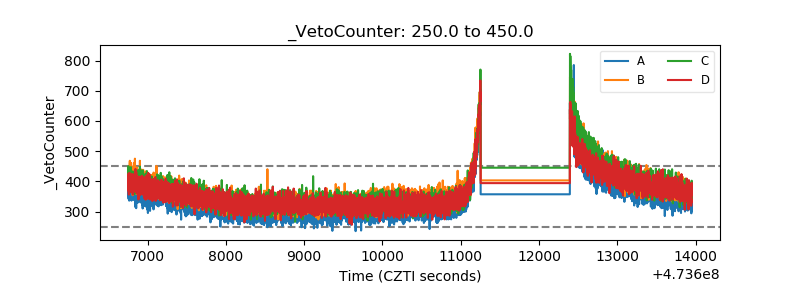 |