| Param | Original file | Final file |
|---|---|---|
| Filename | modeM0/AS1C09_003T01_9000006442_50130cztM0_level2.fits | modeM0/AS1C09_003T01_9000006442_50130cztM0_level2_quad_clean.evt |
| Size (bytes) | 1,096,090,560 | 52,957,440 |
| Size | 1.0 GB | 50.5 MB |
| Events in quadrant A | 13,823,422 | 114,230 |
| Events in quadrant B | 3,331,475 | 631,023 |
| Events in quadrant C | 12,067,504 | 137,915 |
| Events in quadrant D | 10,893,075 | 304,758 |
| Mode M9 | |||
|---|---|---|---|
| Quadrant | BADHDUFLAG | Total packets | Discarded packets |
| A | 0 | 12 | 0 |
| B | 0 | 12 | 0 |
| C | 0 | 12 | 0 |
| D | 0 | 12 | 0 |
| Mode M0 | |||
|---|---|---|---|
| Quadrant | BADHDUFLAG | Total packets | Discarded packets |
| A | 0 | 45102 | 1 |
| B | 0 | 13952 | 1 |
| C | 0 | 39922 | 7 |
| D | 0 | 36495 | 1 |
| Mode SS | |||
|---|---|---|---|
| Quadrant | BADHDUFLAG | Total packets | Discarded packets |
| A | 0 | 120 | 0 |
| B | 0 | 120 | 0 |
| C | 0 | 120 | 0 |
| D | 0 | 120 | 0 |
| Quadrant | Total seconds | Saturated seconds | Saturation percentage |
|---|---|---|---|
| A | 5944 | 5048 | 84.925976% |
| B | 5945 | 99 | 1.665265% |
| C | 5944 | 4671 | 78.583445% |
| D | 5944 | 2789 | 46.921265% |
Noise dominated data is calculated using 1-second bins in cleaned event files. If a bin has >2000 counts, and if more than 50% of those come from <1% of pixels, then it is considered to be noise-dominated and hence unusable.
| Quadrant | # 1 sec bins | Bins with >0 counts | Bins with >2000 counts | High rate bins dominated by noise | Noise dominated (total time) | Noise dominated (detector-on time) | Marked lightcurve |
|---|---|---|---|---|---|---|---|
| A | 7104 | 5945 | 4535 | 4535 | 63.84% | 76.28% | 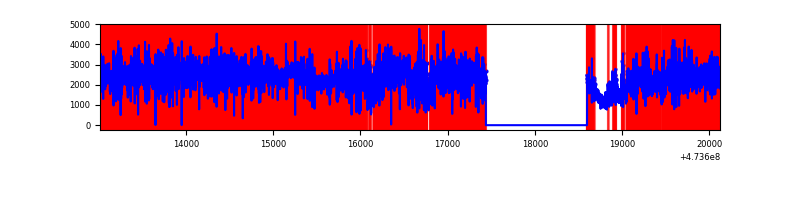 |
| B | 7105 | 5946 | 46 | 46 | 0.65% | 0.77% | 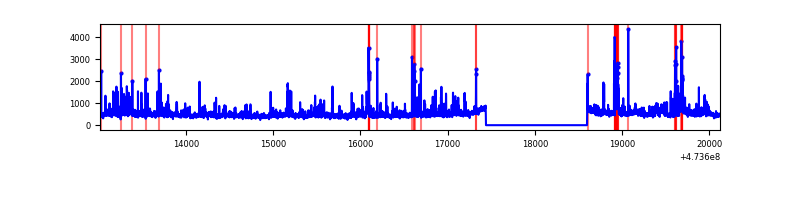 |
| C | 7103 | 5944 | 3133 | 3133 | 44.11% | 52.71% | 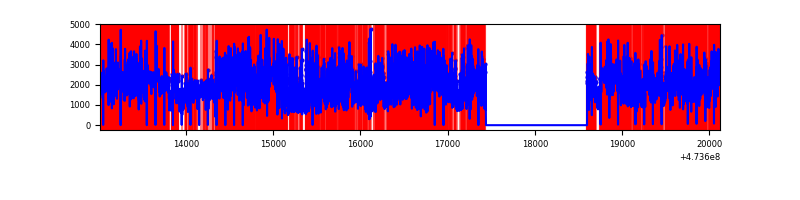 |
| D | 7104 | 5945 | 2590 | 2590 | 36.46% | 43.57% | 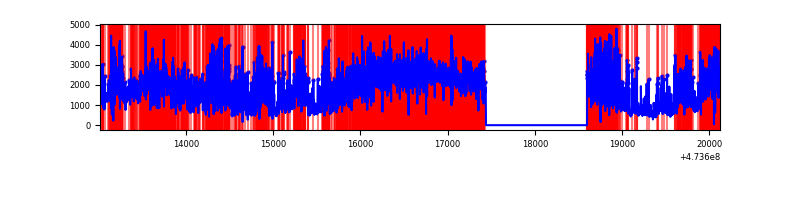 |
Top three noisy pixels from each quadrant. If the there are fewer than three noisy pixels in the level2.evt file, extra rows are filled as -1
| Pixel properties | Quadrant properties | ||||||
|---|---|---|---|---|---|---|---|
| Quadrant | DetID | PixID | Counts | Sigma | Mean | Median | Sigma |
| A | 6 | 250 | 6796270 | 70317.12 | 383 | 374 | 96.6 |
| A | 4 | 13 | 1851324 | 19151.77 | 383 | 374 | 96.6 |
| A | 8 | 8 | 1563517 | 16173.84 | 383 | 374 | 96.6 |
| B | 5 | 185 | 125604 | 959.35 | 620 | 600 | 130.3 |
| B | 0 | 216 | 125424 | 957.97 | 620 | 600 | 130.3 |
| B | 0 | 200 | 103160 | 787.1 | 620 | 600 | 130.3 |
| C | 4 | 111 | 6605912 | 80938.58 | 284 | 282 | 81.6 |
| C | 15 | 230 | 1254057 | 15362.47 | 284 | 282 | 81.6 |
| C | 15 | 213 | 727860 | 8914.99 | 284 | 282 | 81.6 |
| D | 15 | 106 | 2196173 | 15143.73 | 497 | 479 | 145.0 |
| D | 15 | 139 | 1230241 | 8481.68 | 497 | 479 | 145.0 |
| D | 12 | 6 | 964221 | 6646.94 | 497 | 479 | 145.0 |
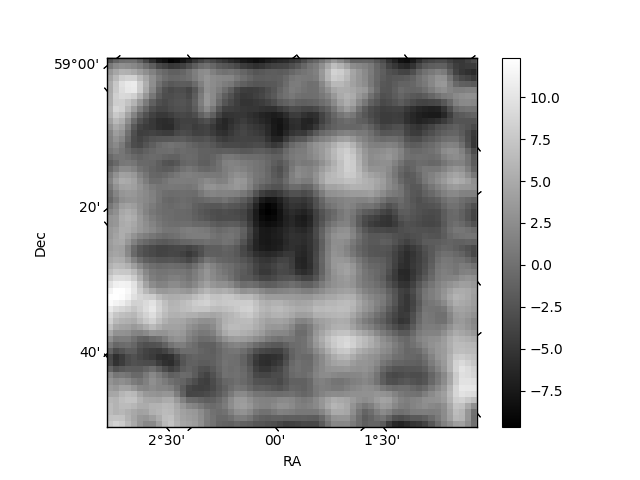
Histogram calculated using DETX and DETY for each event in the final _common_clean file
| Quadrant A | 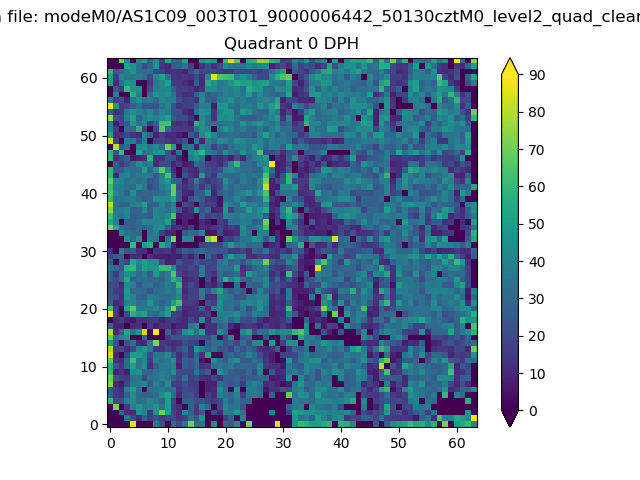 |
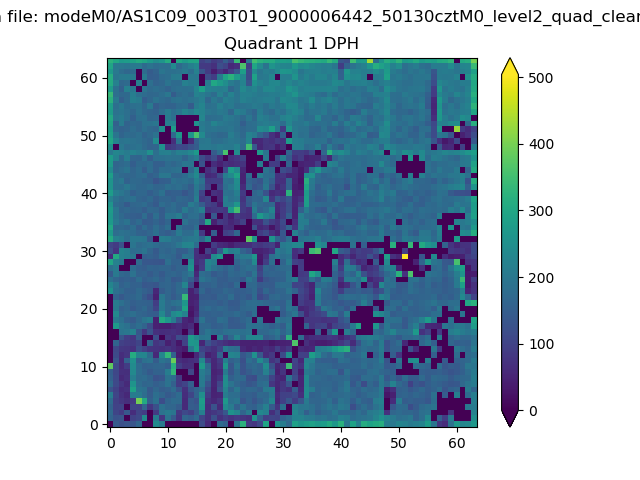 |
Quadrant B |
|---|---|---|---|
| Quadrant D | 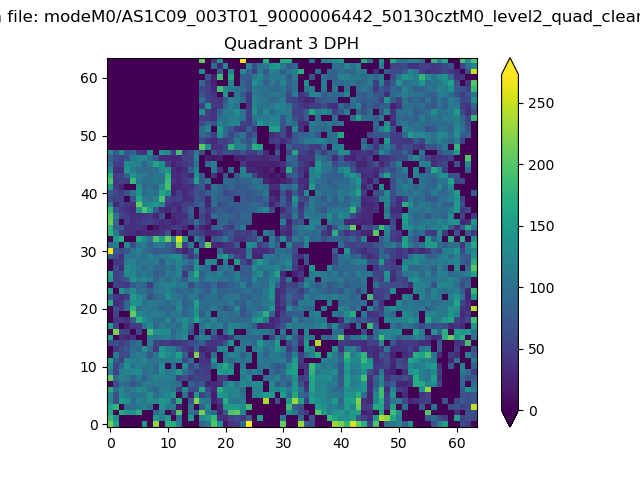 |
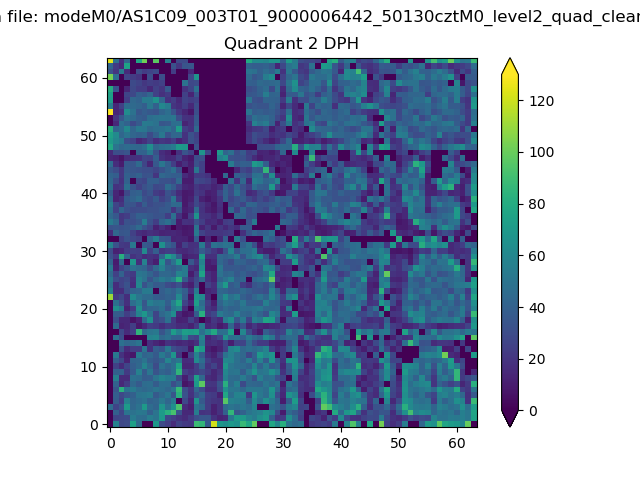 |
Quadrant C |
| Plot type | Count rate plots | Images |
|---|---|---|
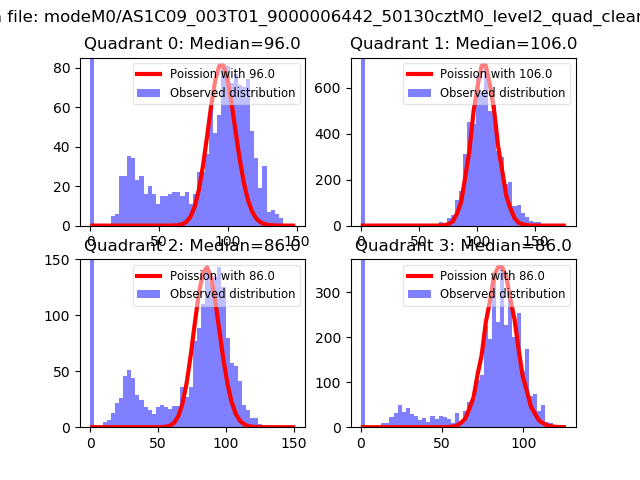
| Comparison with Poisson distribution Blue bars denote a histogram of data divided into 1 sec bins. Red curve is a Poisson curve with rate = median count rate of data. |
 |
 |
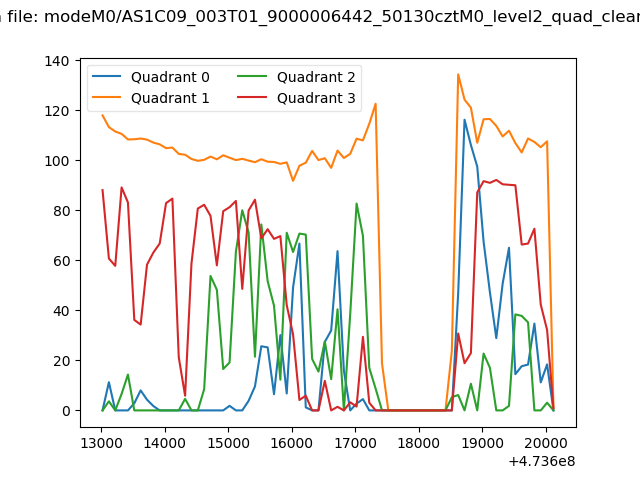
| Quadrant-wise count rates Data is divided into 100 sec bins |
 |
|
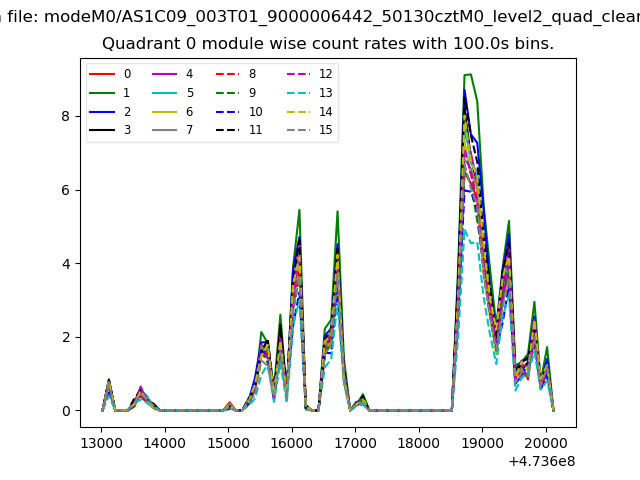
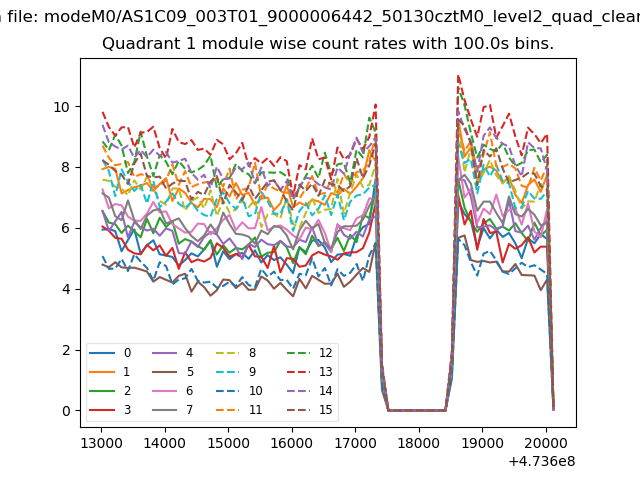
| Module-wise count rates for Quadrant A Data is divided into 100 sec bins |
 |
 |
| Module-wise count rates for Quadrant B Data is divided into 100 sec bins |
 |
 |
| Module-wise count rates for Quadrant C Data is divided into 100 sec bins |
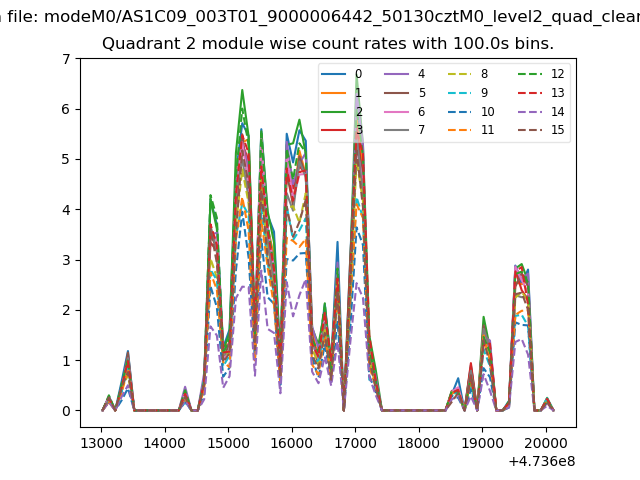 |
 |
| Module-wise count rates for Quadrant D Data is divided into 100 sec bins |
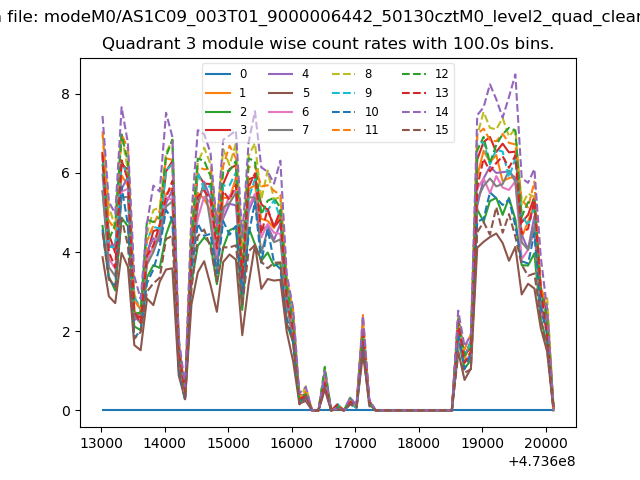 |
 |
| Parameter | Plot |
|---|---|
| CZT HV Monitor | 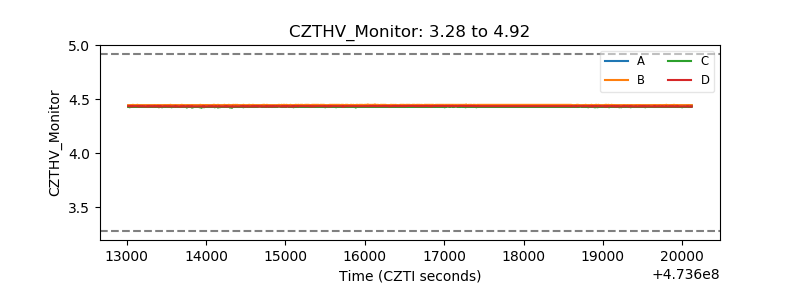 |
| D_VDD |  |
| Temperature 1 | 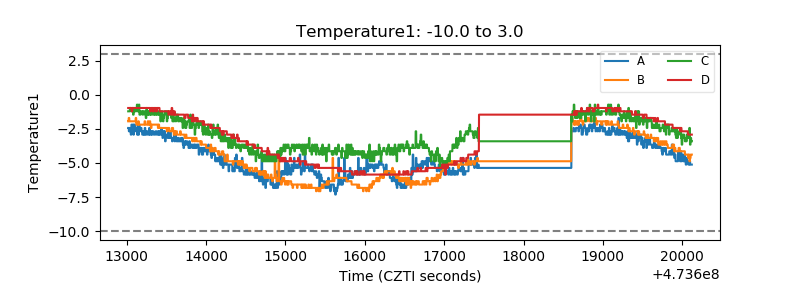 |
| Veto HV Monitor | 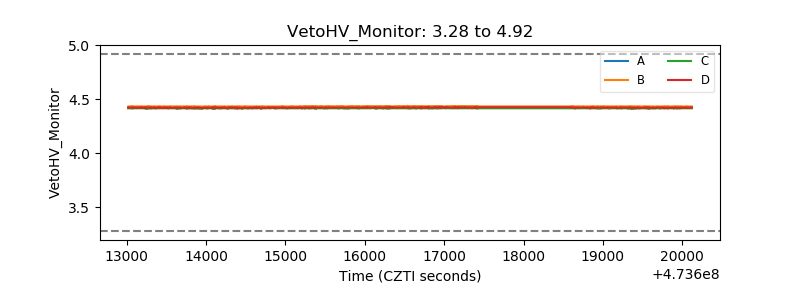 |
| Veto LLD | 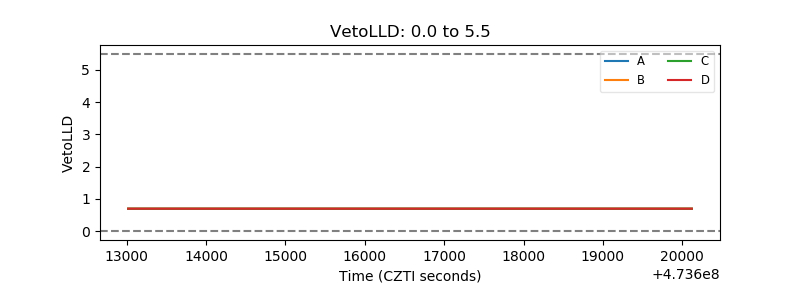 |
| Alpha Counter | 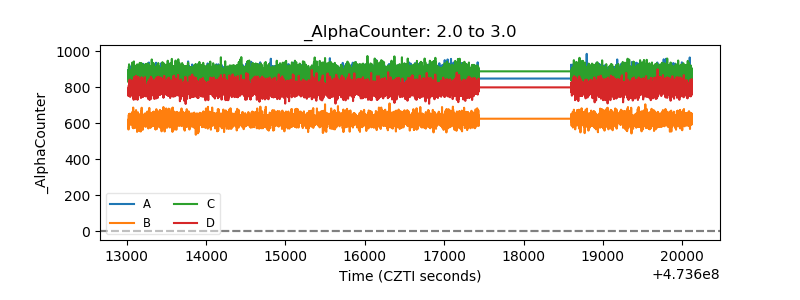 |
| _CPM_Rate | 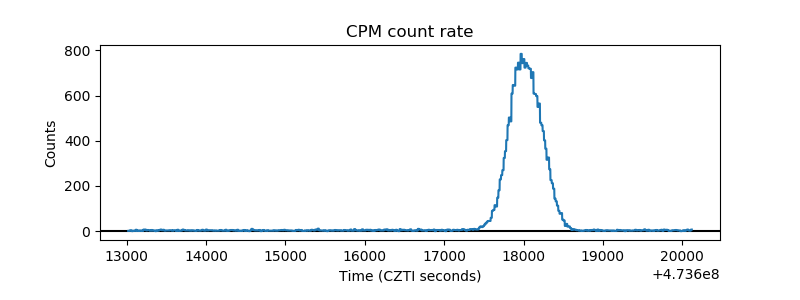 |
| CZT Counter | 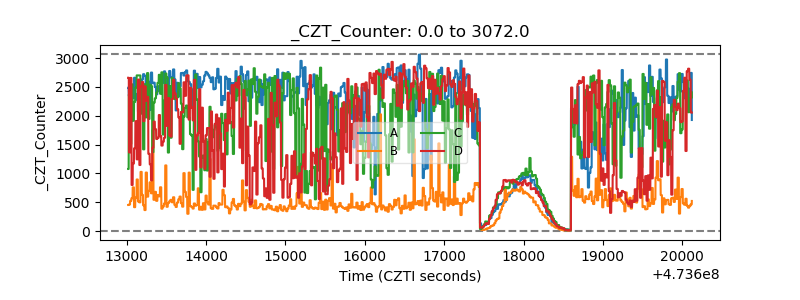 |
| +2.5 Volts monitor | 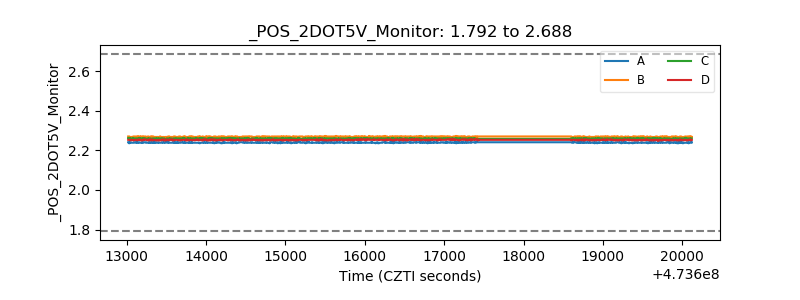 |
| +5 Volts monitor | 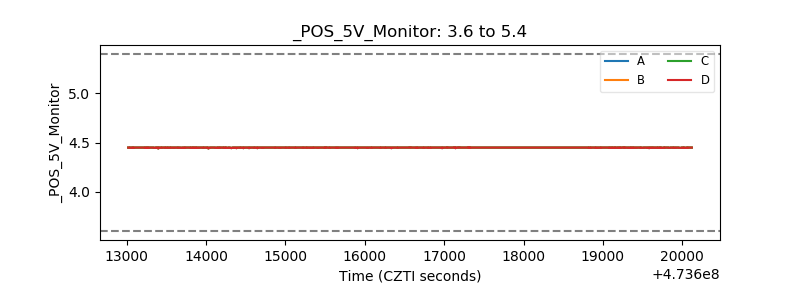 |
| _ROLL_ROT | 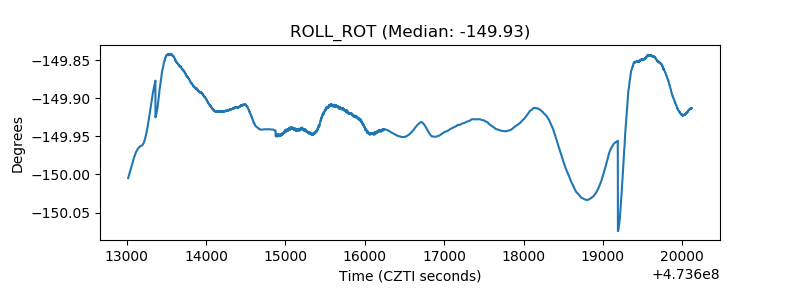 |
| _Roll_DEC | 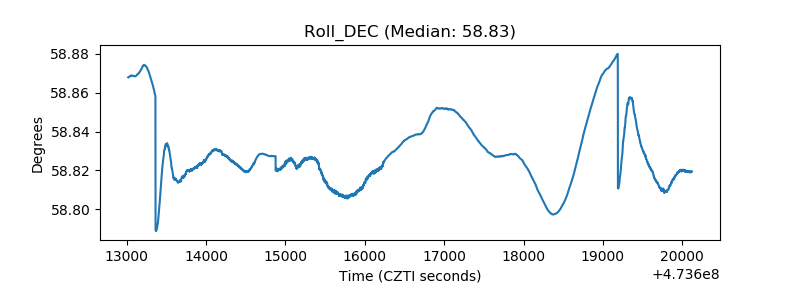 |
| _Roll_RA | 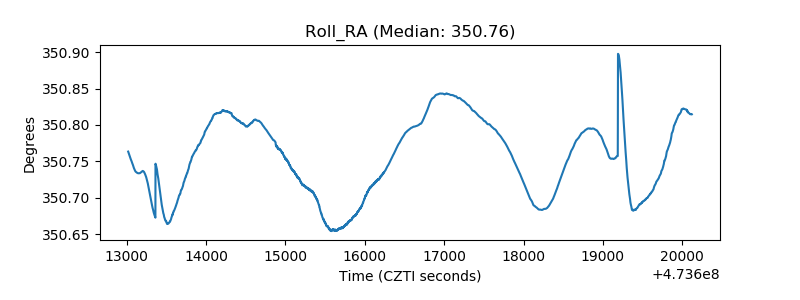 |
| Veto Counter | 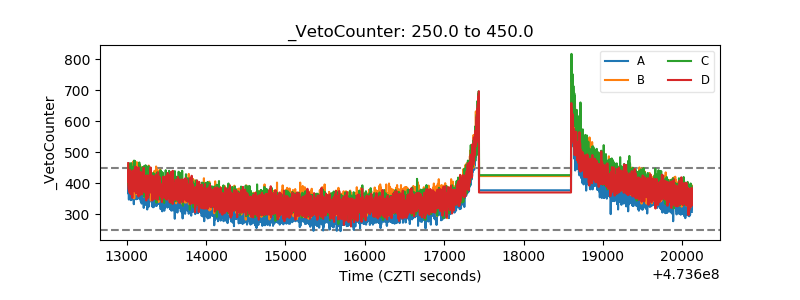 |